Implications
A total of 26 traits related to individual cow milk quantity and quality, coagulation and cheese yield have been replaced by 10 unobserved latent variables by making use of the measured phenotypes’ correlations. Results of genetic analysis were coherent to the underlying structure that each factor represented and the genetic parameters in favor for application in breeding programs. Being consistent with previous studies, our work demonstrates the usefulness of latent variables in dairy cattle breeding.
Introduction
A considerable amount of dairy cattle milk is destined for cheese production, and an interest for breeding focusing on cow’s cheese-making ability exists (Food and Agriculture Organization of the United Nations, 2015). Cheese production is the result of a complex process. Cheese-making characteristics, such as the quantity of cheese obtained from a given amount of milk (cheese yield (CY)), milk coagulation properties (MCP) and measures of curd firmness (CF) as well as milk quality characteristics (e.g. percentage of protein and fat in the milk), are basic components of the cheese-making process.
Previous analysis have shown considerable genetic variation of MCP (Cecchinato et al., Reference Cecchinato, Chessa, Ribeca, Cipolat-Gotet, Bobbo, Casellas and Bittante2015), milk protein composition (Schopen et al., Reference Stocco, Cipolat-Gotet, Bobbo, Cecchinato and Bittante2009) and CY traits (Bittante et al., Reference Bittante, Cipolat-Gotet and Cecchinato2013). However, breeding goals usually include a variety of traits focused not only on production, but also on health status, longevity, reproduction of cows, etc. Nevertheless, a large number of traits into a selection index creates difficulties in interpretation and computations. Multivariate factor analysis (MFA) offers a solution to alleviate the problem of dimensionality, while keeping the same underlying concept that the measure variables represent in the analysis. Moreover, it helps in understanding complex correlation structures. Based on these characteristics, previous studies investigated the application of MFA for a variety of traits in dairy cows, such as milk composition and MCP (Macciotta et al., Reference Macciotta, Cecchinato, Mele and Bittante2012) and for milk fatty acids (Conte et al., Reference Conte, Serra, Cremonesi, Chessa, Castiglioni, Cappucci, Bulleri and Mele2016; Mele et al., Reference Mele, Macciotta, Cecchinato, Conte, Schiavon and Bittante2016). However, to our knowledge, there are no studies reported in literature that dealt with MFA and protein profile. Moreover, milk protein fractions have been never considered in combination with milk technological traits to represent the complexity of cheese-making process.
The core of MFA is that a given set of n observed variables can be replaced by p latent variables (factors; Fs) with p<n, based on their covariance structure (Bollen, Reference Bollen2014). The observed variables are linear functions of the Fs. As such, MFA focuses in understanding the latent background of the measured variables. In this way, only a reduced data space is used for further analysis, which, however, contains the basic underlying concept of the research interest.
Using MFA, our goal was to estimate the genetic parameters of a set of latent phenotypes extracted from a group of 26 traits related to milk quantity and quality, detailed protein composition, MCP and CF, and cheese-making.
Material and methods
Animals
In total, 1264 Italian Brown Swiss cows were included in our analysis. Cows were sampled from 85 herds located in Trento Province (Italy). Details on the sampling procedure are given in (Cipolat-Gotet et al., Reference Cipolat-Gotet, Cecchinato, De Marchi and Bittante2013). In summary, one sample was obtained per cow (evening milking). On average, ~15 cows were sampled per herd. samples were processed after collection with an interval of 20 h. Each sampled cow had known ancestors for at least four generations and the pedigree file included 8845 animals. Pedigree information was provided by the Italian Brown Swiss Cattle Breeders Association (ANARB, Verona, Italy).
Milk quality
All milk subsamples were analyzed using MilkoScan FT6000 (Foss, Hillerød, Denmark) for fat, protein and lactose as well as casein contents. The pH was obtained using a Crison Basic 25 electrode (Crison, Barcelona, Spain). Somatic cell count values were measured by Fossomatic FC counter (Foss, Hillerød, Denmark) and were log-transformed to somatic cell score (Ali and Shook, Reference Ali and Shook1980).
Milk protein fractions
The casein fractions [αs1-, αs2-, β-, κ- casein (CN)], βlactoglobulin (β-LG) and α-lactalbumin (α-LA) were obtained by the reversed-phase (RP) HPLC (Bonfatti et al., Reference Bonfatti, Grigoletto, Cecchinato, Gallo and Carnier2008). All protein fractions were expressed proportionally to the total content of nitrogen (N) in milk. The phosphorylated form of the αs1-CN was also included in the analysis using the methodology of Bonfatti et al. (Reference Bonfatti, Cecchinato, Gallo, Blasco and Carnier2011). Moreover, the rest of N compounds in the milk were measured and calculated as the difference between the sum of the protein fractions and the total N milk content.
Milk coagulation and CF modeling
Milk coagulation parameters were obtained using the Formagraph tool (Foss Electric A/S) and the methodology previously described in Cecchinato and Bittante (Reference Cecchinato and Bittante2016). For each individual milk sample, files containing 360 CF values (one measure every 15 s for a 90 min time period) were retrieved. Those values were used to model the CF process at time t (CF t ), and to estimate a group of four parameters (Stocco et al., Reference Schopen, Heck, Bovenhuis, Visker, van Valenberg and van Arendonk2016). The potential asymptotical curd firmness (CFP, mm) of a given sample at infinite time and without taking into account the phenomenon of syneresis, the rennet coagulation time estimated through equation (RCTeq, min), the rate constant of curd-firming (kCF, %× min−1), which measures the relative increment of CF toward CFP, that is predominant until reaching the rate constant of syneresis, kSR (%×min−1). Moreover, two derived traits were the maximum curd firmness (CFmax, mm) and the time to CFmax (t max, min).
The RCTeq, kCF and kSR were calculated though curvilinear regression (PROC NLIN) in the SAS software (version 9.2; SAS Institute Inc., Cary, NC, USA).
Individual cheese yields and milk nutrient recoveries into the curd
Seven cheese phenotypes were included in our analysis. The model cheese-making procedure, based on 1.5 l of milk/cow, as was previously described in Cipolat-Gotet et al. (Reference Cipolat-Gotet, Cecchinato, De Marchi and Bittante2013).The traits recorded were: (i) 3%CY traits, representing the weight of fresh curd (%CYCURD), curd solids (%CYSOLIDS), and of the water retained in the curd (%CYWATER) as percentage of the weight of the milk processed; and (ii) four phenotypes expressing the recovery of the milk nutrients in the curd (RECSOLIDS, RECFAT and RECPROTEIN calculated as the % ratio between the nutrient in curd and in the processed milk). The recovery of the milk energy in the curd (RECENERGY) was also measured and calculated as the difference between energy in the milk and in the cheese (NRC, 2001).
Statistical analysis
Multivariate factor analysis
Primary to MFA, three phenotypes (CFmax, %CYCURD and RECSOLIDS) were excluded, to avoid severe multicollinearity problems. As previously described, CFmax is proportional to CFP. In addition, the sum of %CYWATER and %CYSOLIDS equals to %CYCURD. Moreover, phenotypic correlations of RECSOLIDS with RECENERGY and %CYSOLIDS were >0.9 (Bittante et al., Reference Bittante, Cipolat-Gotet and Cecchinato2013). Further, the Kaiser–Meyer–Olkin (KMO) measure was applied to quantify the difference between the Pearson and partial correlations of the 26 variables (Dziuban and Shirkey, Reference Dziuban and Shirkey1974; Kaiser and Rice, Reference Kaiser and Rice1974). The KMO is commonly used in MFA to assess the sampling adequacy of the data. It is a way to check if, indeed, a latent structure in the data exists, with a high value indicating a latent structure. The MFA model was as following:
 $${\bf{x}} {\mib{\,{\equals}\,\Lambda \xi {\plus}\delta }} $$
where x is the vector of measured variables, ξ the vector of the Fs, Λ contains the factor loadings (λ) that relate the Fs to the original variables and δ the residuals vector. To extract the Fs, three criteria were used: biological interpretation, proportion of original variance explained and prior knowledge. Factor rotation (varimax) was applied to identify simple structure. To describe the factors, factor loadings >|0.4| were considered. The MFA was carried out in R (R Core Team, 2013) using the psych package (Revelle, Reference Revelle2014).
Genetic analysis
Univariate and bivariate models were fitted to estimate variance components and heritability for each latent variable. The model assumed was:
 $${\bf{y}} \,{\equals}\,{\bf{Xb}} {\plus}{\rm Z}_{1} {\bf{h}} {\plus}{\rm Z}_{2} {\bf{a}} {\plus}{\bf{e}} $$
where y was the vector of phenotypic records (i.e. the factor scores) with dimension n; X, Z 1 and Z 2 were appropriate incidence matrices for the systematic effects (b), herd/date effects (h), and polygenic additive genetic effects (a), respectively; and e was the vector of residual effects. More specifically, b included the non-genetic effects of parity (one to four or more lactations) and days in milk (classed as 30-day subgroups).
All models were analyzed under a standard Bayesian approach The joint distribution of the parameters in a given model was proportional to:
 $$\eqalignno{ & p\left( {{\bf{b}} ,{\bf{h}} ,{\bf{a}} ,\sigma _{e}^{2} ,\sigma _{h}^{2} ,\left. {\sigma _{a}^{2} } \right|{\bf{y}} } \right)\proptop\left( {\left. {\bf{y}} \right|{\bf{b}} ,{\bf{h}} ,{\bf{a}} ,\sigma _{e}^{2} } \right)p\left( {\sigma _{e}^{2} } \right)p({\bf{b}} ){\times} \cr & p\left( {\left. {\bf{h}} \right|\sigma _{h}^{2} } \right)p\left( {\sigma _{h}^{2} } \right)p\left( {\left. {\bf{a}} \right|{\bf{A}} ,\sigma _{a}^{2} } \right)p\left( {\sigma _{a}^{2} } \right), $$
where A was the numerator relationship matrix between individuals and
 $\sigma _{e}^{2} ,$
 $\sigma _{h}^{2} $
,
 $\sigma _{a}^{2} $
were the residual, herd/date, and additive genetic variances, respectively. The a priori distributions of h and a were assumed to be multivariate normal, as follows:
 $$\eqalignno{ & p\left( {\left. {\bf{h}} \right|\sigma _{h}^{2} } \right)\,\sim\,N\left( {{\bf{0}} ,{\bf{I}} \sigma _{h}^{2} } \right) \cr & p\left( {\left. {\bf{a}} \right|\sigma _{a}^{2} } \right)\,\sim\,N\left( {{\bf{0}} ,{\bf{A}} \sigma _{a}^{2} } \right) $$
where I was an identity matrix with dimensions equal to the number of elements in h.
The priors for b and the variance components were assumed to be flat.
To estimate genetic correlations between the traits, we conducted a set of bivariate analyses that implemented model (2) in its multivariate version. In this case, the involved traits were assumed to jointly follow a multivariate normal distribution along with the additive genetic, herd and residual effects.
Marginal posterior distributions of all unknowns were estimated by applying the Gibbs sampling algorithm. The program TM (http://snp.toulouse.inra.fr/~alegarra) was used for all Gibbs sampling procedures. The lengths of the chain and the burn-in period were assessed by visual inspection of trace plots. After some preliminary analysis, chains of 850 000 samples were kept, with a burn-in period of 50 000. Subsequently, one in every 200 successive samples was retained. The posterior mean was used as the point estimate for all parameters.
Results
Factors
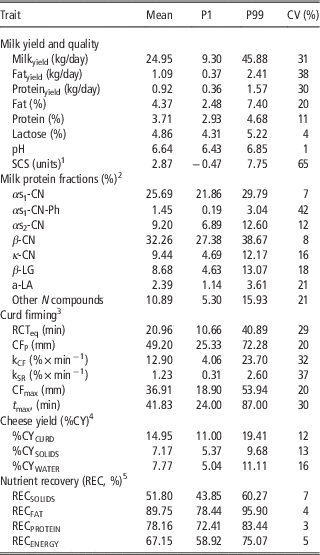
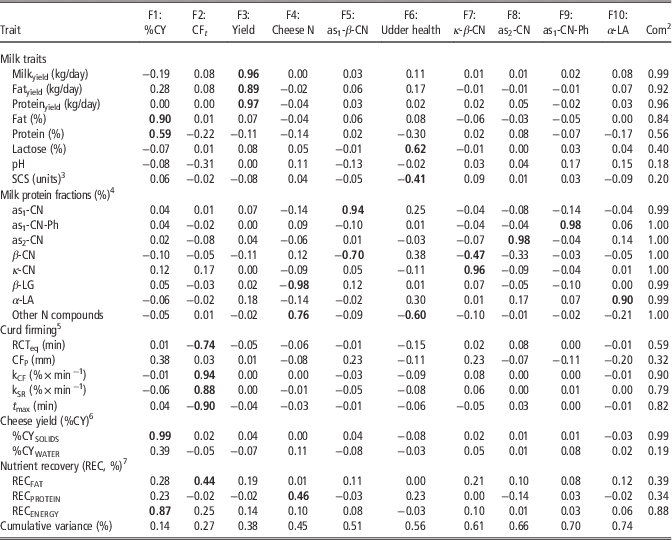
Table 1 presents the descriptive statistics of the 29 variables, while the Supplementary Figure S1 summarizes the phenotypic Pearson and partial correlations of the 26 variables analyzed. The mean KMO value was 0.55. In total, 10 Fs were kept for further analysis. These Fs retained 74% of the original variance (Table 2).
Descriptive statistics of milk (yield and quality), protein fractions, curd firming, cheese yield and curd nutrient recovery

P1=1st percentile; P99=99th percentile; CV=coefficient of variation.
1 SCS=log2 (SCC/100,000)+3.
2 Milk protein fractions: CN=casein; LA=lactalbumin and LG=lactoglobulin.
3 Curd firming: RCTeq=rennet coagulation time estimated through equation; CFP=asymptotical potential value of CF; kCF=curd-firming instant rate constant; kSR=syneresis instant rate constant; CFmax=maximum curd firmness achieved within 90 min; and t max=time at achievement of CFmax.
4 Cheese yield=ratios of the weight (g) of the fresh curd (%CYCURD), curd dry matter (%CYSOLIDS) and curd water (%CYWATER) v. the weight of the processed milk (g).
5 Nutrient recovery=ratio of the weight (g) of the curd constituent (dry matter, fat, protein or energy, respectively) v. that of the same constituent in the processed milk (g).
Rotated factor (F) pattern, communality (Com) of variables and variance explained by the factorsFootnote 1

1 Factors have been sorted based on proportion of variance explained. Values above |0.4| in bold.
2 Communality=the sum of the squared factor loadings per trait; F1: %CY=factor related to the percentage of individual cheese yield; F2: CF t =factor related to the curd firmness; F3: Yield=factor related to the milk yield; F4: Cheese N=factor related to the milk nitrogen that is present into the cheese curd; F5: as1-β-CN=factor related to the as1- and β-CN contents in milk, expressed as relative contents to the total milk nitrogen; F6: Udder health=factor related to the udder health of a cow; F7: κ-β-CN=factor related to the κ- and β-CN contents in milk, expressed as relative contents to the total milk nitrogen; F8: as2-CN=factor related to the milk as2-CN, expressed as relative content to the total milk nitrogen; F9: as1-CN-Ph=factor related to the milk as1-CN-Ph expressed as content to the total milk nitrogen; F10: α-LA=factor related to the milk α-LA.
3 SCS=log2 (SCC/100 000)+3.
4 Milk protein fractions: CN=casein; LA=lactalbumin; LG=lactoglobulin.
5 Curd firming: RCTeq=rennet coagulation time estimated through equation; CFP=asymptotical potential value of CF; kCF=curd-firming instant rate constant; kSR=syneresis instant rate constant; t max=time at achievement of CFmax.
6 Cheese yield=ratios of the weight (g) of the curd dry matter (%CYSOLIDS) and curd water (%CYWATER) v. the weight of the processed milk (g).
7 Nutrient recovery=ratio of the weight (g) of the curd constituent (fat, protein or energy, respectively) v. that of the same constituent in the processed milk (g).
The first two Fs captured the concepts of CY (F1: %CY) and CF (F2: CF t ). More precisely, F1: %CY was heavily and positively loaded on %CYSOLIDS, fat and protein (%) and RECENERGY. F2: CF t was related with all CF t measures (except CFP) and the RECFAT. Because F2: CF t was positively associated with the kCF, kSR and RECFAT while negatively with the time traits (RCTeq and t max), a favorable CF t meaning was given. The third factor was a descriptor of the milk production (F3: Yield) since it was associated with the daily yields (milk, fat and protein). The fourth factor was considered as a cheese N descriptor (F4: Cheese N). It was strongly and negatively associated with β-LG and positively with other N compounds and the RECPROTEIN. The fifth factor was descriptor of as1- and β-CN (F5: as1-β-CN), being primarily loaded to as1-CN (positively) and, following, to the β-CN (negatively). A factor representing the udder health status of the cow was also obtained (F6: Udder health), with a positive relation to lactose and negative to SCS and other N compounds. The seventh factor was named as F7: κ-β-CN, due to a heavy load (positive) on κ-CN and a weaker and negative relation to β-CN. An increase of this factor implied an increase of κ-CN. Each of the last three Fs was associated with one protein (as2-CN, as1-CN-P and α-LA, respectively) and was named accordingly as F8: as2-CN, F9: as1-CN-Ph and F10: α-LA.
Genetic parameters
Mean of marginal posterior densities of additive genetic, herd/test-date, and residual variances, across-herd
 $\left( {h_{{AH }}^{2} } \right)$
and intra-herd
 $\left( {h_{{IH}}^{2} } \right)$
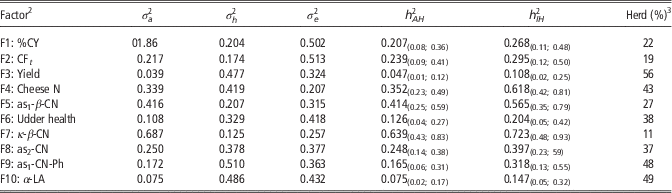
heritabilities and herd contribution for the investigated traits of the 10 Fs are summarized in Table 3. Highest heritability estimate was observed for F7: κ-β-CN (
 $h_{{AH}}^{2} $
=0.64 and
 $h_{{IH}}^{2} $
=0.72), F4: Cheese N (
 $h_{{AH}}^{2} $
=0.35 and
 $h_{{IH}}^{2} $
=0.62) and F5: as1-β-CN (
 $h_{{AH}}^{2} $
=0.41 and
 $h_{{IH}}^{2} $
=0.57). The lowest values were found for F10: α-LA (
 $h_{{AH}}^{2} $
=0.08 and
 $h_{{IH}}^{2} $
=0.15) and F3: Yield (
 $h_{{AH}}^{2} $
=0.05 and
 $h_{{IH}}^{2} $
=0.11). The rest of the Fs had moderate values, ranging, for
 $h_{{AH}}^{2} $
, between 0.13 and 0.25 and from 0.20 to 0.40 for
 $h_{{IH}}^{2} $
. Moreover, the amount of variance attributable to herds within dairy system was large among Fs: the less affected were F7: κ-β-CN, F2: CF
t
and F1: %CY, and the more affected were F3: Yield, F10: α-LA, and F9: as1-CN-Ph.
Mean of marginal posterior densities of additive genetic
 $\left( {\sigma _{a}^{2} } \right)$
, herd/test-date
 $\left( {\sigma _{h}^{2} } \right)$
, and residual
 $\left( {\sigma _{e}^{2} } \right)$
, variances, across-herd
 $\left( {h_{{AH}}^{2} } \right)$
, and intra-herd
 $\left( {h_{{IH}}^{2} } \right)$
heritabilities and herd contribution for the 10 factors (F)Footnote
1

1 Mean of the marginal posterior density of the parameters. Bounds of the 95% high posterior density interval are within parentheses.
2 F1: %CY=factor related to the percentage of individual cheese yield; F2: CF t =factor related to the curd firmness; F3: Yield=factor related to the milk yield; F4: Cheese N=factor related to the milk nitrogen that is present into the cheese curd; F5: as1-β-CN=factor related to the as1- and β-CN contents in milk, expressed as relative contents to the total milk nitrogen; F6: Udder health=factor related to the udder health of a cow; F7: κ-β-CN=factor related to the κ- and β-CN contents in milk, expressed as relative contents to the total milk nitrogen; F8: as2-CN=factor related to the milk as2-CN, expressed as relative content to the total milk nitrogen; F9: as1-CN-Ph=factor related to the milk as1-CN-Ph expressed as content to the total milk nitrogen; F10: α-LA=factor related to the milk α-LA.
3
The variance of herd/date within dairy system and season is expressed as ratio with the total phenotypic variance
 $\left( {\sigma _{a}^{2} {\plus}\sigma _{h}^{2} {\plus}\sigma _{e}^{2} } \right)$
.
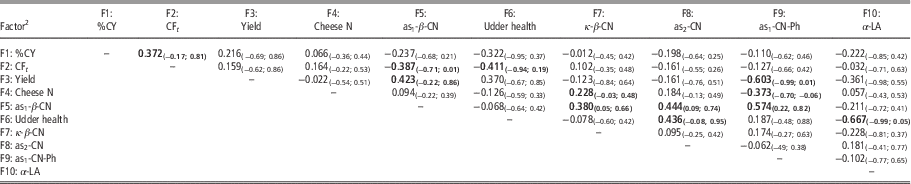
Additive genetic correlations among the 10 Fs are given in Table 4. Estimates were characterized by a large variability: of the 45 correlations evaluated only 12 were relevant (within a Bayesian framework) presenting a posterior probability accumulated above 0 for positive estimates or below 0 for negative estimates (in bold in Table 4) ⩾90%.
Additive genetic correlations for the 10 factors (F)Footnote 1

1 Mean of the marginal posterior density of the additive genetic correlation. Bounds of the 95% high posterior density interval are within parentheses. Boldface indicates additive genetic correlations with ⩾90% of posterior probability accumulated above 0 (positive estimates) or below 0 (negative estimates).
2 F1: %CY=factor related to the percentage of individual cheese yield; F2: CF t =factor related to the curd firmness; F3: Yield=factor related to the milk yield; F4: Cheese N=factor related to the milk nitrogen that is present into the cheese curd; F5: as1-β-CN=factor related to the as1- and β-CN contents in milk, expressed as relative contents to the total milk nitrogen; F6: Udder health=factor related to the udder health of a cow; F7: κ-β-CN=factor related to the κ- and β-CN contents in milk, expressed as relative contents to the total milk nitrogen; F8: as2-CN=factor related to the milk as2-CN, expressed as relative content to the total milk nitrogen; F9: as1-CN-Ph=factor related to the milk as1-CN-Ph expressed as content to the total milk nitrogen; F10: α-LA=factor related to the milk α-LA. Factors have been orthogonally extracted, hence all their pairwise phenotypic correlations are equal to zero.
In particular, F1: %CY was positively correlated only with F2: CF t , among the factors related to milk protein fractions, F5: as1-β-CN was positively correlated with all the other casein factors (F7: κ-β-CN, F8: as2-CN, and particularly with its phosphorilated form F9: as1-CN-Ph) but not with whey proteins factors (F4: Cheese N and F10: α-LA). Interestingly, the F9: as1-CN-Ph was negatively correlated with both F3: Yield and F4: Cheese N. The highest negative correlation was observed between F6: Udder health with F10: α-LA, compensated by the positive correlation with F8: as2-CN. F6: Udder health was negatively correlated also with F2: CF t . Lastly, it worth noting that F5: as1-β-CN was positively related with F3: Yield and negatively with F2: CF t .
Discussion
Factor interpretation
In all, 10 mutual orthogonal Fs replaced 26 phenotypes related to milk production and quality, the cheese-making process and the udder health status of a cow, while retaining a considerable amount of the original variability (74%). The mean KMO value although not high (0.55) is comparable with previous studies (Manca et al., Reference Manca, Serdino, Gaspa, Urgeghe, Ibba, Contu, Fresi and Macciotta2016) using similar phenotypes in dairy sheep.
The general meaning of the 10 Fs is similar to previous studies that used the same approach (MFA with a varimax rotation) and similar phenotypic data, either in dairy cattle (Ostersen et al., Reference Ostersen, Foldager and Hermansen1997; Macciotta et al., Reference Macciotta, Cecchinato, Mele and Bittante2012) or in small ruminants (Todaro et al., Reference Todaro, Scatassa and Giaccone2005; Manca et al., Reference Manca, Serdino, Gaspa, Urgeghe, Ibba, Contu, Fresi and Macciotta2016; Vacca et al., Reference Vacca, Paschino, Dettori, Bergamaschi, Cipolat-Gotet, Bittante and Pazzola2016). In general, all the studies obtained Fs that clearly distinguished the concepts of milk quality, milk production, coagulation properties and health characteristics. Respect to the available literature studies, herein we considered, for the first time, the milk protein profile along with different milk technological traits. More specifically, for which only five standard milk quality traits were in common with the study of Macciotta et al. (Reference Macciotta, Cecchinato, Mele and Bittante2012) (i.e. fat%, protein%, lactose%, pH and somatic cell count, while a set of 26 relative new phenotypes were considered: three production traits (i.e. milk, fat and protein yield), eight milk protein fractions, five traits related to curd-firming modeling, two cheese yields and three nutrients recovery traits.
Genetic parameters
Variance components and heritability of the factors
In the absence of published studies, our results on the genetic analysis of the Fs were mainly compared with genetic parameters of the measured single traits in previous studies. The high heritability estimates of F7: κ-β-CN found in our study were in accordance with h
2 values of κ-CN (
 $h_{{AH}}^{2} $
=0.63) and β-CN (
 $h_{{AH}}^{2} $
=0.69) reported for dual purpose Simmental cows (Bonfatti et al., Reference Bonfatti, Cecchinato, Gallo, Blasco and Carnier2011). Moreover, for the three Fs that were loading to only one trait (i.e. F8: as2-CN, F9: as1-CN-Ph and F10: α-LA) heritability estimates were in range with those documented in the literature of the single traits:
 $h_{{AH}}^{2} $
=0.11 for α-LA content and
 $h_{{AH}}^{2} $
=0.22 for as2-CN (Bonfatti et al., Reference Bonfatti, Cecchinato, Gallo, Blasco and Carnier2011) and
 $h_{{IH}}^{2} $
of 0.13 to 0.15 for as1-CN-Ph (with eight phosphorylated serine residues) in Danish Holstein (Gebreyesus et al., Reference Gebreyesus, Lund, Janss, Poulsen, Larsen, Bovenhuis and Buitenhuis2016). The low heritability for milk yield (~0.09) that has been previously reported in Brown Swiss cattle (Macciotta et al., Reference Macciotta, Cecchinato, Mele and Bittante2012; Bittante et al., Reference Bittante, Cipolat-Gotet and Cecchinato2013) can explain the low heritability found in our study for F3: Yield, a factor that was dominated by daily milk and protein yields. Factor F1: %CY, that was heavily loaded to %CYSOLIDS, had similar heritability with the single trait %CYSOLIDS (
 $h_{{AH}}^{2} $
=0.21 and
 $h_{{IH}}^{2} $
=0.26) as reported in Bittante et al. (Reference Bittante, Cipolat-Gotet and Cecchinato2013). The F6: Udder health had an across-herd h
2 of 0.13, a similar heritability (0.14) reported in Macciotta et al. (Reference Macciotta, Cecchinato, Mele and Bittante2012) in Brown Swiss cattle for a factor entitled ‘udder health’ (loading on somatic cell count and lactose). In the same study, another factor representing the MCP, but including the traditional MCP traits (RCT, k20 and a30) instead of the CF
t
values, had a heritability estimate of 0.23. This value is in agreement with a heritability estimate (
 $h_{{AH}}^{2} $
=0.24) that was found for F2: CF
t
in our study. Concerning the F4: Cheese N (
 $h_{{AH}}^{2} $
=0.35 and
 $h_{{IH}}^{2} $
=0.62), comparable values of heritability can been found in the literature for β-LG (Bonfatti et al., Reference Bonfatti, Cecchinato, Gallo, Blasco and Carnier2011). Moreover, F4: Cheese N was also loaded to RECPROTEIN. In the literature, heritability estimates of 0.35 (across-herd) and 0.49 (intra-herd) have been reported for the RECPROTEIN (Bittante et al., Reference Bittante, Cipolat-Gotet and Cecchinato2013).
Additive genetic correlation among factors
Although the Fs were extracted in an orthogonal way, meaning that they were phenotypically uncorrelated, multivariate genetic analysis depicted considerable additive genetic correlations. The highest genetic correlations >|0.6| were observed between F10: α-LA and F6: Udder health and F9: as1-CN-Ph and F3: Yield. The known inverse (medium to strong) genetic relationship between milk yield and the casein percentage explains the highly negative genetic correlation between F9: as1-CN-Ph and F3: Yield. Moreover, F9: as1-CN-Ph was positively correlated with F5: as1-β CN as expected, since F5: as1-β CN was mainly loaded on as1-CN and the as1-CN-Ph is a posttranslational form of the as1-CN. In addition, this estimate is comparable to the genetic correlation (~0.80) between as1-CN and as1-CN-Ph (with eight phosphorylated serine residues) reported in Gebreyesus et al. (Reference Gebreyesus, Lund, Janss, Poulsen, Larsen, Bovenhuis and Buitenhuis2016). Moreover, F5: as1-β-CN was positively related to F7: κ-β-CN. Both Fs contained β-CN as a minor loading. Bonfatti et al. (Reference Bonfatti, Cecchinato, Gallo, Blasco and Carnier2011) reported genetic correlation of 0.12 between as1- and κ-CN in Simmental cattle, with a posterior probability (%) for positive correlations greater than 0 of 56. Hence, our value of 0.38 might be comparable with this one. The positive-weak genetic correlation between F5: as1-β-CN (primary loaded on as1-CN) and F8: as2-CN is also in line with Bonfatti et al. (Reference Bonfatti, Cecchinato, Gallo, Blasco and Carnier2011) that reported genetic correlations between as1- and as2-CN of 0.22. A negative-medium genetic correlation was found between F5: as1-β-CN and F2: CF t . Jõudu et al. (Reference Jõudu, Henno, Kaart, Püssa and Kärt2008) reported a negative phenotypic relationship between the relative content of as1- and β-CN with a firmer curd.
The F6: Udder health was negatively correlated with F10: α-LA and F2: CF t while positively related to F8: as2-CN. A negative correlation between α-LA and somatic cell count has been reported by Caffin et al. (Reference Caffin, Poutrel and Rainard1985), while a good cow health status results in an increase of caseins. The negative genetic correlation with the F2: CF t could be partly explained by the recent findings of Bobbo et al. (Reference Bobbo, Cipolat-Gotet, Bittante and Cecchinato2016). More precisely, it was reported that the relationships between SCS and milk technological traits are not linear and a negative effect of very low SCS to some milk technological traits was pointed out. Moreover, a slower coagulation with both very low and high values of SCS was found. Interestingly, F2: CF t was heavily loaded to the rate of curd firmness.
The F4: Cheese N was genetically correlated with F9: as1-CN-Ph (negatively) and F7: κ-β-CN (positively). A competitive synthesis between as1-CN and β-CN has been previously reported (Bobe et al., Reference Bobe, Beitz, Freeman and Lindberg1999), while the favorable effect of β- and κ-CN on cheese yield is widely known (Walstra et al., Reference Walstra, Wouters and Geurts2006). This also explains the reason that although the F3: Yield is negatively correlated to F9: as1-CN-Ph it had a positive correlation to F5: as1-β-CN. Finally, the positive correlation between F1: %CY and F2: CF t implies that selection on better CF t characteristics will lead to an increase in the percentage of cheese yield. Some additive genetic correlations between MCP , CF t and %CY were reported in Cecchinato and Bittante (Reference Cecchinato and Bittante2016). However the limit of that study was the lack of consideration of the protein composition as active contributors to the cheese-making process (especially κ-CN and β-CN fractions) as it heavily affects the coagulation process and, in turns, the %CY. Indeed, to our knowledge, this is the first analysis in which the protein fractions have been analyzed in combination with milk technological traits and, in particular, with different measures of cheese yield and curd nutrient recovery.
Conclusions
Using multivariate factor analysis, 10 latent factors replaced 26 phenotypes of bovine milk yield and quality, protein composition, coagulation and curd firmness properties, cheese-related traits and indicators of the mammary gland health status. The factors distinguished the underlined concepts that each group of phenotypes was representing. In general, results from the genetic analysis were in agreement to the given name of the factor and reflected the underlying structure that each factor was representing. Moreover, heritability and genetic correlation estimates of the Fs were in favor of the use of Fs for breeding purposes.
For a successful application in breeding programs, the use and potential benefit of factors in terms of response to selection and economic value should be further investigated. Moreover, being in the genomic era, we propose for future research to test the behavior of latent variables in genome-wide association, and its complement pathway-based analysis, or prediction studies.
Acknowledgments
The authors thank the Autonomous Province of Trento for funding the project; the Italian Brown Swiss Cattle Breeders Association (ANARB, Verona, Italy) for supplying pedigree information; the Superbrown Consortium of Bolzano and Trento (Trento, Italy) for supporting our sampling and recording activities. The authors also wish to acknowledge Valentina Bonfatti for her cooperation in assessing the milk protein fractions. C. Dadousis benefitted from financial support of the CARIPARO (Cassa di Risparmio di Padova e Rovigo) Foundation (Padua, Italy).
Supplementary material
To view supplementary material for this article, please visit https:/doi.org/10.1017/S1751731117001616