INTRODUCTION
Grassland farming and particularly intensive dairy farming has low nitrogen (N) use efficiencies (van Grinsven et al. Reference van Grinsven, ten Berge, Dalgaard, Fraters, Durand, Hart, Hofman, Jacobsen, Lalor, Lesschen, Osterburg, Richards, Techen, Vertès, Webb and Willems2012) and, especially on sandy soils under temperate conditions, this may lead to adverse environmental impacts. In cut grassland systems, N efficiency is usually high with low nitrate (NO3 −) leaching (Eriksen et al. Reference Eriksen, Askegaard, Rasmussen and Søegaard2015), whereas livestock grazing increases the loss potential dramatically (Humphreys et al. Reference Humphreys, O'Connell and Casey2008a , Reference Humphreys, Casey, Darmody, O'Connell, Fenton and Watson b ; Eriksen et al. Reference Eriksen, Askegaard, Rasmussen and Søegaard2015).
Dairy production systems in Northern Europe are to a large extent based on ley-arable rotations (Vertès et al. Reference Vertès, Hatch, Velthof, Taube, Laurent, Loiseau and Recous2007), with both the leys and the arable phase typically lasting 2–4 years. The managed grasslands are dominated by grass-clover and typical management involves removal of herbage through grazing or cutting and application of organic fertilizer through injection of cattle slurry (Eriksen et al. Reference Eriksen, Vinther and Søegaard2004a ).
The ley phase is characterized by being less disturbed by mechanical operations. The soil structure is also dynamic between tillage operations: a reorganization of the structure (settlement) occurs due to cyclic changes of capillary forces between soil particles and between soil aggregates (Or & Ghezzehei Reference Or and Ghezzehei2002), and due to increased activity of earthworms, which may influence soil macroporosity and macropore flow. However, grazing, with associated cattle trampling and soil compaction, may also affect both macroporosity (Tuohy et al. Reference Tuohy, Fenton, Holden and Humphreys2015) and earthworm activity (Lamandé et al. Reference Lamandé, Hallaire, Curmi, Pérès and Cluzeau2003).
Initially in the ley phase of a rotation with a cutting regime, macroporosity will decrease due to the natural reorganization of soil structure following tillage before the establishment of the grain crop (settlement) (Kooistra & Tovey Reference Kooistra, Tovey, Soane and van Ouwerkerk1994; Lamandé et al. Reference Lamandé, Hallaire, Curmi, Pérès and Cluzeau2003) and will then increase with the development of roots and of the endogeic (geophageous, living in soil) and anecic (feeding at the soil surface, deep burrowing) earthworm populations (Drees et al. Reference Drees, Karathanasis, Wilding and Blevins1994). Near-saturated flows are then expected to increase with the duration of the leys, similar to the increase of preferential flow paths in an arable soil without tillage (Petersen et al. Reference Petersen, Hansen and Jensen1997). Colonization of a field and recovery of earthworm populations takes several years after the pressure of soil tillage has been removed, biomass exported and pesticides applied. Pizl (Reference Pizl1992) showed that earthworm abundance in an abandoned agricultural field (previously cultivated for maize production) increased significantly during the first 4 years to reach the same abundance as in a 10-year meadow on the same soil type. Fertilizer source, mineral or organic, quality, quantity and application practices influence the development and activity of soil organisms. Organic amendments, such as cattle slurry or cow dung pat deposits, especially enhance the activity of deep-burrowing earthworm species (Curry Reference Curry and Edwards2004).
The initiation of macropore flow depends to a large degree on the near-saturated hydraulic conductivity of the soil matrix and rainfall intensity. Water will only flow from the soil matrix out into the non-capillary macropores if the hydraulic conductivity of the soil matrix is exceeded (Larsbo & Jarvis Reference Larsbo and Jarvis2003), even in unsaturated conditions (Nimmo Reference Nimmo2012). Without the water repellence of a dry soil or a dynamic soil structure as a function of water content, wetter soils will generate more macropore flow (Jarvis Reference Jarvis2007; Kramers et al. Reference Kramers, Richards and Holden2009). These conditions mostly occur in the period from autumn to spring in northern Europe.
Macropore flow can cause the rainwater to bypass large parts of the bulk soil where NO3 − concentrations can be large, therefore curbing NO3 − leaching. According to Larsson & Jarvis (Reference Larsson and Jarvis1999), macropore flow can reduce N leaching down to 1·75 m by up to 28%: they found that leaching risk was enhanced by macropore flow shortly after fertilizer application only in the 1st year, but even then, fertilizer-derived N only accounted for 7% of annual leaching. Ruminant grazing results in an uneven distribution of urine and dung (Eriksen & Høgh-Jensen Reference Eriksen and Høgh-Jensen1998) with N deposition in urine amounting to as much as 800 kg N/ha (Haynes & Williams Reference Haynes and Williams1993), so the flux of N may be highly influenced by macropore flow. When the infiltrating water contains a large concentration of solutes (for example from urine patches), the bypass of the active soil matrix will limit the possibility of the dissolved chemicals being adsorbed and degraded during their movement towards groundwater or the land drainage system. Grazing cattle in autumn presents a particularly high risk of NO3 − leaching from urine patches (Cuttle & Bourne Reference Cuttle and Bourne1993; Silva et al. Reference Silva, Cameron, Di and Hendry1999), even although the risk can be reduced by using nitrification inhibitors (Di & Cameron Reference Di and Cameron2016).
Depending on the stocking rate and the zones related to the feeding pattern in the field, cattle trampling might influence the physical and functional properties of the topsoil. With an increase in trampling intensity, bulk density increases (Warren et al. Reference Warren, Nevill, Blackburn and Garza1986; Mapfumo et al. Reference Mapfumo, Chanasyk, Naeth and Baron1999; Phelan et al. Reference Phelan, Keogh, Casey, Necpalova and Humphreys2013; Tuohy et al. Reference Tuohy, Fenton, Holden and Humphreys2015), penetration resistance increases (da Silva et al. Reference da Silva, Imhoff and Corsi2003; Kurz et al. Reference Kurz, O'Reilly and Tunney2006; Herbin et al. Reference Herbin, Hennessy, Richards, Piwowarczyk, Murphy and Holden2011), cohesion and friction decrease (Pietola et al. Reference Pietola, Horn and Yli-Halla2005), and there are decreases in infiltration rate (Mulholland & Fullen Reference Mulholland and Fullen1991) and saturated (Rodd et al. Reference Rodd, Papadoloulos, Laflamne, McRae, Fillmore and Wilson1999) or unsaturated (Lamandé et al. Reference Lamandé, Hallaire, Curmi, Pérès and Cluzeau2003) hydraulic conductivity. Anecic earthworms are less sensitive to cattle trampling than epigeic (living at the soil surface) and endogeic species (geophageous, living and feeding in the topsoil) (Piearce Reference Piearce1984; Cluzeau et al. Reference Cluzeau, Binet, Vertès, Simon, Rivière and Tréhen1992). Therefore, in a rotation with intensive grazing, near-saturated flows through tortuous macropores will decrease, while large continuous macropores created and maintained by anecic earthworms and roots will remain able to conduct rapid flows of water through the soil profile. Similarly, soil compaction due to traffic with agricultural machinery reduces hydraulic conductivity in the soil matrix, which can result in an increase in macropore flow (Kulli et al. Reference Kulli, Gysi and Flühler2003).
Irrigation experiments using a non-reactive tracer (tracer experiments) such as bromide (Br−) provide a means of describing flow regimes in structured soils at the profile scale (Caron et al. Reference Caron, Banton, Angers and Villeneuve1996; Yang & Wendroth Reference Yang and Wendroth2014). Due to the anionic character of NO3 −, its movement in soils is often compared with other anions, such as Br− (Smith & Davis Reference Smith and Davis1974; Silvertooth et al. Reference Silvertooth, Watson, Malcuit and Doerge1992; Patra & Rego Reference Patra and Rego1996), even if Br− is leached faster than NO3 − (Clay et al. Reference Clay, Zheng, Liu, Clay and Trooien2004). Bromide, as NO3 −, is conservative, but has the advantage of neither degrading nor volatilizing over time and thus is not lost from the soil profile other than through deep leaching and plant uptake. In addition, Br− background levels in soils are generally small (Maw & Kempton Reference Maw and Kempton1982; Flury & Papritz Reference Flury and Papritz1993).
Duration of the ley, cattle trampling and fertilizer practice will influence directly or indirectly the soil micro- and macro-structure through earthworm activity, which will have consequences for the triggering of preferential flow. Hence, the current study set out to test three hypotheses. H1: Water flow will be faster after 3 years with a grazing regime than with a cutting regime. H2: Water flow through the soil matrix will increase with the duration of the leys with a cutting regime. H3: Water flow through the soil matrix will increase further with duration of leys with a cutting regime and without cattle slurry application.
MATERIAL AND METHODS
Field site
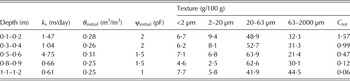
The experimental plots were located within a crop rotation study for the dairy operation at the Foulum site of Aarhus University (9°34′E, 56°29′N). Mean annual rainfall was 770 mm, with a mean annual temperature of 7·7 °C. Since 1987, the site has been under intensive dairy farming with grass-arable crop rotations (Eriksen et al. Reference Eriksen, Askegaard and Kristensen1999, Reference Eriksen, Askegaard and Kristensen2004b ). The soil is classified as a Typic Hapludult and as a loamy sand using the United States Department of Agriculture (USDA) texture triangle (Soil Survey Division Staff 1993), and was naturally well drained to at least 1·5 m depth (Table 1). The composition of the topsoil was homogeneous for all plots. However, according to the characterization of the field on a 40 × 40 m2 grid by Heidmann (Reference Heidmann1989), organic matter content was 10–70 g/kg down to a depth of 0·30–0·55 m in the experimental plots. The soil was mouldboard ploughed to a depth of approximately 22 cm before establishment of a crop.
Physico-chemical characteristics of the investigated soil

Textural composition and soil water characteristics to convert the initial volumetric water content to matric potential from Heidmann (Reference Heidmann1989). The saturated hydraulic conductivity was reported for this soil by Jacobsen (Reference Jacobsen1989).
Management regimes
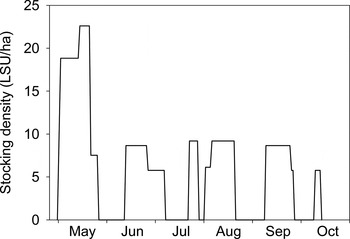
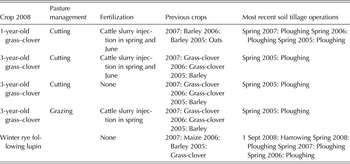
Five management regimes were followed to investigate the effects of three factors of variation (the duration of the leys, fertilizer practice and trampling by cattle): (1) 1st-year cut grass-clover with application of cattle slurry in spring every year by injection to a depth of approximately 8 cm at a rate of 100 kg total-N/ha, (2) 3rd-year cut grass-clover with cattle slurry applied as described above, (3) 3rd-year cut grass-clover with no fertilization, (4) 3rd-year grazed sward (8 heifers/ha from May to October; 1250 grazing days/ha/year) with application of cattle slurry as described above and (5) winter rye catch crop following a lupin main crop, both unfertilized and without grazing. There were two replicates for each management, which gave ten experimental plots. The cropping history of all experimental plots is presented in Table 2. The stocking density of grazing heifers during 2008 in the grazed plots of the investigation is presented in Fig. 1. All field work took place in October 2008. Volumetric water content and matric potential at the start of the experiment are presented in Table 1. The earthworm populations at four sub-plots around the area of the tracer experiment were characterized before the experiment was performed. Approximately 24 h later, a trench next to the irrigated area was dug; from this, macropores were recorded visually and soil samples taken to determine bulk density and Br− concentration depth by depth, starting from the soil surface.
Stocking density of grazing heifers during 2008 in the grazed plots of the experiment.

Cropping history for the five management regimes investigated in the present study

Characterization of earthworm populations
Earthworms were sampled by hand-sorting of soil samples from a 0·25 × 0·25 m2 area to a depth of 0·3 m. Four such soil samples from opposite sides of the irrigated area (labelled as sub-plots) used for analysis of soil properties were dug out using a spade and hand-sorted on site. Collected worms were kept on moist filter paper in Petri dishes for one day to allow for emptying of the gut. Each individual was gently surface-dried with filter paper and the fresh mass determined to the nearest mg. The species encountered in soil samples from the current experiment were identified using the key of Sims & Gerard (Reference Sims and Gerard1985) and classified according to Bouché (Reference Bouché, Lohm and Persson1977). The identity of the cryptic species Lumbricus herculeus (Savigny 1826) was ascertained by genetic barcoding of the mitochondrial cytochrome oxidase I (COI) of Lumbricus sp. individuals collected from the study location in 2015, cf. James et al. (Reference James, Porco, Decaëns, Richard, Rougerie and Erséus2010) and Martinsson & Erséus (Reference Martinsson and Erséus2017). GENBANK accession numbers include KX760118 and KX760119. The identity of Aporrectodea caliginosa (Savigny 1826) was likewise confirmed by COI barcoding.
Tracer experiment
A Br− recharge experiment was performed once, at the same time for each experimental plot. A concentrated solution of KBr (potassium bromide) of 1 g/l was applied to two 4-m2 areas (2 × 2 m2) in each of the plots at an intensity of 18·5 mm/h by a rainfall simulator for 1 h under a shelter to avoid the influence of rain and wind. The rainfall simulator consisted of spray nozzles mounted on an overhead carriage, which traversed automatically at constant speed backwards and forwards across the plot. After 24 h, a 1-m2 area was excavated to take seven soil samples at five depths: 0·10–0·17, 0·30–0·37, 0·40–0·47, 0·70–0·77 and 1·00–1·07 m using cubic shovels (0·07 × 0·078 × 0·115 m3). For each depth-interval, Br− was extracted by pyrophosphate solution from the soil after combining the seven samples in a bucket (Jacobsen & Iversen Reference Jacobsen, Iversen and Ernstsen2004). The Br− concentration was determined using ion chromatography (Metrohm AG® 819 Advanced IC Detector, Herisau, Switzerland). The centre of mass (COM) was calculated according to Schwen et al. (Reference Schwen, Yang, Walton and Wendroth2012) to derive a numerical value for the Br− leaching depth for each plot:
 $${\rm COM} = \displaystyle{1 \over M}\mathop \sum \limits_{i = 1}^5 m_i \times r_i $$
where M is the total Br− mass recovered on a single plot, m i is the Br− mass recovered in the seven samples taken at one depth i of a single plot, and r i is the depth of the centre of the seven samples.
Bulk density and water content 24 h after irrigation
Dry bulk density and gravimetric water content 24 h after irrigation were derived from ten randomly collected soil cores (100 cm3) sampled in two areas of each plot (i.e., five soil cores per area) at the same five depths as the samples used for Br− extraction (0·1, 0·3, 0·4, 70 and 1·0 cm). The soil cores were dried at 105 °C for 72 h.
Macropores
The density of macropores was registered at five depths in two areas of each plot (the same areas as for the soil cores used for bulk density measurements) using the method developed by Lamandé et al. (Reference Lamandé, Labouriau, Holmstrup, Torp, Greve, Heckrath, Iversen, de Jonge, Moldrup and Jacobsen2011). A horizontal layer of soil was scraped off to the chosen depth and loose soil particles removed using a vacuum cleaner. Macropores >1 mm in equivalent diameter were marked with a waterproof red marker on a transparent PC (polycarbonate) sheet (0·7 × 1·0 m2) placed on the surface of the horizontal layer. The sheets were brought to the laboratory, cleared of soil particles in the lab and digitized on a white background illuminated by artificial light using a digital reflex camera. The smallest recorded pores (equivalent diameter of 1 mm) were represented by 12 pixels (289 µm/pixel). Images were acquired in RGB (red-green-blue) format, converted to grey-level format and subsequently segmented using an automatic thresholding method. The freeware ImageJ® (Schneider et al. Reference Schneider, Rasband and Eliceiri2012) was used for image processing and analysis. Finally, the number of macropores from the final binary image was registered and converted to a density of macropore (number of macropores per unit area).
Statistics
Management effects on bulk density were analysed for each depth separately by a mixed model assuming a normal distribution. Management was taken as fixed effect, while the effect of sampling spot within plots was regarded as random.
Management effects on the density of macropores were analysed by a mixed model assuming a γ distribution. Management, sampling depth and thickness of the organo-mineral horizon were taken as fixed effects, while the effect of sampling spot within plots was regarded as random.
Management effects on the Br− concentration were analysed by a mixed model assuming a normal distribution. Management and sampling depth were taken as fixed effects.
A repeated measurement analysis with areas as subjects optimized the analyses of the management effect on the density of macropores and the Br− concentration, including an autoregressive, AR(1), covariance structure to account for correlation between samples from the same area at different depths.
Management effects on the Br− COM were analysed using a one-way ANOVA (analysis of variance), assuming a normal distribution of the data.
The statistical power at P = 0·05 given the variance of the measured parameters and the differences between managements was 67, 54 and 35% for the density of macropores, the Br− concentration and the bulk density, respectively. For the three variables, the power to detect an actual effect of management was low.
The design structure for the earthworm samples were a completely randomized design with four sampling spots (repeated measurement) within each plot and two plots per treatment. Statistical analysis was performed on
 $\sqrt {x + 1} $
transformed data and means comparison with Tukey's test.
The SAS 9·1 package (SAS Institute Inc., 2004) was used for these calculations.
RESULTS
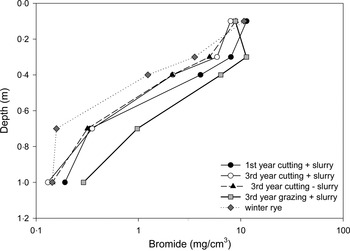
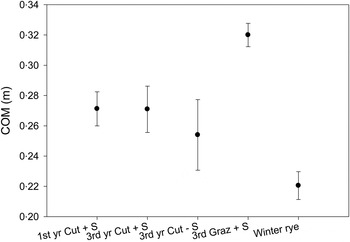
A low amount of Br− at a given depth indicated that the amount of infiltrated water being stored at this particular depth was small at the time of soil sampling (24 h after irrigation with 18·6 mm water) (Fig. 2). All the irrigation water infiltrated after 24 h. No runoff was observed during irrigation, but ponding at the soil surface during irrigation indicated that the irrigation intensity was exceeding the soil's infiltration capacity for all plots. There were no significant differences between management regimes in the amount of Br− measured at 1·0 m depth, which was probably related to the rather short time of sampling after irrigation with regard to the values of saturated hydraulic conductivity for this soil and the initial water content (Table 1). The concentration of Br− was larger in the 3rd year with the grazing regime than with the cutting regime at 0·3 and 0·4 m depth (P < 0·001 and 0·05, respectively; Fig. 2), and the Br− COM was largest with the grazing regime, although the difference was not significant (Fig. 3).
Mass of bromide per soil volume unit (μg/cm3 soil) measured in the soil at five depths for all treatments.

Mean centre of mass of bromide (COM, in m) for all treatments. Error bars represent standard error of the mean.

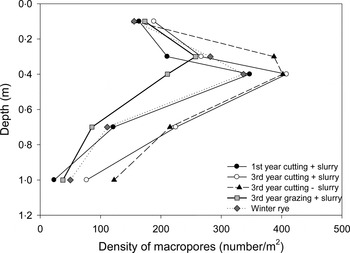
No significant differences in the density of macropores >1 mm were identified between treatments at 0·1 m depth (Fig. 4). Below that depth, a larger number of macropores was registered in the 3rd year of leys with cutting, with and without slurry application than for the other treatments (Fig. 4).
Density of macropores for all management regimes.

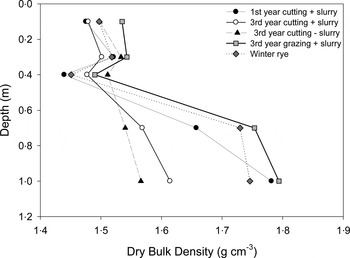
The dry bulk density measured at 0·1 m depth was significantly greater in the plots with grazing than with cutting (1·54 and 1·48 kg/m3, respectively; P < 0·05; Fig. 5). No differences were detected between treatments at 0·3 and 0·4 m depths. Significant differences in bulk density were observed at 0·7 and 1·0 m depths, increasing from 1·55 to almost 1·8 kg/m3 depending on the treatments (P < 0·001).
Mean dry bulk density (g/cm3) measured after irrigation at five depths for all treatments.

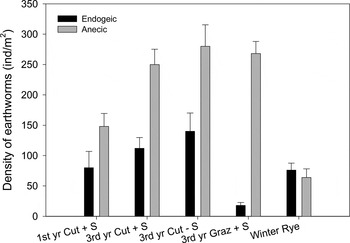
Earthworm populations were dominated by two anecic species, L. herculeus and A. longa, and two endogeic species, A. caliginosa and A. rosea (data not shown). As no Lumbricus species other than L. herculeus were found, immature specimens belonging to Lumbricus sp. were assumed to be L. herculeus. Differences in average density of endogeics and anecics were tested between and within management regimes (Fig. 6). The anecic earthworm species were not affected by trampling, but the density of endogeic species was reduced. In the 3rd-year ley, the density of anecic earthworms was larger than the density of endogeic earthworms, but no such differences were observed in the 1st-year ley or in the winter rye. In addition, density of anecic earthworms was significantly smaller under winter rye than under 3rd-year ley (P < 0·001).
Density of anecic and endogeic earthworms registered in the experimental plots. Error bars represent standard error.

DISCUSSION
Consequences of grazing/cattle trampling on water flow through the soil profile (Hypothesis H1)
The larger concentration of bromide and Br− COM at 0·3 and 0·4 m depth with the grazing regime indicate a faster water flow down to 0·4 m depth for the grazing regime than for the cutting regime. A range of studies show that cattle trampling reduces macroporosity (Warren et al. Reference Warren, Nevill, Blackburn and Garza1986; Pietola et al. Reference Pietola, Horn and Yli-Halla2005; Kurz et al. Reference Kurz, O'Reilly and Tunney2006; Herbin et al. Reference Herbin, Hennessy, Richards, Piwowarczyk, Murphy and Holden2011; Phelan et al. Reference Phelan, Keogh, Casey, Necpalova and Humphreys2013). The high dry bulk density measured at 0·1 m depth in the plots with grazing indicates a reduction in total porosity at this depth for the plots subjected to cattle trampling. Water flow was faster and total porosity was lower with grazing, but densities of macropore >1 mm in diameter for the two treatments were equivalent at 0·1 and at 0. 3 m in the soil profile. Macropores registered were mainly biopores, as the sandy loam in the current experiment is not swelling. The deep-burrowing anecic earthworm species were able to maintain their burrows in both treatments, but the density and thus activity of endogeic species were reduced. Hand-sorting methods can lead to underestimation of the density of anecic species. Nieminen et al. (Reference Nieminen, Ketoja, Mikola, Terhivuo, Siren and Nuutinen2011) extracted 0·09 of the L. terrestris individuals using a hand-sorting method alone as compared with a combination of hand-sorting and formalin extraction methods. The underestimation of anecic species was assumed to be similar for all treatments. Cattle trampling affected mainly earthworm species living in the topsoil, but deep-burrowing species are less sensitive to cattle trampling, being protected in the permanent vertical burrows they produce (Piearce Reference Piearce1984; Cluzeau et al. Reference Cluzeau, Binet, Vertès, Simon, Rivière and Tréhen1992). Some negative effect of grazing on anecic earthworms might also be counteracted by the beneficial effects of an enhanced food supply in the form of plant litter and dung from animals (Curry et al. Reference Curry, Doherty, Purvis and Schmidt2008). Water transport occurs much faster through macropores than through the soil matrix (Beven & Germann Reference Beven and Germann2013) and an increase in bulk density in the presence of macropores will enhance preferential flow through macropores (Mossadeghi-Björklund et al. Reference Mossadeghi-Björklund, Arvidsson, Keller, Koestel, Lamandé, Larsbo and Jarvis2016). The larger dry bulk density at 0·7 and 1·0 m depths with grazing was due to pedology (Heidmann Reference Heidmann1989) and was not an effect of trampling.
Effects of the duration of leys on water flow (Hypothesis H2)
Soil tillage, especially ploughing, severs continuous macropores (Murphy et al. Reference Murphy, Koen, Jones and Huxedurp1993), which reduces water transport to soil layers deeper than the plough pan (Frede et al. Reference Frede, Beisecker and Gäth1994). It could explain the smaller mass of Br− measured for winter rye compared with the 1st year of ley at 0·3 and 0·4 m depth, and the trend of a lower depth of leaching. Bromide absorption by plants and residues should have been larger for leys than for winter rye (Kung Reference Kung1990), even attenuating the differences observed. No differences in water infiltration to 0·1 m between winter rye (7 months after the last ploughing and 2 months after harrowing) and the 1st year of ley (18 months after the last ploughing) were detected. An initial settlement occurred soon after tillage: tilth reorganized due to changes in water suction during few wetting–drying cycles. Porosity in the topsoil a few weeks after ploughing should have been larger than in the 1st- or 3rd-year leys. The rapid reduction of porosity following ploughing was also observed by Somaratne & Smettem (Reference Somaratne and Smettem1993) and Osunbitan et al. (Reference Osunbitan, Oyedele and Adekalu2005). The smaller amount of Br− at 0·1 m depth in the 3rd-year ley compared with the 1st year was probably due to an increase in earthworm activity and roots, producing or re-establishing continuous macropores during the 3 years without tillage (Hangen et al. Reference Hangen, Buczko, Bens, Brunotte and Huttl2002). Soil tillage related to the establishment of winter rye affected anecic species more than endogeic species, and density of anecic species increased with the duration of the ley.
Rapid water flow will decrease further with duration of leys with a cutting regime without cattle slurry application (Hypothesis H3)
Eriksen et al. (Reference Eriksen, Askegaard and Søegaard2014) showed 10% higher yields in plots with slurry injection than without. The present results showed no effect of cattle slurry injection on the distribution of Br− mass, bulk density, or density of macropores in the soil profile, or density of anecic or endogeic earthworms. Soil conditions and availability of nutrients for earthworms in the 3rd-year ley were not significantly changed by injection of slurry.
Management effects on the risk of solute leaching
A larger bulk density and deeper infiltration of water 1 day after irrigation, as observed in the 3rd year of ley with a grazing regime, indicates the occurrence of preferential flow, which would bypass the water held in the active soil matrix. Bypass flow decreases the risk of the leaching of NO3 − contained in the marginal and remote pores, according to the definition of Arah & Ball (Reference Arah and Ball1994), but increases the risk of NO3 − leaching from urine patches. In the present study, the area covered by urine made up 0·47 of the grazed area (based on 0·00047 of the area affected/cow/ha/day (Afzal & Adams Reference Afzal and Adams1992) and adjusting for animal size (one heifer equals 0·8 cow)), and the number of macropores close to the surface was 200 per m2. Rainfall intensity and soil water potential are two very important factors controlling the occurrence of preferential flow. The combination of an irrigation intensity of 18·5 mm/h and a soil water potential close to field capacity is a common occurrence in Denmark. However, grazing is not evenly distributed over the season for 2008. Because of faster crop growth in the spring, the ley supports more grazing animals at this time of the year, and 0·83 of the total number of grazing days took place prior to 1 September at the study site. This is the time when the soil receives the majority of urine deposits and when the water content is at its lowest.
CONCLUSIONS
The present results showed some of the effects of soil structure dynamics in organic dairy rotations on water flow. Rate of water transport increased significantly from the soil structure inherited from ploughing, harrowing and seeding, followed by 2 months of wetting/drying cycles to the 1st year of the ley phase of the rotation. Rate of water transport increased even more in the 3rd year of the ley phase with a grazing regime. The density of deep-burrowing species increased by a factor 2 and bulk density decreased (i.e., porosity increased) during the transition between winter rye and the ley phase. In that case, both macropore and matrix flow increased. Cattle trampling led to an increase of bulk density, which enhanced preferential flow through large macropores, which were not affected by grazing. Rainwater may therefore bypass the soil matrix under similar or more extreme conditions than were encountered in the present experiment, which could reduce the risk of leaching of NO3 − held in the soil water in the remote and marginal pores, but enhance deep transport of colloids and adsorbed pollutants and nutrients. Organic dairy rotations are N-efficient systems and cattle slurry application in the 3rd-year cut grass-clover did not influence water flow in soil, bulk density, macropore density, density of anecic or endogeic earthworms.
The technical assistance of Stig T. Rasmussen and the staff at Foulumgård Experimental Station are gratefully acknowledged. This study was financially supported by the International Centre for Research in Organic Food Systems (project OrgGrass). The two anonymous reviewers are thanked for valuable comments and suggestions on the manuscript.