Among the sound changes in progress in North American English, one of the most widespread is the Low Back Vowel Merger. It is a characteristic feature of dialects of Western Pennsylvania, eastern New England (Herold, 1990, 1997; Kurath & McDavid, 1961; Labov, 1996; Wetmore, 1959), Canada, and broad areas of the western United States (Hartman, 1985; Labov, 1991; Labov, Ash, & Boberg, 2006). Although the Low Back Vowel Merger cannot be said to define a distinct regional variety of North American English in the strictest sense, resistance to merger defines distinct Northern and Southern varieties of American English, characterized by the Northern Cities Vowel Shift and Southern Vowel Shift, respectively.
A growing body of evidence over the past decade shows that the low back vowel merger is actively spreading into areas where one might anticipate resistance to merger, especially areas of the South (Anderson, 2005; Bailey, Wikle, Tillery, & Sand, 1993; Feagin, 1993; Fridland, 1998, 2004; Gordon, 2001, 2006; Irons, 2000, 2005; Majors 2004, 2005). The question naturally arises, does this phenomenon represent an expansion of the same merger that defines broad regions of the United States, or is it an independently occurring merger? In addressing this question, the present study provides a detailed analysis of the status of low back vowels in the speech of native nonurban Kentucky speakers of English, some of whom display unexpected instances of merger.
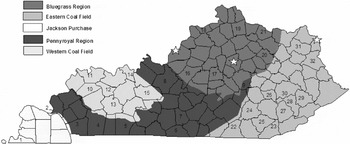
Kentucky speech is interesting, of course, in its own right. The state has an Appalachian area, an Ohio River Valley area, an interesting Bluegrass enclave, and a large central and western area that belongs to none of these. There are five distinct geographic regions of Kentucky, which had an impact on the settlement history of the state and continue to have a strong sociocultural influence in the state: the Eastern Coal Field, which includes the Cumberland Plateau region of the Appalachian Mountains; the Bluegrass Region, which is world renowned for its thoroughbred horse farms; the Pennyroyal Region, which is the upland region of the Mississippian Plateau; the Western Coal Field, which extends south of the Ohio River in western Kentucky; and the Jackson Purchase, which is a low-lying plain circumscribed by the Mississippi, the Ohio, and the Tennessee rivers.1
Newell (1986) and Kleber (1993) are the source for much of the physiographic, economic, and transportation infrastructure information both here and later in the article, although much of it was also observed first hand during the course of field work. Population data come from the Kentucky State Data Center at the University of Louisville.
The study presents evidence that the low back vowel merger has appeared widespread across the state within a single generation. Although the outcome is the same, i.e., the suspension of phonemic contrast between

as in tot and

as in taught, this study suggests that the low back vowel merger that is proceeding in some parts of the state is not an expansion of existing merger, but is an independent occurrence of merger. In the course of the analysis, the study proposes that the mechanism underlying this low back vowel merger is back upglide loss, that is, the erosion of a phonological feature that has been a factor in resistance to merger in the South. In the process, some additional light may be shed on that most recalcitrant of questions facing variationist sociolinguistic studies: Why does language change occur?
BACKGROUND
One of the earliest observations that low back vowels are merging in American English was made by Gordon Peterson and Harold Barney in their classic article, “Control methods used in a study of the vowels.” A significant result of a listening test they conducted was that participants confused

and

more frequently than any other vowels. They attributed this result to the fact “they speak one of the forms of American dialects in which

and

are not differentiated” (1952:178). Although they do not elaborate on the range of American dialects in which these vowels are not distinguished, in discussing one observer who had particular difficulty in distinguishing between

and

, they concluded that “it appears that if a speaker does not differentiate clearly between a pair of sounds in speaking them, he is unlikely to classify them properly when he hears others speak them. His language experience, as would be expected, influences both his speaking and his hearing of sounds” (1952:179). Indeed, minimal pair and commutation tests, techniques commonly used in contemporary sociolinguistic studies, generally confirm the truth of this conclusion. Curious counterexamples are cases of near merger, in which subjects maintain a distinction that they are reportedly unable to perceive (Di Paolo, 1992; Labov, Yaeger, & Steiner 1972). It has been suggested that this phenomenon may provide a plausible explanation for apparent mergers (such as that of meat and mate) that later reversed themselves (Labov, 1994; Trudgill & Foxcroft, 1978). Alternatively, it may also be the case that this paradoxical asymmetry between perception and production is an artifact of a metalinguistic labeling task and is not indicative of everyday communication and authentic language use (Harris, 1985). It is not yet clear what role, if any, this phenomenon plays in the diffusion of the merger.
Evidence for the incidence of the low back vowel merger may be found in the work of the Linguistic Atlas of the United States and Canada in the 1930s and 1940s. It is first analyzed, described, and summarized by Thomas Wetmore in a 1959 PADS monograph “The low-central and low-back vowels in the English of the Eastern United States.” His primary finding was that the two phonemes are identical in a large section of Western Pennsylvania, centered around Pittsburgh in the Upper Ohio Valley, and that the “lack of the phonemic distinction,

versus

, extends eastward into central Pennsylvania” (1959:115). He added that there is some evidence that this pattern is being accepted “to the south and west of the Ohio and the Monongahela [Rivers]” (1959:115). Significantly, this area, to the south and west of the Ohio River, includes part of the region covered by the current study.
Wetmore's finding is echoed and extended by Hans Kurath and Raven McDavid in The Pronunciation of English in the Atlantic States, wherein they noted that “Eastern New England and Western Pennsylvania lack the checked low vowel

which occurs in all other dialect areas. Here the free low-back phoneme

corresponds to two phonemes, the checked

of crop, lot and the free

of law, frost, of the other dialects” (1961:6). Kurath and McDavid also observed that the low free vowel

in words such as law and dog “is usually an upgliding diphthong with progressive rounding” in the upper South and that it “appears almost invariably as an upgliding

in the Upcountry region of the lower South (1961:22). As will be seen, this shift of

into the back upglide system is a significant feature of the phonology of Southern English, especially in relation to the possibility/mechanism of low back vowel merger.
In a “Guide to Pronunciation” included in the first volume of the Dictionary of American Regional English, James Hartman provided a description “of the most notable variants and their major geographical limitations” (1985:l). In his discussion of alternations among vowels, he found that,
Variation between back vowels and more centralized vowels is most obvious in AE in the occurrence of

and

. The low vowels as a group are highly variable in terms of their basic structure, their phonetic conditioning, social articulation, and the words sets that manifest a given sound, and the distinction between “short o” words like cot, tot, and rot, and au or ou words like caught, taught, and wrought is especially problematic. (1985:lx)
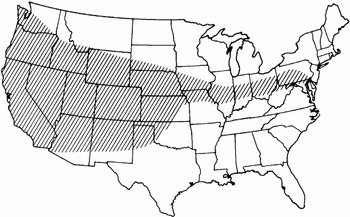
In this respect, he stated that “cot-caught word pairs may have contrasting low vowels, may have a single vowel, or may vary by word or word subset” (1985:lx). He concluded his analysis with a map, presented here in Figure 1, that shows the areas where

as in cot and

as in caught are merged. There is no evidence of merger in Kentucky. It is worth noting that the map also presents no indication of merger in Eastern New England, which was observed by Kurath and McDavid. This result may reflect a bias or limitation in the number and types of speakers interviewed for the project. He did conclude with the caveats that “it is important to remember that the boundaries for each feature are necessarily fuzzy” and that “the patterns must be seen as representing the situation at a particular time and not as a static picture of what will always be” (1985:lxi).
2Given these caveats, the close proximity to the region considered in this study, and the lack of detail concerning the methodology underlying Hartman's analysis, acoustic analysis of the audio recordings for all Kentucky speakers in the DARE project was conducted as preparation for the study, although full details are not included here. Results from the preparatory analysis show no evidence of merger in Kentucky, confirming what is illustrated in Figure 1. Moreover, this analysis does indicate that

is not a monophthong in Kentucky speech but is a diphthong characterized by a back upglide throughout much of the state, similar to what Kurath and McDavid observed in the upland South. An extreme case is indicated in the example of a speaker from Bath County, born in 1896. Data for this speaker are presented in the following table.

For this speaker, the nucleus of

has a higher F1/F2 than the nucleus of /a/, shifted to the front and unrounded. At midpoint, the vowels coincide on the F1/F2 plan. At offset, the

vowel has a strong back upglide with an F1/F2 lower than /a/.

Low vowel merger in American speech (Reprinted from Hartman 1985: lxi; Copyright © 1985 by the President and Fellows of Harvard College).
More recently, in A national map of the regional dialects of American English, William Labov, Sharon Ash, and Charles Boberg presented evidence that the low back vowel merger has indeed extended into Kentucky speech (1997). Telsur surveys, a telephone survey of North America conducted in 1995 and 1996, indicate expansion of the merger into areas of northeastern and central Kentucky, specifically, the communities of Ashland and Lexington, which are connected by the I-64 corridor extending west from West Virginia. Significantly, the merger has not expanded further west along this major transportation corridor into Louisville, in Jefferson County. Telsur data provide no information outside of these urban influence centers.
In the Atlas of North American English (2006), Labov et al. further identified three regions that display resistance to expansion of the back vowel merger. The first region of resistance to merger is the Inland North, defined by the Northern Cities Shift. The second region of resistance to merger includes New York City and the Mid-Atlantic States, where the margin of security between

and

is increased by the raising of

to mid or high back position. Finally, the third region of resistance is the South. As noted earlier, in the phonology of Southern English,

has shifted into the back upgliding system. In this shift, the nucleus of

has unrounded and fronted, so that it often coincides with the nucleus of

in the F1/F2 plane. The feature that “provides the margin of security for the /o/ ∼ /oh/ distinction in the South is … the presence of a back upglide with /oh/” (2006:124). In a later chapter, they suggest that “[w]e would expect this pattern to show a complementary geographic distribution to that of the low back merger, and it does: the /oh ∼ aw/ isoglosses do not include the points in Virginia, West Virginia, and Kentucky where chapter 9 reported an expanding merger of /o/ and /oh/” (2006:259).
Although it does not add considerably to our knowledge of the geographic distribution of the low back vowel merger, work by Ruth Herold on low back vowels in Pennsylvania is extremely important for the insight it provides into possible mechanisms of merger. In studying the progression of the low back vowel merger in Eastern Pennsylvania, Herold (1990, 1997) argued against continuous eastward expansion and discontinuous diffusion of the merger from western regions of the state. Drawing on a range of evidence, she demonstrated that the merger in the mining towns of eastern Pennsylvania is an independently occurring merger that was the result of an influx of nonnative speakers of English shortly after 1900. In the process, she argued that neither the concept of merger-by-transfer, which is phonetically abrupt and lexically irregular, nor the concept of merger-by-approximation, which is phonetically gradual and lexically regular, can account for the merger in this region, as apparent time data from her studies “show that the implementation of the low back merger … was neither lexically nor phonetically gradual, and that the merger was completed within a single generation” (1997:185). As an alternative explanation of the mechanisms that underlie the implementation of the merger, she put forth the concept of merger-by-expansion, which is both phonetically abrupt and lexically regular: “in merger-by-expansion, the lexical constraints on the distribution of two phonemes disappear as a result of contact with people who do not observe them” (1997:185). The constraints disappear because “the distinction ceases to be useful for making semantic distinctions when one is in contact with people who do not reliably produce it” (1990:92) and continued use of the distinction actually increases misunderstandings. Contrary to the functional view that mergers represent a loss of information, she argued that merger-by-expansion restores balance to a community and actually facilitates communication. Phonetically, the result is a union of the ranges of the two phonemes, not a cause. In the context of the larger question of why languages change, she put forth the “hypothesis that complete, unconditioned mergers typically occur in high contact settings, and that they are likely to be the result of imposition” (1997:187). One of the challenges for this study and for future research is to test this hypothesis.
METHOD
The study presented in this article involves the analysis of over 5,000 tokens of the back vowels of English

and

produced by 114 native speakers of Kentucky English. The data for this study come from the Phonological Atlas of Kentucky project. In that project, a study of variation and change in nonurban areas of Kentucky, field interviews were conducted in or near each of those Kentucky communities in which interviews were conducted for the Dictionary of American Regional English in the 1960s. To complete gaps in the sampling grid in the western areas of the state, additional interviews were conducted in five communities that were included in the Linguistic Atlas of the North Central States. The location of these communities is indicated in Figure 2, and an index to community location, including population information, is included in Table 1. For point of reference, the communities of Ashland, Lexington, and Louisville (included in the Telsur project) are indicated in Figure 2 by stars. With the exceptions of Henderson (in Henderson County), Radcliff and Ft. Knox (in Hardin County), and Berea (in Madison County), all community locations are small towns and rural villages outside of metropolitan statistical areas and the influence of urbanized areas. In addition, most of these communities are located in areas of low population density and are declining in population.

Map of physiographic regions of Kentucky and location of towns listed in Table 1.
Location, population, and population trend of communities

In keeping with the methods of traditional American dialectology, all participants in the study are second or third generation life-long native residents of their communities. Appendix A presents demographic information about each participant, all of whom are Caucasian. As the Dictionary of American Regional English project field records provide the baseline for the study of variation and change in real time in Kentucky speech, selection of informants focused on younger subjects, especially in the eastern areas of the state, although efforts to obtain a sufficient distribution were made, where possible. Each subject participated in a sociolinguistic interview, in which each was asked to provide demographic information, to discuss life, experiences, and issues in that region, and to read word lists and a passage. All speech samples were recorded digitally, using GoldWave v4.25, a headset microphone, and a laptop computer.
Acoustic analysis of back vowel tokens was performed using PRAAT 4.21, developed by Paul Boersma and David Weenik (2005). Between 30–50 tokens of words containing an instance of

and

were analyzed for each speaker. In order to have contrasting phonetic environments necessary to make a determination of merger, tokens from each speaker selected for analysis include multiple minimal pairs, elicited in an h-V-d, b-V-t, t-V-k, and k-V-d word list format, similar to that used by Peterson and Barney (1952), and embedded into a reading passage. Tokens following /w/, as in wash, walk, and watch were excluded from analysis for two reasons. First, the initial semivowel glide has such an overwhelming effect on the shape of the vowel envelope that it is often difficult to determine an appropriate point to measure the vowel onset. Second, the vowel in these words varies from speaker to speaker, in terms of roundedness and backing, making it difficult to assign a vowel class appropriately. In addition, tokens before a tautosyllabic /r/ in words such as march and barn were generally excluded from analysis, as the strong descending F3 formant of the /r/ makes it difficult to obtain accurate readings. Finally, tokens of got, of, and because were excluded from analysis because they are frequently realized with an unstressed mid-central vowel.
The single point of F1/F2 vowel formant value measurement methodology that informs the Telsur project was determined to be insufficient for purposes of the current project, as critical information about the distinctive character of a vowel phoneme is frequently observed in its trajectory, not its nucleus, particularly in those varieties of American English identified as Southern (Thomas, 2001, 2003). To capture information about the trajectory of each vowel token, which in many cases is the feature that distinguishes

from

, multiple F1-F3 vowel formant measurements were taken from Fast Fourrier Transform (FFT) spectra of each vowel, using a 25 ms Gaussian window, at between 10 to 12 ms intervals, from approximately 25 ms after vowel onset and approximately 25 ms from the transition at the end of the vowel into the following consonant. The difficulties in plotting sequential measurements of a single vowel are overcome by using multiple plots for each speaker, comparing onset, midpoint, and offset. Extraction was performed using the linear predictive coding method, with pole settings ranging from 8 to 14. Automation of data collection was facilitated by the use of Akustyk 1.74, a plug-in for PRAAT developed by Bartlomiej Plichta (2005). In many cases, this analysis was confirmed by visual inspection of the FFT spectra and by hand measurements. As vowel duration has been identified as one feature that distinguishes vowel phonemes in English (Klatt, 1976), vowel duration was measured, as well. Multiple paired t tests were performed to determine the significance for each acoustic parameter measured.
Based on the analysis of these acoustic parameters, the low back vowel systems of participants in this project are classified in one of the following four ways.
Distinct. Speakers classified as distinct show a clear margin of security between

and

at nucleus/onset, midpoint, and offset.
Back Upglide. In the low vowel systems of speakers classified as back upglide,

and

generally coincide on the F1/F2 plane at nucleus/onset, with margin of security provided by the presence of a back upglide on

. Typically, for these speakers, the

diphthong in words such as house has shifted forward and is realized phonetically as

or

.

has moved into the space vacated by

and is properly characterized phonetically as

,

, or

. Labov et al. (2006) characterized this pattern of change as the Back Upglide Chain Shift.
Merger. Speakers who show no significant difference between F1/F2 values of

and

at nucleus/onset, midpoint, and offset and no difference in vowel duration are classified as merger. Any classification of merger is confirmed by independent impressionistic examination.
Partial Merger. Speakers classified as partial merger display no significant difference between

and

in a majority of phonetic environments, yet maintain a clear distinction between the two in certain environments. This kind of system is particularly intriguing, as it implies a merger that may be phonetically conditioned. In an interesting analysis of this partial merger phenomenon in the speech of Southern Californians, Moonwoman (1987) pointed to the possibility that lexical item frequency plays a role in the diffusion of the innovation. Unfortunately, its incidence is too low to make any conclusions in this study. All such patterns, however, do occur in locations where there are also speakers who display full merger. These cases approximate cases of near merger. As described earlier, these individuals reflect a paradoxical asymmetry between perception and production, namely, that they are unable to perceive a distinction that they consistently produce.
Expansion of merger in Kentucky
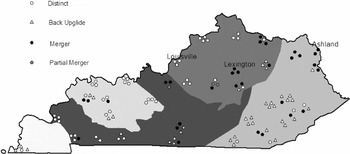
The map in Figure 3 shows the overall geographic distribution of various configurations of low back vowel systems in Kentucky, as described earlier.3
As they have bearing on the present study, data from the Telsur survey, although not analyzed here, are also included on the map. Represented are Telsur subjects TS283, TS284, TS285, TS293, TS308, TS518, TS521, and TS527. Data on these subjects may be found at the following location: http://www.ling.upenn.edu/phono_atlas/tsdata/.

Low back vowel merger in Kentucky.
Jackson Purchase
Acquired by treaty with the Chickasaw Indians in 1819 (negotiated by General Andrew Jackson, after whom it is named) and annexed to Kentucky shortly thereafter, the Jackson Purchase is largely isolated from the economic, political, and population centers of the state. Paducah, at the confluence of the Tennessee and Ohio Rivers, is the largest city in the region. Southern influence is predominant, as all northbound freight from the Gulf of Mexico is serviced and reconsigned at Fulton, and Hickman, along the Mississippi River, is a public cargo-handling terminal for barge traffic along the river.
Not surprisingly, there is no evidence of low back vowel merger in the region. The two vowels are quite distinct in their overall dynamic structure and spectral shape. Similar to much of the upper South, as noted by Kurath and McDavid (1961),

is an upgliding diphthong. The nucleus of

is unrounded and overlaps with the nucleus of

, especially on the F1 plane, but is distinguished by progressive rounding of a back upglide. In contrast,

is essentially monophthongal, with the nucleus in low central position. In the speech of the younger speaker,

is monophthongal as well, evidence suggesting that the traditional Southern phonology is receding.
Pennyroyal Region
Situated above the limestone of the Mississippian Plateau and taking its name from the pennyroyal plant, a member of the mint family (Hedeoma puligiodes), the Pennyroyal Region (sometimes termed “Pennyrile”) is the largest of Kentucky's geographical divisions and adjoins all others.4
Technically, the Pennyroyal is separated physiographically from the Bluegrass Region by remnants of the Pottsville Escarpment at the western edge of the Cumberland Plateau and the Muldraughs Hill along the Rolling River, collectively known as the Knobs (Newell, 1986). Although a distinctive feature of the topography, practically, they constitute a “girdling” fringe for the Bluegrass Region. The town of Berea in Madison County, for example, is situated in the Knobs but is included as part of the Bluegrass Region in this study, based on economic and cultural similarity.
The pattern of low back vowel systems varies considerably across the Pennyroyal Region, perhaps a function of its size, transportation network, and adjacency to the other geographic regions of the commonwealth. In the western areas of the region, including Livingston, Trigg, Christian, and Logan Counties, the low back vowels are generally distinct. Variably,

is realized as a monophthong or diphthong with a back upglide. One younger speaker in Cadiz, however, displays merger. In the north-central community of Radcliff, one of the fastest growing cities in the state, adjacent to Fort Knox and Elizabethtown in Hardin County, the low back vowels are typically merged. The presence of merger in this area of the region probably represents discontinuous diffusion, that is, the spread of a linguistic change from a distant urban center to another before spreading to smaller communities closer to the center of the change (Trudgill, 1974). As noted earlier, the area is a major transportation crossroads. Furthermore, in the period between 1995 and 2000, the region had the highest number of international migrants outside the urban areas of Louisville and Lexington. These two factors combine to create a high level of face-to-face oral communication and interaction with individuals outside of the area, a factor that contributes to the diffusion of linguistic change.
Further east in the region, including Metcalfe and Monroe Counties, the back upglide pattern is predominant, consistent with the distribution of the Southern Back Upglide Chain Shift projected by Labov et al. (2006: Map 18.8). For the majority of individuals, the low back vowels coincide at nucleus/onset and are distinguished by the presence of a back upglide on

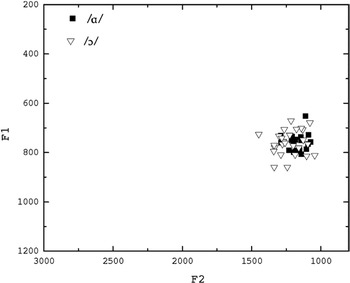
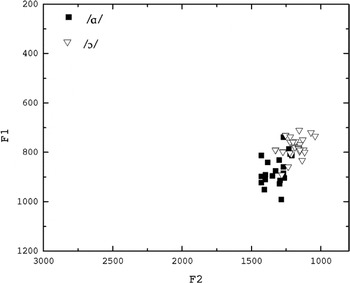
. Typifying this pattern is KY7B, a 48-year-old male bank manager from Edmonton in Metcalfe County. Overlap of the nuclei/onset of

and

is illustrated in the plot of F1/F2 in Figure 4.

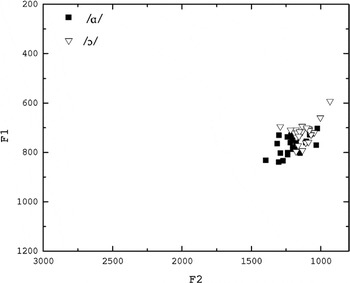
Onset F1 and F2 vowel plot for speaker KY7B, Edmonton.
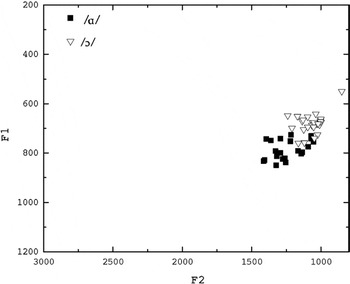
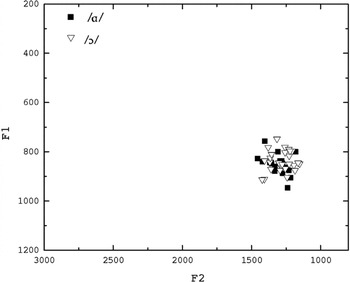
At midpoint, as seen in the vowel plot in Figure 5,

is slightly up and back of

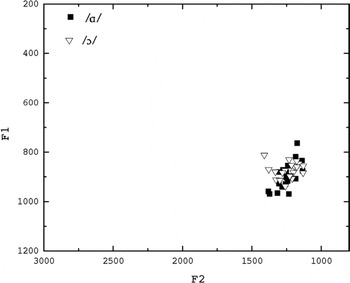
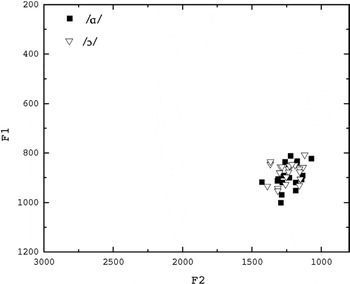
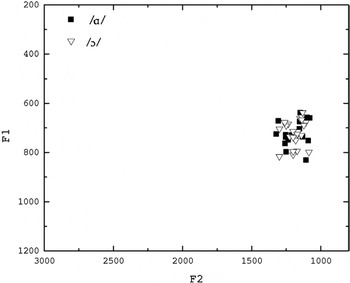
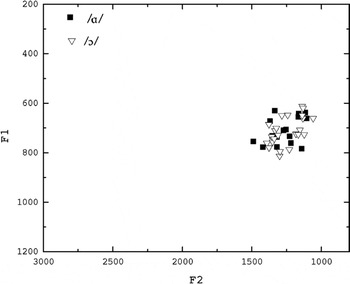
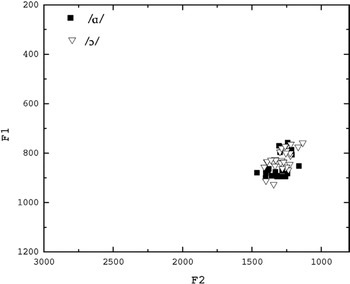
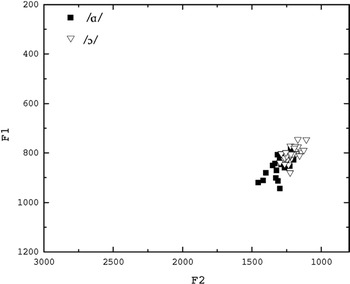
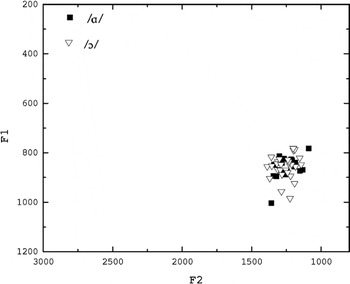
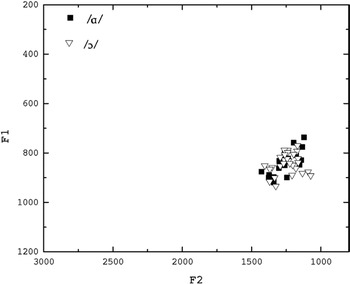
. Finally, at offset, as seen in the vowel plot in Figure 6, the two vowels are clearly distinct. Some younger speakers from the same area, however, display an unexpected merger. One such individual is KY7D, a 19-year-old female bank clerk who works and interacts with KY7B on a daily basis. As illustrated in the vowel plot in Figure 7, the nuclei of

and

coincide at onset. But in contrast with speaker KY7B, her speech has no back upglide that serves to distinguish

from

at midpoint or offset, as indicated in the vowel plots in Figures 8 and 9. In her speech,

remains essentially monophthongal throughout its trajectory, and the loss of back upgliding movement results in merger.

Midpoint F1 and F2 vowel plot for speaker KY7B, Edmonton.

Offset F1 and F2 vowel plot for speaker KY7B, Edmonton.

Onset F1 and F2 vowel plot for speaker KY7D, Edmonton.

Midpoint F1 and F2 vowel plot for speaker KY7D, Edmonton.

Offset F1 and F2 vowel plot for speaker KY7D, Edmonton.
Western Coal Field
Named for the coal that underlies much of the area, the Western Coal Field is an almost circular region in western Kentucky, south of the Ohio River, and geographically is an extension of the Eastern Interior Basin that stretches across southern and central Illinois and southwestern Indiana. Although no major interstate highways cross the region, state parkways create a close-knit transportation network, both among the major cities in the region, which include the Ohio River port cities of Henderson and Owensboro and the coal center of Madisonville, and with the major cities to the south in the Pennyroyal Region.
The low back vowels are generally distinct across the region, but speech in the Ohio River and eastern areas of the region differs from the south and western areas of the region with respect to the nature of the

vowel. In the river cities of Henderson
5It should be noted that the speech of two subjects interviewed in Henderson is characterized by a low back vowel merger. But each was excluded from this study, as neither is a life long resident of the area. Rather, each grew up in Indiana and later migrated to Henderson. If this trend of in-migration persists, merger by expansion is predicted to occur in this area within a generation. Henderson is part of the Evansville-Henderson metropolitan statistical area. Telsur includes two subjects from Evansville, TS89 and TS90. The low back vowels remain distinct in TS89, whereas they are close in TS90.

is typically a long ingliding vowel, realized as a monophthong or with an inglide towards schwa. But in the southern and western coal mining areas of Webster, McLean, and Muhlenberg County,

has shifted into the back upglide system, similar to the pattern observed in the Jackson Purchase and Pennyroyal Region.
The phenomenon of low back vowel merger co-occurring with back upglide systems observed in Metcalfe and Monroe counties in the Pennyroyal region also shows up in Webster County, one of the centers for surface strip mining in the region. Representative of the back upgliding pattern is the speech of KY9A, a 73-year-old male farmer, who also serves as part-time village mayor. As seen in the F1/F2 plot in Figure 10, the nuclei of

and

occupy similar positions. The back upgliding movement that differentiates

from

in this individual's speech is clear in the vowel plots presented in Figures 11 and 12. While

remains essentially monophthongal throughout the course of its trajectory,

raises about 50 Hz in the F1 dimension and moves back approximately 170 Hz in the F2 dimension, providing a significant margin of security between the two vowels.

Onset F1 and F2 vowel plot for speaker KY9A, Dixon.

Midpoint F1 and F2 vowel plot for speaker KY9A, Dixon.

Offset F1 and F2 vowel plot for speaker KY9A, Dixon.
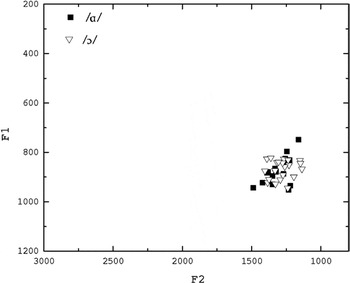
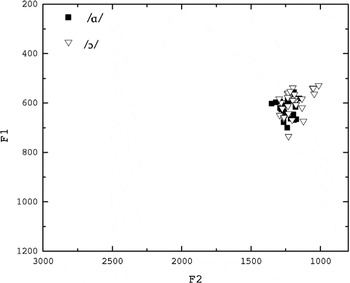
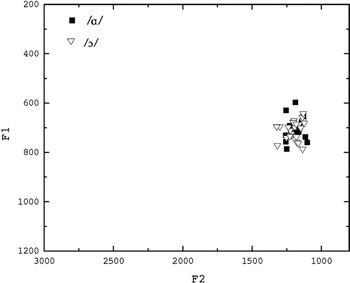
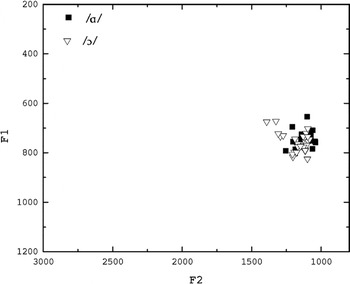
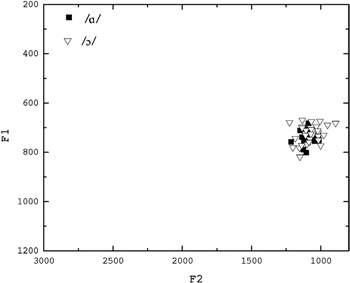
As was the case in parts of the Pennyroyal region, the speech of younger individuals in Webster County is characterized by an (unexpected) low back vowel merger. One such individual is KY9E, a 19-year-old male bank clerk. As illustrated in vowel plots in Figures 13, 14, and 15,

and

occupy the same phonetic space at onset, midpoint, and offset. In contrast with the speech of KY9A, the speech of this individual lacks the distinctive back offglide that distinguishes the two vowels in the speech of the older individual.

Onset F1 and F2 vowel plot for speaker KY9E, Dixon.

Midpoint F1 and F2 vowel plot for speaker KY9E, Dixon.

Offset F1 and F2 vowel plot for speaker KY9E, Dixon.
It should be noted that the phonetic space occupied by

and

is relatively compact at onset and midpoint, while it is more spread at offset. This pattern of greater dispersal at offset reflects the fact that both vowels have an inglide toward schwa in certain phonetic environments, such as [__ t], while they remain monophthongal in other environments. This inglide is evident in the average 60–70 Hz forward movements in the F2 dimension for each vowel, which reflects a range of about 300 Hz. But this should not obscure the larger fact that, once again, the loss of the back upglide on

results in merger.
Bluegrass Region
Named for the bluegrass plant (Poa pratensis) that thrives in the pastures over the region's limestone soil, the Bluegrass Region of east-central Kentucky is the political and population center of the state. The region is home to over half the state's population, most of whom are concentrated in the urban areas of Lexington, Louisville, and the metropolitan area of greater Cincinnati in northern Kentucky. Best known for its horse farms and the annual Kentucky Derby at Churchill Downs, the region is interconnected by major interstate highways I-64, I-71, and I-75, to form an urban cluster known as the Golden Triangle, the principal manufacturing area that is the economic engine for the state.
As indicated earlier, the Telsur survey presents evidence of the low back vowel merger in Lexington. The findings of this study suggest that the merger is expanding into the urbanized area south of Lexington, along I-75 into Berea in Madison County. It also appears that the merger may be expanding southwest, along US 68 into Harrodsburg in Mercer County, which is more rural, just beyond the zone of influence of the Lexington Metropolitan Statistical Area. This study also finds evidence of the low back vowel merger in Maysville, a port city in Mason County along the Ohio River Valley. This result is not unexpected. In addition to river traffic through the area, Maysville represents a likely route for the expansion of the merger from the Midlands area of southern Ohio.
Evidence from the Telsur survey also indicates an advancing low back vowel merger among younger speakers in Cincinnati,6
Telsur subjects from the Cincinnati area include TS120, TS187, TS212, TS244, and TS250.
At least with respect to the evidence from the Telsur Survey, the low back vowels remain distinct in Louisville on the western edge of the Bluegrass Region. This fact may help explain why the merger has not penetrated further into areas of the Bluegrass, as noted in the preceding paragraph. As it is generally the case that mergers expand, the lack of merger in these two areas, while surprising, may reflect the influence of Louisville, which was well established as an important urban area in the 19th century. In contrast, Lexington is a relatively newer city whose major expansion as an urban area occurred in the post Word War II period. It is possible that the influence of Louisville on the speech in this area is greater than that of Lexington (and Cincinnati as well) and provides resistance to diffusion of the merger from Lexington further west into the area.
Indeed, these two cities represent a sharp contrast. Louisville is an older established city center, much like the pattern of urban development across the North, whereas Lexington is a new city, characteristic of the phenomenon of urban development across the South. The presence of these sharply contrasting metropolitan areas in such close geographic proximity makes the state of Kentucky extremely unique in North America, affording an intriguing opportunity for detailed comparative urban studies, unlike any carried out heretofore.
In contrast with the rest of the Bluegrass Region, the speech of the majority of individuals in Bath County, situated at the boundary between the Bluegrass and the Eastern Coal Field, typically displays the back upglide feature of the phonology of the upper South. This pattern is clear, for example, in the speech of KY20B, a 47-year-old who works as a development grant writer for the county. As the vowel plot in Figure 16 shows, the nuclei of

and

coincide in the F1/F2 plane at onset. The two vowels are distinguished by the back upward movement of

at midpoint and offset, as illustrated by the plots in Figures 17 and 18.

Onset F1 and F2 vowel plot for speaker KY20B, Owingsville.

Midpoint F1 and F2 vowel plot for speaker KY20B, Owingsville.

Offset F1 and F2 vowel plot for speaker KY20B, Owingsville.
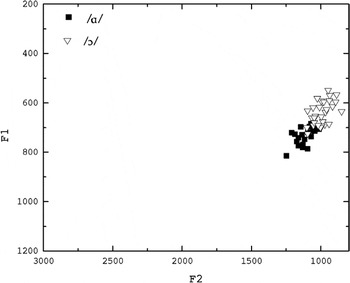
Yet in the same community, the low back vowels are merged in the speech of the youngest speaker, a 21-year-old female GIS intern, who is a co-worker of the development grant writer for the County. As indicated by the vowel plots in Figures 19, 20, and 21,

and

occupy the same phonetic space at onset, midpoint, and offset, indicating that the two vowels have merged in her speech.

Onset F1 and F2 vowel plot for speaker KY20D, Owingsville.

Midpoint F1 and F2 vowel plot for speaker KY20D, Owingsville.

Offset F1 and F2 vowel plot for speaker KY20D, Owingsville.
As Bath County is located on the I-64 corridor that connects the Ashland–Huntington and Lexington areas, where merger is evident, the pattern of merger in the younger speaker may represent diffusion of that merger by contact. While the merger may be motivated by contact and interaction with single phoneme speakers, the pattern of co-occurrence of back upglide and merger in the same community provides strong evidence that the actual mechanism for the merger is merger by glide loss.
Eastern Coal Field
The Eastern Coal Field is part of Appalachia, a diverse and complex region that is a cultural and geographical borderland that constituted America's first and longest-lived frontier, shaping westward movement in a way unlike any other area of the country. Stretching across the Cumberland Plateau region of the Appalachian Mountain Range, the Eastern Coal Field has very little open land, which has hindered settlement, economic development, and the construction of adequate transportation facilities to make the region accessible. The region overall has a low density population, which has declined from about 25% of the total population of the state in 1990 to about 17% of the total population in 2000, a product of a declining birth rate and domestic net out migration. Outside of the Ashland–Huntington metropolitan statistical area, there are no large cities in the region.
As indicated earlier, the Telsur survey provided evidence for the low back vowel merger in the Ashland–Huntington metropolitan statistical area in the northeastern part of the region in the Ohio River Valley. The present study provides further evidence of low back vowel merger in adjacent Carter County. Merger in this area of the region represents continuous expansion of the merger from the Ashland area, as the two are connected by I-64, the only major transportation route in the region, which extends across the northern quadrant, connecting Ashland to Lexington and Louisville.
Low back vowel merger is also present in the speech of individuals in Lawrence County, just south of the Ashland area. It is possible that low back vowel merger in this area is continuous expansion of merger from the Ashland area, as the two locations are connected by US-23, an important, although difficult, north-south route that played a major role in migration from the region after World War II, as people sought employment in the industrial cities in Michigan and Ohio. But the conclusion that merger in this area represents an expansion of merger must be tempered by the fact that a back upglide on

persists in the speech of younger individuals, as well.
Outside of the Ohio River Valley, much of the rest of the region is part of the upper South. It is no surprise, therefore, that the back upglide feature of the Southern phonology is strongly present in the speech of individuals in the region. Typical is the speech of KY30C, a 41-year-old white male security guard from Breathitt County. The pattern of overlap in the nuclei of

and

is evident in his speech, as illustrated in the vowel plot in Figure 22. In fact, the nuclei of the two vowels have actually reversed in his speech as the nucleus of

in his speech is lower and more forward than the nucleus of

. As indicated by the plots in Figures 23 and 24,

has a strong back upglide, raising approximately 100 Hz in the F1 dimension and backing an average 170 Hz in the F2 dimension.

Onset F1 and F2 vowel plot for speaker KY30C, Hardshell.

Midpoint F1 and F2 vowel plot for speaker KY30C, Hardshell.

Offset F1 and F2 vowel plot for speaker KY30C, Hardshell.
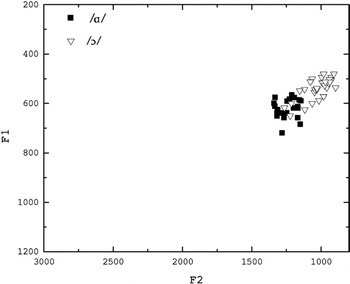
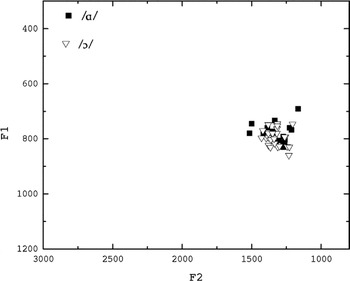
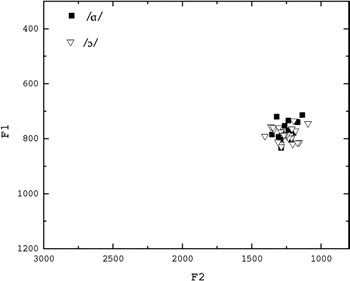
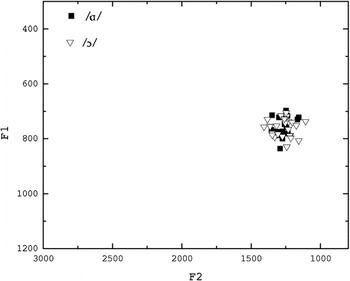
Quite unexpectedly, merger of the low back vowels is present in the speech of KY30F, a 20-year-old female coworker. As illustrated by the vowel plots in Figures 25, 26, and 27, her speech lacks a back upglide to distinguish

from

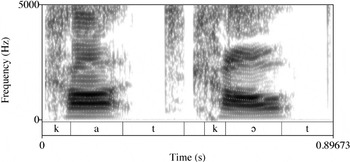
, resulting in a complete phonemic overlap characteristic of merger. The difference between the speech of these two individuals can be seen by comparing the spectrograms in Figures 28 and 29. Figure 28 contrasts the spectrograms for the minimal pair cot–caught in the speech of KY30C. At onset, F1 and F2 are similar for both vowels, but the difference in the formant trajectories for F1 and F2 differentiate the two vowels. Figure 29 contrasts the spectrograms for the minimal pair cot–caught in the speech of KY30F. In contrast with Figure 28, there is no difference in the formant trajectories of the two vowels, indicating merger.

Onset F1 and F2 vowel plot for speaker KY30F, Hardshell.

Midpoint F1 and F2 vowel plot for speaker KY30F, Hardshell.

Offset F1 and F2 vowel plot for speaker KY30F, Hardshell.

Spectrogram of cot and caught for speaker KY30C.

Spectrogram of cot and caught for speaker KY30F.
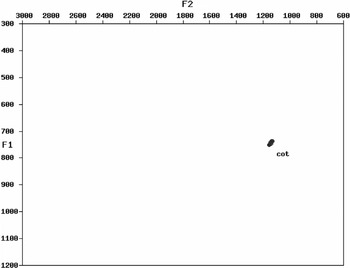
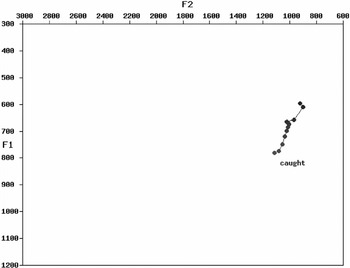
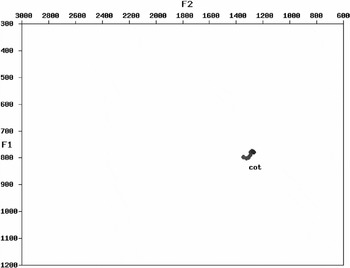
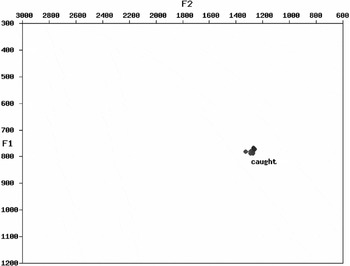
Plots of the vowel trajectories in these minimal pairs show how striking the difference is. The trajectories of

in cot and

in caught, respectively, for KY30C are shown in the plots in Figures 30 and 31. The trajectories of

in cot and

in caught, respectively, for KY30F are shown in the plots in Figures 32 and 33. The difference in the formant movement of

and

is dramatic in the speech of KY30C, while the overall spectral shape of

and

in the speech of KY30F is identical.

Plot of vowel trajectory of cot, speaker KY30C.

Plot of vowel trajectory of caught, speaker KY30C.

Plot of vowel trajectory of cot, speaker KY30F.

Plot of vowel trajectory of caught, speaker KY30F.
A similar pattern of merger by glide loss is evident in the speech of younger individuals in Knox, Perry, and Knott Counties. The presence of the back upglide remains particularly strong in the speech of younger speakers in Owsley, Leslie, and Laurel Counties. It will be interesting to see whether this feature persists in future generations or recedes, resulting in likely merger.
Yet another merger?7 The
heading for this section is a reference to the subtitle of a poster
presented by Crawford Feagin at NWAV 22 in 1993. Feagin reportedly
observed instances of merger with loss of the back upglide among younger
middle-class white speakers in Anniston, Alabama. Although the mechanisms
of merger are similar, the pattern in Anniston seems to be a vertical,
class-based change, whereas the merger by glide loss reported in this
study is a rural phenomenon that has no similar social class
basis.
The heading for this section is a reference to the subtitle of a poster presented by Crawford Feagin at NWAV 22 in 1993. Feagin reportedly observed instances of merger with loss of the back upglide among younger middle-class white speakers in Anniston, Alabama. Although the mechanisms of merger are similar, the pattern in Anniston seems to be a vertical, class-based change, whereas the merger by glide loss reported in this study is a rural phenomenon that has no similar social class basis.
The results of this study provide strong evidence that the low back vowel merger is distributed widely across the state beyond the Lexington and Ashland–Huntington areas, where merger was first reported by the Telsur Survey and Labov et al. (1997). In some respects, this finding is predictable. After all, it is a commonly accepted principle that “mergers expand at the expense of distinctions” (Labov, 1994:313). A significant finding of this study is that the merger is appearing among younger respondents in isolated areas of the Eastern Coalfields, the Pennyroyal region, and the Western Coalfields, where local speech is typically characterized by the back upglide system of southern phonology.
Given the contiguity of Kentucky with the merged areas of Western Pennsylvania and West Virginia and the merging areas of the Midland, it is tempting to reach a conclusion that the low vowel merger has simply spread into Kentucky by westward or southward diffusion. But the geographic patterns in the distribution of the merger across the state do not follow general predictions of a standard model for the diffusion of linguistic innovation and change. In the hierarchical model of dialect diffusion (Trudgill, 1974), innovations begin in more heavily populated cities and spread outward to smaller cities within the area of influence of the focal center. This pattern of diffusion results from the fact that large population centers typically have greater levels of interpersonal contact, which promotes the expansion of the change. In this model, change moves from one population center to another, leaving remote and isolated rural areas unaffected until the innovation is complete. But, with the possible exceptions of Bath County and Lawrence County, in those areas of the state in which low back vowel merger and the back upglide feature of the phonology of the upper South co-occur, the instances of merger resulting from glide loss documented in this study are not consistent with this model of diffusion. First, each of those areas where merger by glide loss is occurring has an extremely low density population, which is relatively stable or declining in size, as indicated by the census data in Table 1. Second, they are distant from the major highways and transportation routes in the state. The combination of these two factors results in relative weakness in face-to-face oral communication and interaction with individuals outside of the community. Given these facts, the pattern of merger by glide loss presents challenges to our understanding of how diffusion works.
Whether or not the merger appearing in isolated areas of Kentucky truly represents an expansion of existing merger from the Midlands region of North America, the mechanism whereby the merger occurs in these regions is distinct from the process of merger by phonetic approximation and is actually a complementary function of the back upglide system of Southern phonology. Remember that it is the presence of the back upglide on

that differentiates

from

in the phonology of English in the upland South. As that feature recedes among the speech of members of the younger generation, there is no longer any margin of security between the two phonemes. The result is necessarily phonemic overlap and merger. In other words, the loss of the diphthongal quality of the open

vowel among younger respondents contributes to the growth of merger. In the absence of other evidence, the distinctiveness of this mechanism suggests an independent origin for the merger outside of populated areas, where it could have reasonably been said to spread by hierarchical diffusion.
Answering the question “Why is this merger occurring” is more challenging and requires explanation of why the back upglide feature of upland Southern English is receding in some areas and not others. Given the complexity of this issue, only tentative considerations are advanced here.
While it is generally the case that mergers occur below the level of social awareness and no overt social evaluation is attached to the merger, it is possible that social evaluation may play a role in the mechanism of merger by glide loss. It is a well-established fact that certain linguistic features, especially in Southern speech, function as markers of regional and local identity, which plays a role in their persistence, even in response to pressure from external influences (Bailey et al., 1993). In speech of the upland South, the back upglide on

is one such feature of local identity.
Perceptual awareness and social evaluation of this feature as a marker of identity play a central role in the persistence of this feature. From this assumption it follows that the back upglide feature of the phonology of the upland South persists in the speech of those who identify strongly as local. The converse is true as well. This feature recedes in the speech of those who reject local identity. Given these assumptions, it is logical to conclude that merger by glide loss among younger speakers observed in various remote areas of Kentucky is motivated by a negative social evaluation and rejection of this feature as a stigmatized marker of local identity.
DIRECTIONS FOR FUTURE RESEARCH
Future research on the status of back vowels in Kentucky speech will be directed to testing the claim that negative social evaluation may play a role in the phenomenon of back upglide loss, resulting in low back vowel merger. Currently, experimental efforts are underway to investigate speakers' cognitive awareness of the low back vowel merger, employing a matched-guised procedure using synthetic stimuli to evaluate speakers' sensitivity to and social evaluation of the back upglide feature of the phonology of the upper South as a marker of local identity. In addition, this perceptual study of the low back vowel using carefully manipulated stimuli should make it possible to determine whether categorical boundaries exist between

and

in a way that standard commutation and minimal pair techniques do not.
As was stated at the outset, the merger of low back vowels is one of the most widespread changes in progress in North American English. It is also probably the most active change in progress, as well. It would be a mistake, however, to conclude that a single mechanism underlies the diffusion of this merger. As this study has attempted to show, the merger is showing up in unexpected places in a single generation and presents challenges for models of the diffusion of linguistic change. Regardless of the underlying social motivation, the study posits that one mechanism for low back vowel merger is the loss of the back upglide feature of the phonology of Southern English. Finally, it is predicted that as elements of traditional Southern phonology recede, similar merger will be widespread across the South. The task for future research is to determine whether this in fact proves to be the case.
APPENDIX A

APPENDIX B