Scholarship on American congressional elections has adopted competing perspectives about the role of ideology in election outcomes. On the one hand, borrowing from spatial models of electoral competition (Downs Reference Downs1957; Groseclose Reference Groseclose2001), empirical research on candidate behavior emphasizes the ways in which candidates strategically choose electoral platforms so as to maximize their chances of winning election (Ansolabehere, Snyder and Stewart Reference Ansolabehere, Snyder and Stewart2001a; Burden Reference Burden2004; Brady, Han and Pope Reference Brady, Han and Pope2007; Ansolabehere and Jones Reference Ansolabehere, Rodden and Snyder2010; Stone and Simas Reference Stone and Simas2010; Peress Reference Peress2013). Research on party positioning in multiparty systems similarly finds evidence that party positioning is responsive to voter preferences (Adams and Glasgow Reference Adams, Clark, Ezrow and Glasgow2004; Ezrow Reference Ezrow2007). But on the other hand, research on voter behavior in congressional elections tends to emphasize everything but the importance of candidate ideology. Congressional candidates suffer from low levels of name recall and recognition (Zaller Reference Zaller1992) and the electorate tends to have little interest in or knowledge of the issues (e.g., Berelson, Lazarsfeld and McPhee Reference Berelson, Lazarsfeld and McPhee1954; Campbell et al. Reference Campbell, Converse, Miller and Stokes1960; Dalager Reference Dalager1996). With such high levels of voter ignorance, congressional election outcomes are believed to result largely from factors such as partisanship (Mann and Wolfinger Reference Mann and Wolfinger1980), campaign spending (Jacobson Reference Jacobson1990), and incumbency (Erikson Reference Erikson1971; Cover Reference Cover1977).
We argue that previous scholarship on the determinants of individual-level vote choice in congressional elections suffers from a variety of limitations. In particular, comprehensive measures rarely exist for the platforms chosen by both candidates in the same congressional election. While roll call voting records may be a reasonable substitute for characterizing the ideology of incumbents seeking re-election, comparable data for challengers are scarce. The use of ideological self-identification scales to measure citizen ideology further introduces concerns about measurement error and interpersonal comparability. And finally, even if good measures existed for both candidates and citizens, it is unclear how to make comparisons between them. These limitations impeded efforts to determine how well citizens’ vote choices in congressional elections reflect their ideological leanings.
This paper introduces new data to examine the relationship between candidate locations, citizen preferences, and vote choice in congressional elections. We estimate citizen preferences using large batteries of policy-oriented questions that appeared on two large national surveys: the 2008 Cooperative Congressional Analysis Project and the 2010 Cooperation Congressional Election Study. Using survey data collected by Project Vote Smart, we assess the spatial locations of pairs of candidates in hundreds of US House races. We leverage the similarities in the questions that appeared on both sets of surveys to generate joint estimates of candidate and citizen ideology.
Across both the 2008 presidential and 2010 midterm elections, we find, first, robust and substantial evidence that vote choice in congressional elections is strongly associated with the relative positions of the candidates. Even in these lower information and down-ballot elections, voters tend to support candidates whose issue positions most closely match their own views. Second, while partisans are strongly biased toward their copartisan candidate, vote decisions among partisans and Independents are both strongly responsive to candidate positioning. Third, though ideological voting is strongest in competitive elections, candidate positions are also strongly associated with vote choice even in relatively uncompetitive districts. And fourth, increased levels of campaign spending are associated with increased reliance on spatial proximity, yet disparities in campaign spending between candidates attenuate the importance of ideology. In sum, these findings revise traditional understandings of the role played by ideology in congressional elections and shed new light on how electoral outcomes reflect public preferences.
Ideology and Congressional Elections
Scholars widely agree that candidates choose platforms that are responsive to the ideological preferences of the constituents they hope to represent. Theoretical models of electoral competition (Downs Reference Downs1957; Enelow and Hinich Reference Enelow and Hinich1984; McCarty and Poole Reference McCarty and Poole1998; Adams et al. Reference Adams, Merrill III, Simas and Stone2011) predict that congressional candidates will choose some ideological position that maximizes their chances of winning elections (McCarty and Poole Reference McCarty and Poole1998; Adams et al. Reference Adams, Merrill III, Simas and Stone2011). Consistent with this expectation, empirical research finds a high degree of correspondence between the preferences of a district and the candidates that seek to represent them. Candidates’ platform choices are responsive to district presidential vote shares (Ansolabehere, Snyder and Stewart Reference Ansolabehere, Snyder and Stewart2001a; Burden Reference Burden2004), incumbent members of Congress receive electoral penalties for ideologically extreme roll call voting records (Canes-Wrone, Brady and Cogan Reference Canes-Wrone, Brady and Cogan2002), and candidates are motivated to appeal to their primary electorates (Brady, Han and Pope Reference Brady, Han and Pope2007).
The basic Downsian proximity model, upon which models of candidate competition are based, assumes that citizens support the candidate whose campaign platform most closely reflects their underlying preferences.Footnote 1 Models of sincere voting behavior in two-candidate elections share the key maintained hypothesis that citizens are more likely to vote for a particular candidate as proximity increases between the two.Footnote 2 More precisely, proximity models of vote choice posit a decision rule whereby citizens use policy congruence to choose which candidate to support. A voter supports the Republican candidate if the Republican candidate’s platform is closer to the citizen’s ideal point than the Democratic candidate’s platform, and supports the Democratic candidate if the Democrat’s platform is closer to the citizen’s ideal point than the Republican candidate’s platform.Footnote 3 This intuition can be formalized as follows:
 $$\eqalignno{ & \:{\rm Vote}\;{\rm for}\;{\rm Republican}\;{\rm if}\;\:\,\mid \! x_{{ij}} \,{\minus}\,x_{j}^{D} \!\mid \,\gt\,\mid\! x_{{ij}} \,{\minus}\, x_{j}^{R} \!\mid \cr & \:{\rm Vote}\;{\rm for}\;{\rm Democrat}\;{\rm if}\;\:\,\mid \!x_{{ij}} \,{\minus}\, x_{j}^{D} \!\mid \,\lt \,\mid \!x_{{ij}} \,{\minus}\, x_{j}^{R} \!\mid , $$
where i and j index citizens and electoral districts, respectively, x denotes the ideal points or platforms of citizens and candidates, and the superscripts D and R indicate the partisanship of the candidate in electoral district j. The quantity
 $$\,\mid\! x_{{ij}} \,{\minus}\, x_{j}^{D} \! \mid\!\! \, {\minus}\,\! \mid \! x_{{ij}} \,{\minus}\,x_{j}^{R}\! \mid $$
characterizes the Republican candidate’s proximity advantage relative to the Democratic candidate, where positive values indicate that the Republican candidate is more proximate to the voter than the Democratic candidate, and negative values indicate that the Democratic candidate is more proximate to the voter than the Republican candidate. In a probabilistic model of vote choice, the probability a voter i will support the Republican candidate increases in the value of this quantity.
But though the literature is clear that ideological positioning is at or near the top of the electoral calculus used by candidates, most scholarly accounts of behavior in congressional elections discount or reject the applicability of the proximity model for vote choice. The Michigan school emphasizes the importance of party identification (Campbell et al. Reference Campbell, Converse, Miller and Stokes1960; Miller and Stokes Reference Miller and Stokes1963), which operates as a “standing decision” in which voters support copartisan candidates unless there is a strong reason to do otherwise (Key Reference Key1959). Other scholarship argues proximity voting is not possible in congressional elections due to most voters’ lack of information about the candidates’ issue positions (e.g., Berelson, Lazarsfeld and McPhee Reference Berelson, Lazarsfeld and McPhee1954; Campbell et al. Reference Campbell, Converse, Miller and Stokes1960). Most people have poor knowledge of their representatives’ policy positions (Hurley and Hill Reference Hurley and Hill1980) and do not pay close attention to issues discussed during the campaign (Dalager Reference Dalager1996). A related perspective suggests that ideological voting does not occur in congressional elections because most citizens lack well-defined ideological views in the first place (Converse Reference Converse1964; Zaller Reference Zaller1992). According to this view, voters cannot relate their views to the candidates’ if they possess no views of their own.
The uncompetitiveness of most congressional races casts additional doubt on the proposition that congressional vote choice is structured by ideological proximity. In uncompetitive electoral environments, the dominant candidate’s “advantages in skill, name recognition, campaign resources, and stylistic fit with the district tend to overwhelm voters” ideological considerations’ (Burden Reference Burden2004, 213). Alternatively, the unequal distribution of resources in most electoral campaigns could distract most voters from a sober consideration of the candidates’ issue positions. In addition, the extensive work on the incumbency advantage (e.g., Erikson Reference Erikson1971; Cox and Katz Reference Cox and Katz1996; Ansolabehere, Snyder and Stewart Reference Ansolabehere and Jones2000) suggests that the force of incumbency may lead voters to support a popular incumbent even when the incumbent’s policy views conflict with citizen preferences.
The voluminous literature on campaign spending suggests that campaign finance overwhelms the importance of ideology in influencing vote choice in congressional elections.Footnote 4 Though most of this research does not focus on how spending affects individual voting decisions (Jacobson Reference Jacobson1990 is an important exception), vote choice could be based largely on which candidate spends the largest amount of money and thus has the highest level of name recognition. Alternatively, spending could be used to obfuscate one’s issue position (or that of the opponent), misinform or mislead the public, or shift the public’s focus to other, non-policy attributes of the candidates.
On the whole, then, existing accounts implicate plenty of factors in vote choice in congressional elections, but the ideological content of the competing candidates’ platforms do not play a prominent role in these explanations. The available empirical evidence appears to support this claim (see e.g., Kinder Reference Kinder1998). Most models of candidate competition that assume sincere behavior by voters, however, rely on the maintained hypothesis that citizens choose candidates according to ideological proximity (Downs Reference Downs1957; Enelow and Hinich Reference Enelow and Hinich1984). Though previous work has examined the aggregate relationship between candidate (Ansolabehere, Snyder and Stewart Reference Ansolabehere, Snyder and Stewart2001a; Burden Reference Burden2004) and legislator (Canes-Wrone, Brady and Cogan Reference Canes-Wrone, Brady and Cogan2002) ideology and general election performance, direct tests of this maintained hypothesis at the individual level have largely eluded empirical research. While the findings from these studies are compatible with our theoretical perspective, this literature does not directly assess the ideological distance between districts and legislators, nor does it establish what factors may condition the importance of spatial proximity across electoral contexts or among individuals. This paper, therefore, represents an important contribution to the literature on elections and spatial voting because we directly model the locations of individual citizens and both candidates, enabling us to directly evaluate the ideological distances between voters and candidates and compare these distances with vote choices.
In studies most similar to ours, Jessee (Reference Jessee2009, Reference Jessee2010, Reference Jessee2012) finds strong evidence that citizens do in fact cast votes for presidential candidates that correspond well with proximity theory. However, whether these results apply similarly to congressional elections is less certain. Presidential contests last for months or years, and even disinterested political observers are likely to have some idea of where the presidential candidates stand on the major issues of the day. The lower salience and information levels in congressional races, their lack of competitiveness, the ability of incumbents to target distributive benefits to one’s home district, all suggest that ideology and proximity voting may not play significant roles in congressional voting behavior.
In this paper, we examine how and when congressional vote choice is influenced by ideological proximity voting. We use the concept of spatial bias (Persson and Tabellini Reference Persson and Tabellini2000; Adams Reference Adams2001; Adams, Merrill and Grofman Reference Adams, Merrill and Grofman2005; Jessee Reference Jessee2009; Jessee Reference Jessee2010) to examine how the factors identified by previous scholars condition the impact of ideological proximity in congressional elections. In particular, we examine how the individual-level and contextual-level factors noted above either attenuate or augment the relationship between ideological proximity and a voter’s support for a candidate. So doing, we leverage both the rich empirical literature on congressional elections and theoretical models of electoral competition to better understand when elections more effectively communicate the public’s preferences. Table 1 summarizes the hypotheses derived from existing literature about how the factors cited above affect the importance of ideological proximity in congressional elections.
Expected Relationships Between Ideological Proximity and Individual-Level and Contextual Factors

Empirical Tests of Proximity Voting
The requirements for a test of proximity voting in congressional elections can be compared with a three-legged stool. We need data on the policy preferences of voters, incumbents, and challengers, and these measures need to be in a common scale. Existing approaches fall short in one way or another. Ansolabehere, Snyder and Stewart (Reference Ansolabehere, Snyder and Stewart2001a) and Burden (Reference Burden2004) have same-scale data on both candidates, but not voters. Bonica (Reference Bonica2013) generates high-quality common space estimates of candidates and donors using campaign finance data, but the donor estimates do not characterize a representative sample of voters, nor are contributions linked explicitly to vote choice.
Research that characterizes a common ideological space for citizens and legislators enables scholars to test claims about representation (Gerber and Lewis Reference Gerber and Lewis2004; Bafumi and Herron Reference Bafumi and Herron2010; Warshaw and Rodden Reference Warshaw and Rodden2012), but does not provide information about the losing candidates in congressional races and thus does not permit tests of proximity voting. For all the work done in estimating latent preferences of elected political actors, very little has been done to examine the entirety of campaign platforms that congressional candidates present to voters—and thus fully characterize the electoral choices that are modeled in spatial theory. The reason is simple: while roll call data exist for candidates who eventually win, no similar record of policy preferences systematically exists for losing candidates. The electoral platforms for the latter remain a black box.
Yet even if we were to obtain good measures of candidate preferences, and the use of survey instruments resulted in perfect estimates of respondent preferences, only weak comparisons could be made between the two. The most painful limitation is that they cannot be compared with each other directly on the same scale. Responsiveness in representation could be assessed (Clinton Reference Clinton2006), but not congruence. Nor could proximity voting be evaluated, as no ideological distances between voters or candidates can be constructed.
The main tack to measuring both candidates and voters on the same scale relies on self-reported ideology and survey respondents’ perceptions of candidate ideology (Erikson and Romero Reference Erikson and Romero1990; Alvarez and Nagler Reference Alvarez and Nagler1995; Merrill and Grofman Reference Merrill and Grofman1999). However, these measures are likely to be extremely noisy. A measurement error approach (Achen Reference Achen1975; Ansolabehere, Rodden and Snyder Reference Ansolabehere, Snyder and Stewart2008; Benoit, Laver and Mikhaylov Reference Benoit, Laver and Mikhaylov2009) can address the noise issue but has no bearing on the common scale problem. Self-reports are also likely to be systematically biased (Conover and Feldman Reference Conover and Feldman1982) because survey respondents “understand the ‘same’ question in vastly different ways” (Brady Reference Brady1985) and may disagree about what it means to be “liberal,” “moderate,” or “conservative.” Stone and Simas (Reference Stone and Simas2010) and Buttice and Stone (Reference Buttice and Stone2012) present a novel extension to this approach by asking experts to place the congressional candidates on the standard seven-point ideological scale, which are then aggregated and compared with survey respondents’ self-reports. This approach still assumes that survey respondents used the seven-point scale in a common way and that experts’ and individuals’ perceptions of the ideological continuum describes a common space.
We address these challenges by combining large-scale survey data with novel data on the platforms chosen by both winning and losing candidates in a large sample of US House races in 2008 and 2010. We estimate candidates’ platforms and citizens’ preferences using scores of policy-based questions that were publicly answered (by candidates) or appeared on public opinion surveys (for citizens). Specifically, we adopt the framework of Shor and McCarty (Reference Shor and McCarty2011), which uses questions from Project Vote Smart’s candidate surveys. We exploit the similarities between these surveys of legislative candidates and items found in two large surveys as a solution to the challenges in studying the spatial model. Crucially for our purposes, many identical or otherwise substantially similar questions appeared in each data source. Thus, leveraging these similarities across altogether different data sets, we generate joint estimates of candidate and citizen ideology. Treating citizens as if they were legislators, we use standard ideal point estimation techniques to derive spatial location parameters for constituents and candidates jointly. To our knowledge, this is the most comprehensive study to date that jointly characterizes preferences between the public and candidates. By linking together survey respondents and their local congressional candidates, then, we examine the extent to which spatial proximity between candidates and voters is associated with citizens’ voting decisions. In the next section, we detail that data collection and bridging effort.
Data and Methods
Individual-Level Data
We employ data from two surveys: our module in the 2008 Cooperative Campaign Analysis Project (CCAP) (Jackman and Vavreck Reference Jackman and Vavreck2010), and the common content of the 2010 Cooperative Congressional Election Study (CCES). The CCAP module was administered to over 4200 respondents, while the 2010 CCES included data for over 55,000 respondents. Using these surveys in combination enables us to evaluate vote choices in hundreds of US House elections. Both surveys included large batteries of policy-oriented questions, which we use to characterize citizen preferences using a similar approach as that found in Ansolabehere, Rodden and Snyder (Reference Ansolabehere, Snyder and Stewart2008). Moreover, the combination of these two surveys enables us to explore whether and how proximity voting varies across presidential and midterm election cycles.
We include those respondents from districts in which we have data for both major party candidates. This focuses our attention on a smaller subset—although still quite substantial—of the total number of respondents in these surveys. Though the races included in our sample do not comprise the entire universe of election contests in any electoral year, we find that these districts are quite representative of all contested races. In no year do districts in the sample differ in significant ways on major political and demographic variables (the online appendix has these detailed comparisons).
Both surveys contained large batteries of policy-oriented questions that we use to characterize the ideological locations of the survey respondents.Footnote 5 This approach avoids problems with projection because the policy questions on the survey generally concern the major policy issues—for instance, abortion, same-sex marriage, and health care—and it seems unlikely that respondents adopt the issue position of their favored local House candidate on such significant issues. Virtually all of the policy-oriented questions on the CCAP and CCES were presented in dichotomous format. The sample sizes and the number of policy-based questions for each survey are summarized in Table 2.Footnote 6
Sample Sizes for Survey Respondents, House Candidates, and Policy Preference Questions

Note: The 2008 survey combined samples from March 2008 with 76 NPAT questions (all bridge questions by designed), and two separate September 2008 samples with 15 and 103. Results are robust to dropping the 15 question sample.
CCAP=Cooperative Campaign Analysis Project; CCES=Cooperative Congressional Election Study.
We use the National Political Awareness Test (NPAT) to characterize candidates’ electoral platforms. This survey is administered each electoral cycle to state and federal candidates by the non-partisan Project Vote Smart. The questions asked by the NPAT cover a wide range of policy matters, including national security, social issues, fiscal policy, environmentalism, and many more.Footnote 7 Virtually all of these questions present binary choice response options ideal for scaling. The other major advantage of the NPAT survey is that it includes responses from losing challengers, who do not compile subsequent roll call voting records. We describe the details of the candidate sample in Appendix A.
These measures of candidate platform locations correspond quite strongly with other related measures. Our incumbent scores correlate with purely roll call-based ideal points in the 0.90 range. The real test is in the challenger scores for whom far less information is available. We compared our challenger scores with those from Hollibaugh, Rothenberg and Rulison (Reference Hollibaugh, Rothenberg and Rulison2013), who estimates their ideology using the scaling procedure from Aldrich and McKelvey (Reference Aldrich and McKelvey1977) using survey respondents’ estimates of candidates’ positions. The correlation between the two challenger measures is 0.69 for 2008 (the only year of overlap). Bonica (Reference Bonica2013) uses campaign finance data and a correspondence analysis estimation technique to derive ideal point estimates for both incumbents and challengers. The correlation between the two challenger measures is 0.75 for 2008, and 0.88 for 2010. The very high correlations with other measures that use entirely different data sources lends confidence to our assessment of platform locations.
Bridging
We use questions that appear on both the surveys and candidate questionnaires to generate a common ideological space for both voters and candidates. The bridging enterprise is simplest for the 2008 CCAP, whose survey instrument we wrote ourselves. We specifically asked our respondents exact replicas of questions from the NPAT survey. Moreover, respondents were asked many dozens of these questions that were under our direct design. In contrast, for the 2010 CCES, we use the substantive similarities between the survey items that appear on the candidate and constituent surveys to generate a common space. Other recent and related work has adopted a similar bridging strategy. For example, Tausanovitch and Warshaw (Reference Tausanovitch and Warshaw2013) use both identical and near-identical policy preference questions to bridge across many of these same surveys.
Questions that are unique to either the candidate or voter surveys do not aid in the bridging enterprise, but they do help us recover more precise estimates of preferences of these actors. The large number of items survey respondents answered ensures that their ideal points are estimated with a high degree of precision, especially compared with other recent work using similar approaches.Footnote 8 We employ dozens of such questions for respondents and candidates.
Estimation
In generating measures of citizen and candidate locations, we follow the approach used in Jessee (Reference Jessee2009, Reference Jessee2010) and other similar work. Ideal points are estimated using a Bayesian item response model (Jackman Reference Jackman2000; Martin and Quinn Reference Martin and Quinn2002; Clinton, Jackman and Rivers Reference Clinton, Jackman and Rivers2004; Jackman Reference Jackman2004), in which the model assumes that candidate and citizen preferences are characterized by quadratic utility functions with normally distributed errors, and that these errors are independent across both individuals and roll calls.Footnote
9
Each individual i decides whether to express support for (y
ij
=1) or opposition to (y
ij
=0) each survey item j. This specification results in a probit model,
 $$P\,(y_{{ij}} \, {\equals}\, 1)\, {\equals}\, (\beta _{j} \,x_{i} \, {\minus}\, \alpha _{j} )$$
, where β
j
is an item discrimination parameter that indicates how well item j distinguishes liberals and conservatives, α
j
the item difficulty parameter that describes the location of a respondent who is indifferent between supporting and opposing the proposal in item j, and x
i
corresponds to candidate or citizen i’s ideal point. The joint density of latent ideology and all model parameters α
j
, β
j
, and x
i
are estimated from the data.Footnote
10
For each respondent survey, we estimated unidimensional ideal point models using the survey data for both candidates and constituents. The estimated ideal points appear to characterize candidate and citizen preferences quite well. The overall classification success as well as the aggregate proportionate reduction in error (APRE)Footnote 11 for the joint estimation are quite comparable with that of Congress. Moreover, the improvement in fit afforded by a second dimension is minimal, and in common with recent work we henceforth rely on a single dimension.
A key assumption for the bridging enterprise to work is that respondent and candidate issue positions lie on a common dimension. To evaluate the reasonableness of this assumption, we adopt a technique from Jessee (Reference Jessee2009). We conduct two separate analyses for each of the two surveys. In the first, we scale individual respondents alone, and then compare them with estimates from the joint respondent–candidate scaling. In the second, we scale candidates alone, and then compare them with the joint scaling estimates. If candidates’ positions were structured very differently from those of individuals, we would expect attenuated relationships between scores from the two estimations. In fact, however, the scores are nearly identical: the average correlation between the two is above 0.98 for candidates, and above 0.96 for respondents; nearly exactly what Jessee (Reference Jessee2009) finds. In combination, these checks provide confidence that we have appropriately characterized the preferences for both candidates and constituents, and that these measures for both sets of actors can be directly compared.
Evaluating the Common Space Estimates
Before proceeding, we assess the relationship between our estimated common space ideal points for individuals with other indicators widely used to measure citizen preferences—namely, self-reported ideology and partisanship. While we expect there to be some relationship between these measures, we anticipate that these relationships are far from perfect. After all, our key claim in generating these estimates is that the use of dozens of policy items to generate measures of citizen ideology allows us a more unobstructed and error-free view of citizens’ preferences. As such, we would expect that the correlations between our measures and other more widely used indicators are attenuated due to increased measurement error in the former set of variables.Footnote 12 Indeed, the average correlation of our ideal points with a three-item party identification question is 0.61, and with the five-item ideological self-placement question at 0.60.
Descriptively, the common space estimates comport well with basic expectations about how preferences are distributed within the electorate, among candidates, and in Congress. Examining candidates elected to the 111th House (using the 2008 NPAT data), for instance, we find that the candidate distribution is bimodal while the distribution of voter preferences is unimodal. There is also considerably more overlap between the two parties in the population, and the tails are fatter.
As a final check before we turn to our analysis of proximity voting, we validate our common space ideal point estimates in standard models of vote choice. In particular, we examine how well our new measures of citizen ideology perform in predicting a vote for the Republican congressional candidate in the respondent’s district in the election year in which they were surveyed. The results show that our measure of issue-based ideology vastly outperforms self-identified ideology and rivals partisanship in explaining congressional voting decisions. Thus, even in congressional elections where information is considerably poorer on the issues, ideology—properly measured—is substantively important in individual voting decisions, even relative to partisanship. This was obscured with the more traditional measure of ideology.
Yet such models, while suggestive of the utility of better ideological measures, miss something major. Measurement error is the lesser problem for our measures. The larger one, which ideological indices cannot do much about, is the common scale problem. They do not incorporate any information about the ideology of the candidates and thus these models do not allow us to examine proximity voting. We now turn to those tests.
Empirical Strategy
Our common space estimates for candidates and citizens enable us to characterize the spatial proximity between each respondent and the pair of House candidates in her district. Proximity voting predicts that the probability that a citizen supports the Republican candidate increases in the proximity advantage held by the Republican candidate relative to the Democratic candidate. Or, returning to the formalization we introduced above, the probability of a Republican vote should increase as
 $$\,\mid \! x_{{ij}} {\minus}x_{j}^{D} \!\mid \! \,{\minus}\! \,\mid \! x_{{ij}} \, {\minus}\, x_{j}^{R} \! \mid $$
gets larger. For negative values of this quantity, we expect voters to be more likely to support the Democratic candidate, and we expect voters to be more likely to support the Republican candidate for positive values.
The dependent variable is whether respondents reported voting for the Republican House candidate. From the formalization above, we constructed a variable, Republican spatial advantage, which characterizes the extent to which the Republican candidate is more spatially proximate to the voter than the Democratic candidate. We constructed these variables using both linear and quadratic loss functions to characterize voter utilities, and found that both characterizations yielded identical results. For ease of presentation we present the results using the linear loss characterization. Thus, to the extent that spatial proximity plays a role in vote choice, we expect coefficient estimates for Republican spatial advantage to be positively signed.
We characterize the level of electoral competitiveness with an indicator for whether the Cook Political Report characterized each congressional election as a “toss-up” race in the report issued closest to September 1 of that year.Footnote 13 We also collected data on campaign spending by the campaigns from the Federal Election Commission (FEC). Using the FEC data, we calculated the level of total spending (in millions of nominal dollars) and the degree of spending parity, which is measured by the absolute value of the difference between the Republican candidate’s share of district spending and 0.50. If both campaigns spent similar amounts of campaign funds, this variable would have a value close to 0; however, as one candidate enjoys a spending advantage over the other, this variable increases, to a maximum of 0.50.Footnote 14
To examine how electoral competitiveness and campaign spending condition the importance of spatial proximity, we estimate a logistic regression of vote choice on Republican spatial advantage, each of the indicators for these factors, and the interaction between each of these factors and Republican spatial advantage. If congressional voters make decisions using the proximity rule, then we expect the coefficient for Republican spatial advantage to be positive and large in magnitude. The signs on the interaction terms, therefore, characterize the extent to which these factors strengthen or attenuate the relationship between spatial proximity and vote choice. For instance, positive values of the interaction term between Republican spatial advantage and the toss-up variable would indicate that spatial proximity is more strongly associated with vote choice in competitive elections, while negative values would indicate that the association between spatial proximity and vote choice decreases in more competitive elections. In all models, we include controls for partisanship and the incumbent’s partisanship (+1 if Republican incumbent;−1 if Democratic incumbent; 0 if open seat). We used survey weights so the results are generalizable to the US population. To account for intra-district correlations in the error terms, we clustered all standard errors on congressional districts.
Results
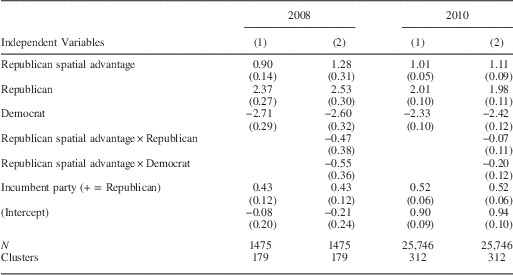
We begin first by examining voters’ use of spatial proximity in congressional elections. To do so, we estimated a simple model of vote choice as a function of Republican spatial advantage and controls for respondent and incumbent partisanship. We then examined to what degree spatial proximity is conditioned by partisanship by interaction Republican spatial advantage with respondent partisanship.Footnote 15 The results for both 2008 and 2010 are shown in Table 3.
Spatial Proximity, Partisanship, and Vote Choice in House Elections

Note: Entries are logistic regression coefficient and standard errors, clustered by congressional district. The dependent variable is a reported vote for the Republican congressional candidate. Data are weighted to national population parameters.
The estimates in column (1) are from a simple model that contains only Republican spatial advantage and measures of respondent and incumbent partisanship as covariates. Even when controlling for these partisan factors, however, the results show that Republican spatial advantage is strongly and positively associated with vote choice. Respondents with spatial locations more proximate to the Republican candidate (relative to the Democratic candidate) are increasingly more likely to have voted for the Republican candidate. At the same time, Republican identifiers are substantially more likely than either Democrats or Independents (the omitted category) to support Republican candidates, and Democratic identifiers are substantially more likely than either Republicans or Independents to oppose Republican candidates. Though the coefficients are not directly comparable across models, note that the relationship between the spatial advantage predictor and the other predictors is quite consistent across years.
The models in column (2) explore these relationships in greater detail to examine the extent to which congressional vote choices exhibit partisan bias. Republican spatial advantage again is positive and statistically significant in both election years, indicating that Independent voters (the omitted category) make voting decisions that are strongly associated with spatial proximity vis-à-vis the candidates. The coefficients for the interaction between Republican spatial advantage and the indicators for Republican and Democratic identifiers, however, are all negative across both election years, suggesting that both Republicans and Democrats make voting decisions that are less sensitive to relative changes in the positioning of the candidates. However, only the coefficient on the Democratic interaction is borderline statistically significant (at p<0.10).
Interestingly, then, the results produce less solid evidence of partisan bias in congressional elections than other researchers have found in the context of presidential elections (Jessee Reference Jessee2009; Jessee Reference Jessee2010). This finding is also somewhat surprising because partisans are usually regarded as more politically informed and interested than non-partisans, and thus partisans may have been expected to exhibit greater responsiveness than Independents. At the same time, however, we note that, consistent with findings shown in Joesten and Stone (Reference Joesten and Stone2014), partisans vote for the more proximate candidate at greater rates than Independents.
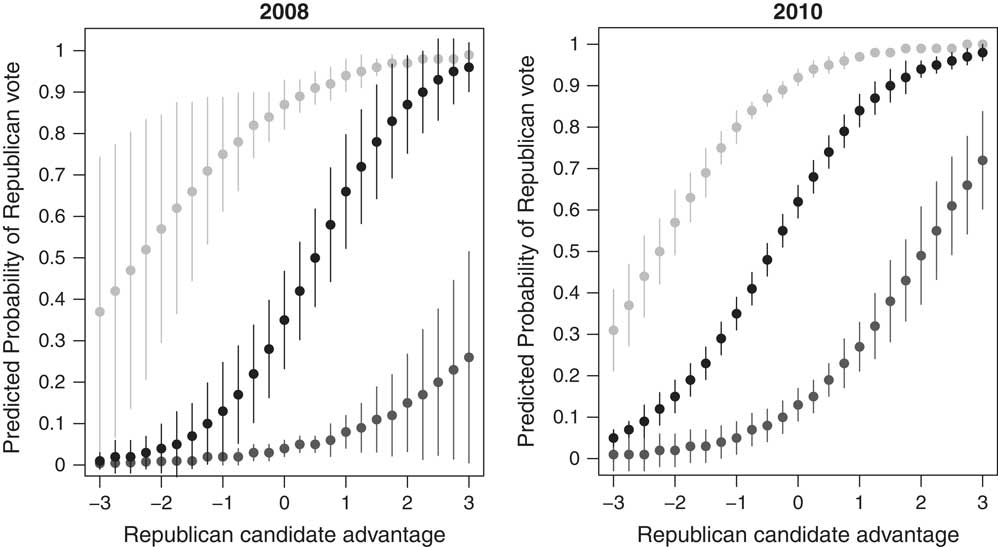
The substantive results of the models shown in column (2) above are displayed in Figure 1. The plotted curves show the predicted probability of voting for the Republican congressional candidate over the range of values of Republican spatial advantage. Republican identifiers are plotted in red, Democratic identifiers are plotted in blue, and Independents are plotted in black. The dashed lines show the 95 percent confidence intervals. Although the sample sizes are quite different across the two election years, resulting in much larger confidence intervals for 2008 than for 2010, the substantive patterns are quite similar. Republican identifiers are more likely than Democrats and Independents to vote for the Republican House candidate across the entire range of values of Republican spatial advantage, and Democratic identifiers are more likely than Republican and Independents to vote for the Democratic House candidate for any value of Republican spatial advantage. Independents, meanwhile, appear to make voting decisions that are most consistent with the proximity model. Though the intercept shifts for Independents between 2008 and 2010—reflecting the heavy Republican wave in the 2010 midterm elections—the slope is considerably steeper for Independents than it is for either partisan group, indicating that Independents’ vote choices are most responsive to differences in the relative ideological positions of the candidates. For instance, compare the predicted probabilities of supporting the Republican candidate in the 2010 election among Republicans, Democrats, and Independents. When the Republican candidate’s spatial advantage changes from −1 to +1, the predicted probability of voting for the Republicans increases from about 0.87 to 0.98 among Republican identifiers, and from 0.08 to 0.36 among Democratic identifiers. Among Independents, however, the predicted probability increases from 0.46 to 0.89. While it is the case that partisans and Independents both vote based on proximity, it is the latter that is of more interest, since they are more likely to switch their vote.Footnote 16 Note that the predicted probabilities show a starker difference between partisans and independents than what appears in Table 3, particularly for Republicans. In summary, the evidence is suggestive of a stronger relationship for Independents, but the number of observations of Independents relative to partisans does not give us enough power to make stronger claims.
Spatial proximity and partisan bias in congressional elections Note: Plotted points show the predicted probability of voting for the Republican House candidate across the range of values of Republican spatial advantage. Republican identifiers are shown in red, Democratic identifiers are shown in blue, and Independents are shown in black. The vertical lines show the 95 percent confidence intervals.
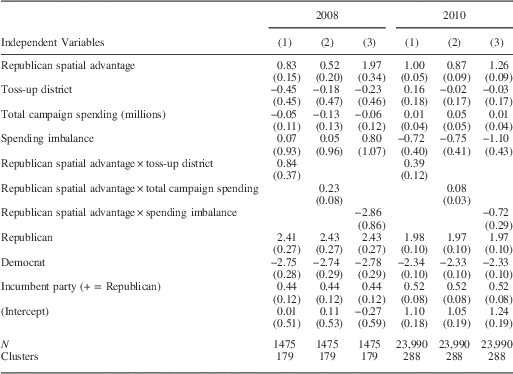
We next use this approach to study the extent to which electoral competitiveness and campaign spending conditions the importance of spatial proximity for vote choice.Footnote 17 For both 2008 and 2010, we estimate versions of the same models, in which we interact Republican spatial advantage with the competitiveness of the election (column 1), total spending in millions (column 2), and the imbalance between candidates in the amount of spending (column 3). The results are shown in Table 4.
Electoral Context, Spatial Proximity, and Vote Choice in Congressional Elections

Note: Entries are logistic regression coefficient and standard errors, clustered by congressional district. The dependent variable is a reported vote for the Republican congressional candidate. Data are weighted to national population parameters.
Recall first that the coefficients cannot be directly compared across models or years. However, the patterns are strongly consistent across the two different election years. Column (1) report results that focus on how electoral competitiveness conditions the use of spatial proximity. The main effect for Toss-up district is not statistically significant in either election year, indicating no systematic relationship between the level of electoral competitiveness and vote choice. However, in both election years the interaction term is positive and large in magnitude, indicating that the relationship between spatial proximity and vote choice increases in more competitive elections. This interaction term is statistically significant for 2010, but not for 2008; however, the considerably smaller sample size in 2008 is a likely factor.
Column (2) shows the results for how campaign spending conditions the use of spatial proximity for vote choice. Across both election years, the main effect of campaign spending is small in magnitude and indistinguishable from 0. However, when evaluating the interaction between Republican spatial advantage and campaign spending, we find consistent results across both election years. The coefficients for the interaction terms are both positive and statistically significant, or very nearly so. The findings here indicate that increased levels of total campaign spending strengthen the relationship between spatial proximity and vote choice. One potential explanation for this finding may be that increased levels of spending are associated with higher levels of information distribution. At the aggregate level, then, these findings suggest that higher levels of campaign spending may generate election outcomes that better reflect the views of voters.
Column (3) shows the results for whether parity in campaign spending conditions the use of spatial proximity. The coefficients on the interaction terms are negative and large in magnitude for both election years. These results indicate that greater disparities in campaign expenditures across competing candidates significantly reduces the association between spatial proximity and vote choice. Thus, while high levels of spending overall may increase the importance of spatial proximity, imbalances in which candidate spends campaign funds appears to have the opposite effect.
Across two election years, spanning both presidential and midterm electoral contexts, and while using different surveys, samples of House candidates, and methods of linking candidate and public preferences, we find that voters tend to support candidates whose platforms most closely resemble their individual policy preferences. Where these preferences come from, however, is less clear. Research on framing and priming suggests that voters may adopt the issue preferences of their preferred candidates. In an electoral system with strong parties where the top-of-the-ticket contest receives considerable attention, it is possible that these priming effects would also influence preferences and voting behavior in down-ballot contests. It seems improbable, however, that this would be the case among voters in US House races. Moreover, if it were the case, we might expect to see an even stronger relationship between issue preferences and candidate choice.
It is also worth discussing what the appropriate standard is for judging the results above. One null hypothesis could be that we would expect the slope for spatial advantage to be 0, because all Republican voters support Republican candidates, all Democratic voters support Democratic candidates, and Independent voters flip a coin between candidates. Indeed, this may have been a fairly accurate characterization at some period in American history, though it would seem to be less the case in contemporary American politics; the correlation between partisanship and ideology is extremely high, which suggests that partisan voting patterns are correlated with ideological voting patterns. Our results indicate that ideology is related to vote choice independent of partisanship, however, while Independent voters—pure Independents—do not appear to flip a coin when choosing candidates. Instead, their voting decisions are highly consistent with a simple proximity model of vote choice. Moreover, nearly 11 percent of our sample from the 2008 CCAP and 16 percent of our sample in the 2010 CCES cast ballots for a congressional candidate from party opposite to the presidential candidate they supported in 2008. In spite of the high correlation between partisanship and ideology, voters appear to make meaningful use of both criteria when casting ballots in congressional elections.
Discussion and Conclusion
Scholarship on US congressional elections exhibits disagreement about the role of ideology in election outcomes. Candidates are said to fine-tune their campaign platform to maximize their electoral chances, while behavioral studies of voters consistently de-emphasize the role of issues at the ballot box, especially for congressional elections, where voters are thought to be largely innocent of understanding where candidates stand. The confusion comes from trying to piece these two stories together: why would candidates be strategic in using issues that voters largely ignore?
Our findings help resolve this disagreement and show that spatial proximity has a statistically significant and substantively important association with vote choice in US House elections. Though our findings are consistent with Jessee (Reference Jessee2009, Reference Jessee2010), our congressional context constitutes a tougher test of the role of ideology in elections. The barrage of media attention and daily updates over the course of presidential campaigns imply that everyone who wants to learn something about the candidates can do so at little cost. But how often do voters get to witness a debate between House candidates? These races rarely make the New York Times, and such candidates are usually not among the guests included on Sunday morning political talk shows. Were there to be a federal election in which ideology matters little, House elections would be the prime suspect.
Though the decisions voters make in these elections are broadly consistent with the predictions of spatial voting models, our analysis uncovers evidence that several important factors—including partisanship, competitiveness, and campaign spending—do play a significant role in conditioning the strength of the relationship between spatial proximity and vote choice. At the individual level, we demonstrate that pure Independents make vote choices that are more consistent with spatial proximity than partisans. This is another surprising finding, given the large volume of research that casts doubt upon whether independents are “truly independent” and possess the knowledge and capacity to meaningfully discriminate between candidates.
We also find that proximity exerts a stronger influence on vote choices in more competitive races. This finding is reassuring given that competitive races could turn on a small number of pivotal voters’ decisions.
Finally, we present a novel set of findings regarding the effect of campaign spending on vote choice. Though many scholars and observers bemoan high levels of campaign spending, we find that campaign spending increases the association between citizen preferences and their candidate of choice. On the other hand, the association between proximity and vote choice is attenuated when campaign spending is highly unbalanced between candidates. High levels of campaign spending, then, might be desirable because it increases information flows (see also Coleman and Manna Reference Coleman and Manna2000) so long as campaign resources are distributed reasonably equitably across candidates.
The finding that the strength of proximity voting is correlated with more tightly contested elections has fascinating implications. First, in elections likely to be close, small vote shifts can shift electoral outcomes. This implies that the candidates in these contests, therefore, have increased incentives to advocate policies that reflect district preferences. Thus, these findings indicate that competitive elections may serve to strengthen the linkages between political elites and the mass public, precisely in the most competitive constituencies on which control of Congress frequently revolves.
Using our approach, future research could investigate additional influences, both on the individual and contextual levels, that are also associated with the extent to which voters make decisions based on policy congruence. Given the importance of information for the assumptions embedded in spatial models, additional research is necessary to better understand whether the relationships between citizen preferences and vote choices vary systematically with variation in information access across congressional districts. For example, variation in the competitiveness and quality of available media could conceivably moderate the ability of citizens to vote based on policy differences. Institutional differences across electoral contexts could matter as well, and some reforms might amplify or attenuate the ability of voters to consider issues more centrally. And given the importance of party heuristics, investigation is warranted into quantifying the degree to which the increasingly polarized nature of political parties has affected the use of proximity voting by citizens.
Our findings provide strong evidence for the association between voters’ preferences and candidate choice in congressional elections. Though voters may not be encyclopedias about the specific policy positions contained in candidate platforms, many of them do seem to be exposed to sufficient levels of information about the candidates to make reasonably informed decisions, or otherwise are adept at using heuristics that adequately inform their views of the candidates.