Introduction
Congenital X-linked dichromacy (red–green color vision deficiency) is characterized by the lack of functional red and green cone photoreceptors in the retina (protanopia and deuteranopia, respectively). It affects between 2 and 8% of males and 0.5% of females. In most cases, this is a result of unequal intergenetic recombination, whereby either the medium (M)- or the long (L)-wavelength sensitive cone opsin is not expressed. Dichromats therefore have a reduced dimension of color vision and require only two primaries to match any other color (Simunovic, Reference Simunovic2010). However, it is largely accepted that in most of the cases, the missing opsin type is replaced by the remaining one (i.e., M by L and vice versa) (Berendschot et al., Reference Berendschot, van de Kraats and van Norren1996; Kremers et al., Reference Kremers, Usui, Scholl and Sharpe1999). In some cases, the missing opsin may be replaced by a dysfunctional variant (Carroll et al., Reference Carroll, Neitz, Hofer, Neitz and Williams2004).
The intriguing question whether beyond its obvious disadvantages congenital dichromacy may also have perceptual advantages has been addressed by only a few studies, and mostly regarding visual acuity. Indeed, visual acuity was found to be enhanced in dichromats even when the missing opsin was replaced by a dysfunctional variant, and it was possible to determine that this advantage characterized multigene dichromats only (Jägle et al., Reference Jägle, de Luca, Serey, Bach and Sharpe2006). Dichromats have also been shown to perform as well as or better than trichromats in a task involving high temporal frequency stimuli, but not at low frequencies, where their performance is significantly weaker than that of trichromats (Sharpe et al., Reference Sharpe, de Luca, Hansen, Jagle and Gegenfurtner2006). Furthermore, protanopes and deuteranopes have been reported to be better than trichromats at breaking certain kinds of color camouflage that interfere with segregation based on texture (Morgan et al., Reference Morgan, Adam and Mollon1992). Almost all these findings have been explained in terms of the loss of L–M (red–green) opponency in dichromacy. In a similar vein, it has been tested whether color-defective observers show any achromatic parvocellular contrast sensitivity (CS) enhancement (Lutze et al., Reference Lutze, Pokorny and Smith2006). The authors applied parvocellular-selective stimuli and found no parvocellular contrast gain in color-defective observers, which is apparently against the assumption that dichromacy or anomalous trichromacy results in an enhancement of the luminance channel. However, it must be considered that this study involved only seven color-defective observers, and even these observers were divided into two groups. This way three anomalous thrichromats and four dichromats were compared with four normal trichromats, which—even though the study design and methodology were perfect—makes the results difficult to generalize.
In the present study, we sought to retest the hypothesis about achromatic CS enhancement in dichromacy with a larger sample of dichromats only and a different methodology.
Materials and methods
Participants
36 male volunteers participated in the study (n protanope = 15 n deuteranope = 11 n control = 10). Mean ages: 26.85 years (13–43 years, protanope); 27.61 years (14–46 years, deuteranope); and 29.44 years (21–37 years, control). Color-defective volunteers were recruited from the outpatients of the Department of Ophthalmology of the University of Szeged. Controls were recruited from the staff of the same institution. Only persons free of any other ophthalmological or neuro-ophthalmological condition were eligible for the study, while controls were required to be free of any ophthalmological or neuro-ophthalmological condition. The study design conformed to the tenets of the Declaration of Helsinki in all respects, and it was approved by the Ethics Committee of the Faculty of Medicine of the University of Szeged. All potential participants were provided information necessary for their informed consent (e.g., the ophthalmological procedures involved in the study, the total duration of all measurements, etc.), both in oral and written form. However, to minimize the potentially confounding effect of performance pressure, the exact purpose of the study (to investigate the link between dichromacy and CS) was explained only after the measurements, and CS measurement was not revealed as the target procedure until all measurements were finished. Those who agreed to participate were asked to give their written consent by signing an informed consent form.
General ophthalmological examination
All participants (both dichromats and controls) underwent a routine ophthalmological examination. The examination was carried out as per the Preferred Practice Patterns Guidelines of the American Academy of Ophthalmology (2010). Ishihara plates as screening for color deficiency were administered. The best corrected visual acuity (Snellen) of all observers was at least 1.0 (20/20).
Color vision testing
To those who proved to be color deficient according to the Ishihara plates, the Lanthony Desaturated D-15 test was administered to determine the type of deficiency. As the goal was to study X-linked dichromats only, people with tritan deficiency were not eligible. To differentiate between anomalous trichromats and dichromats, subject also underwent anomaloscopy (Heidelberg HMC). As a final step, protanopes and deuteranopes were selected from the entire tested population, and only they were recalled for CS testing.
CS testing
Static and dynamic CS was measured under photopic conditions (background luminance: 49.8 cd/m2) at nine spatial frequencies [0.5, 1.2, 1.9, 2.9, 3.6, 4.8, 5.7, 7.2, and 14.3 cycles/degree (c/d)] with a computerized test (Venus, NeuroScientific CorporationAQ1: Please provide the manufacturer details (city, state [two-letter postal code if USA] and country [other than USA]) for “NeuroScientific Corporation.”) in both controls and color-deficient subjects. Stimuli were achromatic luminance-contrast gratings with a sinusoidal luminance profile. Contrast was defined according to the Michelson formula [C = (L max − L min)/(L max + L min)]. In the dynamic condition, the pattern reversal rate was 8.56 Hz (17.2 rps). The display subtended a visual angle of 13° by 13°. Eye-display distance was 1 m. The maximum contrast was 70.7%. Stimuli were presented on a white monochrome CRT monitor. For the measurement of the contrast threshold at each spatial frequency, we used a method of adjustment. First, the contrast was set at 15 dB above the mean normal value. If the participant was unable to detect the grating at this contrast level, the contrast was further increased until they were able to detect the stimulus. The contrast level was then decreased stepwise by 3 dB every 5 s until the subject reported that the stimulus disappeared (descending method). Next, contrast was set at 15 dB below the threshold, and the contrast was increased stepwise by 3 dB every 5 s until the subject was able to detect the stimulus (ascending method). Left and right eyes were tested separately. The whole procedure was repeated three times for both eyes to obtain a mean contrast threshold at a particular spatial frequency. CS was defined as the reciprocal of the contrast threshold. Subjects were instructed to fixate a red spot in the middle of the screen throughout the test, their head was positioned in a stable ophthalmic head rest with forehead and chin support and a goggle frame, and fixation was continuously checked by the experimenter. While one eye was being tested, the fellow eye was covered.
Statistical analysis
As X-linked dichromacy is a condition affecting both eyes, data were analyzed at the level of the individual (Murdoch et al., Reference Murdoch, Morris and Cousens1998). In such conditions between eyes correlation is not a statistical concern, therefore, data from the two eyes of each participant were averaged, and these averages were analyzed by color vision status (control, deuteranope, and protanope). The Shapiro–Wilk test indicated that our data did not fit the normality criterion in all cases, whereby for comparisons, the nonparametric Mann–Whitney U test was applied. Statistical analyses were carried out with Statistica for Windows 11 (StatSoft). Level of significance was set at P < 0.05.
Results
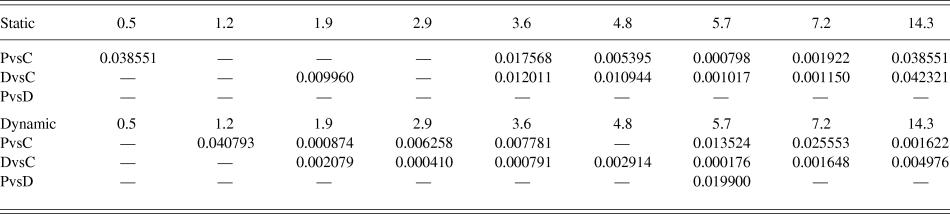
Results are summarized in Table 1. It is seen at a glance that both protanopes and deuteranopes had higher CS than controls, in both static and dynamic conditions, and especially at higher frequencies. It is also obvious that protanopes and deuteranopes do not differ to such an extent as either group differs from controls. The results of the comparisons (Table 2) support this first impression. In the static condition, both deuteranopes and protanopes exhibited significantly better CS than controls from 3.6 c/d upward. Deuteranopes seem to have significantly better CS than controls also at 1.9 c/d in the static condition, whereas for protanopes, a significant difference was found at the lowest examined spatial frequency (0.5 c/d). However, the significance level of this latter difference is quite close to the P < 0.05 limit (P = 0.04). No significant difference was found between the color-deficient observers under this condition. Comparisons of the static condition are shown in Fig. 1.
CS curves in the static condition. ●, control; ○, protanope; and ▼, deuteranope. Values are given as mean ± s.e.m. To keep the figure perspicuous, significance markings are not put, but the exact significance values are given in Table 2.

Descriptive statistics of the contrast sensitivities of the compared groups in the two conditions at the studied spatial frequencies

Differences between the means of the compared groups at the studied frequencies. Significance levels (P) are given as determined by the Mann–Whitney U test. P-values are given only at places where the difference was found to be significant (P < 0.05 or P < 0.01). P: protanope, D: deuteranope, C: control

Comparisons of the dynamic condition show a somewhat different picture: it is obvious at first glance that significant differences spread over a wider range of spatial frequencies. From 1.9 c/d upward, the advantage of color-deficient observers over normal controls is an almost undiminished tendency (except for 4.8 c/d in the case of protanopes). Protanopes also seem to have enhanced sensitivity at 1.2 c/d, but once again, the significance level here (P = 0.04) is rather close to the limit of significance. As for the comparison of the two color-deficient groups in the dynamic condition, significant difference was found at 5.7 c/d only (P = 0.02). Comparisons of the dynamic condition are shown in Fig. 2.
CS curves in the dynamic condition. ●, control; ○, protanope; and ▼, deuteranope. Values are given as mean ± s.e.m. To keep the figure perspicuous, significance markings are not put, but the exact significance values are given in Table 2.

In summary, these findings suggest that both protanopes and deuteranopes exhibit enhanced achromatic CS over a wide range of spatial frequencies, as compared with color normal observers. The observed enhancement in achromatic CS occurs predominantly at higher spatial frequencies in the static condition, whereas it is also present at lower spatial frequencies in the dynamic condition.
Discussion
The results of our study support earlier studies that found enhancement in various visual functions in X-linked color-defective individuals (Jägle et al., Reference Jägle, de Luca, Serey, Bach and Sharpe2006; Sharpe et al., Reference Sharpe, de Luca, Hansen, Jagle and Gegenfurtner2006) and also contradict the only known study that addressed almost exactly the same issue (Lutze et al., Reference Lutze, Pokorny and Smith2006). In this case, achromatic CS was found to be enhanced in dichromatic observers, especially at higher spatial frequencies.
Before discussing the results in terms of vision, we consider it important to address two issues: one is motivation and the other is age.
Motivation is always a potential source of error in psychophysics, and it is fairly difficult to assess differences in subjects’ motivation. In fact, we have made no attempt to measure that factor in this study, wherefore, it cannot be excluded that our measurements were influenced by it to some extent. However, the study was designed in a way to minimize performance pressure in any of the applied procedures, and the pattern of CS enhancement seems to be specific enough to guarantee that motivation did not have an overwhelming effect on our results. We have found no evidence in the literature to suggest that better motivation could result in anything else than general performance enhancement. What we have found is enhancement over part of the applied range of spatial frequencies, and even this depended on the testing condition. Such a dependence on stimulus parameters provides further support to the assumption that the difference is made by a bottom-up process not a top–down one.
Achromatic luminance CS does vary with age. However, based on what we found in a study of 152 healthy volunteers of 5–30 years of age (trichromats, same methodology), this should not be a confounding factor (Benedek et al., Reference Benedek, Janaky, Braunitzer, Rokszin, Keri and Benedek2010). In that study, spectacular development was observed between the ages 5 and 13 years, while the CS of 30-year-olds hardly exceeded that of 14-year-olds. All subjects of the present study were over 14 years of age, and the oldest of them was 46. Our experience and studies suggest that age does not influence CS in this range.
To sum this up, we consider it unlikely that our results were significantly influenced either by motivation or by age.
As the measurements were carried out under photopic conditions, it is assumed that the stimuli were processed predominantly by the parvocellular system. Midget cells, the retinal ganglion cells associated with the parvocellular system, can participate in both chromatic and achromatic vision. The same concentrically organized retinal and geniculate cell receptive fields feed two different circuits in striate cortex. One achromatic (L + M) with a large number of orientation selective neurons capable of high spatial resolution and the other chromatic (L vs. M) built up from the same center/surround organized midget-like cells. (Benardete & Kaplan, Reference Benardete and Kaplan1999; Gouras, Reference Gouras2013).
Generation of a chromatic signal in the red–green system is possible because of the L–M opponency. Midget ganglion cells have opponent receptive fields: where the center is L+ (excitatory), the surround will be M− (inhibitory) and vice versa. However, it is now widely accepted that this opponency is not cone selective, that is, both the center and the surrounding of these receptive fields receive both L and M input, and the resulting ratio of inputs determines the response profile of the cell (Solomon & Lennie, Reference Solomon and Lennie2007). This is important as a strictly cone-selective scenario would mean that in dichromacy, some cells would lose input to their receptive field center and some to their surround, which would also render luminance coding impossible. This is obviously not the case. Persons with congenital dichromacy have no color opponency in their receptive fields, but the center-surround organization of their receptive fields is intact. Such an L−/L+ or M−/M+ organization may not be optimal for chromatic coding, but it is still suitable for luminance coding.
Obviously, a key factor for the understanding of our observations regarding dichromacy is the postreceptoral signal transmitted toward the visual cortex. Jägle et al. (Reference Jägle, de Luca, Serey, Bach and Sharpe2006) propose that dichromats benefit from decreased chromatic noise in certain visual tasks. Chromatic aberration, the failure of the lens to focus all colors to the same convergence point on the retina, is a major source of chromatic noise. Longitudinal (axial) chromatic aberration causes wavelength-dependent defocus on the retina (Nathans et al., Reference Nathans, Piantanida, Eddy, Shows and Hogness1986), and at high spatial frequencies, it can modulate contrast signals conveyed toward the cortex. Transverse chromatic aberration causes phase shift between the signals of L and M cones. Both effects introduce noise in the luminance (L + M) channel, which is readily measurable (Forte et al., Reference Forte, Blessing, Buzas and Martin2006). The effect of axial aberration must be maximal in normal trichromats, as they have maximally responsive receptors for all the three main ranges of the visible spectrum (i.e., short, medium, and long wavelengths). It can be inferred, however, that in red–green dichromats, less noise and luminance modulation is generated, as their remaining cones (either L or M) will exhibit submaximal responses to either medium or long wavelengths. Given the wavelength-dependent defocus due to the axial aberration, response profiles of the same type of cones will be different at different points of the retina. This difference should generate noise in the pooled postreceptoral signal too, but to a smaller extent than in the trichromatic eye, as part of the spectrum has less effect on the remaining cones. We propose, therefore, that dichromats’ achromatic luminance CS may be higher because their luminance channel is less noisy than that of color normals. The high-frequency enhancement observed in both the static and the dynamic conditions support the hypothesis that part of the explanation might be the attenuation of chromatic noise due to axial aberration. It is important to emphasize, though, that this is only a working hypothesis, the confirmation or rejection of which necessitates further studies. Given the high interindividual spatial variability of the cone receptor mosaic (Hofer et al., Reference Hofer, Carroll, Neitz, Neitz and Williams2005), different dichromatic individuals might profit to different degrees from this noise attenuation, but the net result still appears to be enhanced sensitivity. A complex study applying CS assessment and high-resolution adaptive-optics imaging combined with retinal densitometry could possibly clarify the question, making it possible to determine a mean contrast enhancement across individuals as related to the spatial organization of the cone mosaic and longitudinal chromatic aberration.
As receptive fields in the brain are not genetically determined, but shaped by experience (e.g., Blakemore & Cooper, Reference Blakemore and Cooper1970; Rodman et al., Reference Rodman, Scalaidhe and Gross1993), it seems logical to infer that the enhanced luminance signal can bring about plastic changes in the cortex, which results in enhanced luminance contrast processing. It is possible, for instance, that as a result of these changes, a larger population of cortical neurons will be devoted to luminance processing in the high acuity channel and that would explain our findings of enhanced achromatic CS at high spatial frequencies. However, enhancement was observed also at the lower frequencies in the dynamic condition. An enhancement at low spatial frequencies apparently does not fit the preference profile of the parvocellular system. It has to be kept in mind, however, that even though the parvocellular system prefers details over dynamics, it does have a definite dynamic preference, peaking at 8 Hz (Benardete & Kaplan, Reference Benardete and Kaplan1999). Considering the above, we infer that the applied dynamic modulation [8.56 Hz (17 rps)] might just have been an optimal stimulus for the midget cells, and it might have enhanced CS also at lower spatial frequencies.
TheseAQ2: Please spell out “PC” (if any) in the sentence “These findings clearly contradict those of <u>Lutze et al. (2006)</u><u>Lutze et al. (2006</u><>L . ()</>. . ..” findings clearly contradict those of Lutze et al. (Reference Lutze, Pokorny and Smith2006) who concluded that there was no enhancement of achromatic processing as compensation for reduced chromatic processing in the PC-pathway system in color defectives. We suggest that this discrepancy may be related to the applied stimuli. The Lutze group used the pedestal paradigm (Pokorny, Reference Pokorny2011), which is a great paradigm for the differentiation between the magnocellular and parvocellular pathways. In this study, we utilized sinusoidal gratings, which are known to be ideal stimuli for the orientation-selective achromatic cells of the primary visual cortex. It might be hypothesized that it is these cells where the observed gain occurs, and that is why it could not be detected with the pedestal paradigm but readily observable with sinusoidal gratings. Furthermore, the Lutze group tested both anomalous trichromats and dichromats in a small number, which might also have interfered with the results.
In conclusion, given the magnitude of the difference and the number of observers involved, we propose that the enhancement of achromatic processing in X-linked dichromacy does exist, it is measurable by sinusoidally modulated luminance gratings, and it is possibly related to cortical plasticity related to attenuated chromatic modulation of the luminance channel.