





1. Introduction
Surface heating/cooling, as a flow control technique, has received much attention owing to its proved and perceived applications. In a supersonic boundary layer, spatially uniform heating/cooling was found to destabilise/stabilise the first Mack modes but stabilise/destabilise the second modes (Mack Reference Mack1975; Lysenko & Maslov Reference Lysenko and Maslov1984). Local heating/cooling has been considered to be more efficient if it is imposed at appropriate positions. The possibility of stabilising flow via a local heating strip centred near, or at upstream of, the lower branch of the neutral curve has been demonstrated experimentally by Dovgal, Levchenko & Timopeev (Reference Dovgal, Levchenko and Timopeev1990) and numerically by Kral et al. (Reference Kral, Wlezien, Smith and Masad1994). The findings were broadly confirmed by the linear stability analysis of the heating-modified base flow (Masad & Nayfeh Reference Masad and Nayfeh1992; Masad Reference Masad1995). Hypersonic boundary-layer stability on a cone with localised surface heating/cooling has been studied by Fedorov et al. (Reference Fedorov, Soudakov, Egorov, Sidorenko, Gromyko, Bountin, Polivanov and Maslov2015).
While steady heating/cooling influences transition by modifying the base-flow profile, time-periodic and streamwise localised surface heating/cooling has been employed to excite instability modes in a controlled manner (Corke & Mangano Reference Corke and Mangano1989). In particular, it may generate a mode with an appropriate amplitude and phase so as to cancel an oncoming wave whereby delaying transition. For incompressible boundary layers, this was demonstrated by the experiments of Liepmann, Brown & Nosenchuck (Reference Liepmann, Brown and Nosenchuck1982) and Liepmann & Nosenchuck (Reference Liepmann and Nosenchuck1982). Direct numerical simulations of transition control through excitation and cancellation of instability modes by time-periodic heating were performed by Kral & Fasel (Reference Kral and Fasel1991). A theoretical description was developed recently by Brennan, Gajjar & Hewitt (Reference Brennan, Gajjar and Hewitt2021) based on triple-deck formalism.
Classical triple-deck theory (Neiland Reference Neiland1969; Stewartson & Williams Reference Stewartson and Williams1969) has been extended to the boundary layer subject to local temperature disturbances. In the case of a two-dimensional  $O(1)$ temperature variation occurring on the triple-deck scale, the problem was formulated by Méndez, Treviño & Liñán (Reference Méndez, Treviño and Liñán1992) for a wall temperature jump, and the boundary layer was found to separate when the jump exceeds a critical value. Treviño & Liñán (Reference Treviño and Liñán1996) analysed how surface temperature disturbances of moderate intensity modify the growth rate of the instability using a perturbation approach. This perspective of local stability is however inappropriate because the length scales of the instability and the heating-induced mean-flow alteration are comparable. Instead the impact on instability should be accounted for by a local scattering approach (Wu & Hogg Reference Wu and Hogg2006; Wu & Dong Reference Wu and Dong2016). Lipatov (Reference Lipatov2006) developed asymptotic theories for three-dimensional surface heating elements with different length scales. The effect of heating is shown to be equivalent to that of a local roughness element. For heating on the triple-deck scale, Koroteev & Lipatov (Reference Koroteev and Lipatov2009, Reference Koroteev and Lipatov2012) obtained linear solutions analytically and nonlinear solutions numerically. The asymptotic theory has also been extended by Aljohani & Gajjar (Reference Aljohani and Gajjar2017a,Reference Aljohani and Gajjarb, Reference Aljohani and Gajjar2018) to investigate the impact of two- and three-dimensional heated roughness elements on subsonic and transonic boundary layers.
The present paper is concerned with spanwise-periodic streamwise-elongated surface heating and its effects on supersonic boundary-layer instability. Such a problem has not been investigated before although its counterpart for roughness arrays of this form in an incompressible boundary layer has been studied by Kátai & Wu (Reference Kátai and Wu2020), where a stabilising effect was identified for weakly three-dimensional lower-frequency instability modes. As will be shown, such a form of surface heating in supersonic boundary layers causes significantly different instability characteristics.
The rest of the paper is organized as follows. In § 2 the problem is formulated. We first derive the simplified mathematical system governing the three-dimensional streaky flow induced by surface heating. Under the assumption of Chapman's viscosity law, the similarity solution is then obtained and presented. In § 3 the stability of the streaky flow is considered, and we show that the instability is governed by a new triple-deck structure with the dynamics in the lower deck being fully compressible. The bi-global eigenvalue problem is reduced to a one-dimensional one in the spanwise direction, and the instability is shown to be controlled by the spanwise-dependent wall shear and temperature. The reduced eigenvalue problem is solved, and numerical results are presented in § 4 to highlight the main instability characteristics. A summary and conclusions are given in § 5.
2. Problem formulation
2.1. Heating elements on the triple-deck scale
We consider a supersonic boundary layer flow past a semi-infinite flat plate, on which an array of streamwise-elongated and spanwise-periodic heating elements is deployed, as is shown figure 1. The elements are centred at a distance  $L$ from the leading edge. First we introduce the dimensionless variables
 \begin{equation} \left.\begin{gathered} (x,y,z)=(x^*,y^*,z^*)/L,\quad (u,v,w)=(u^*,v^*,w^*)/U_\infty, \\ p=(p^*-p_\infty)/(\rho_\infty U_\infty ^2),\quad \rho=\rho ^*/\rho_\infty,\quad T=T^*/T_\infty,\quad \mu=\mu ^*/\mu_\infty, \end{gathered}\right\} \end{equation}
where  $(x,y,z)$ are Cartesian coordinates with the origin located at the centre of the elements,
 $(u,v,w)$ are the corresponding velocities,
 $p$,
 $\rho$,
 $T$ and
 $\mu$ denote the pressure, density, temperature and dynamic viscosity coefficient, respectively. We use an asterisk to indicate dimensional quantities and
 $\infty$ the quantities in the free stream. The Reynolds number
 ${\textit {Re}}$ and Mach number
 $M_\infty$ are defined as
 \begin{equation} {\textit{Re}}=\rho_\infty U_\infty L/\mu_\infty,\quad M_\infty=U_\infty/a_\infty, \end{equation}
with  $a_\infty$ being the speed of sound in the free stream. It is assumed that
 ${\textit {Re}}\gg 1$ in order to present the asymptotic descriptions of the heating-induced streaky flow and its viscous instability. The focus will be on
 $1< M_\infty <4.5$, in which the first mode plays a dominant role in transition.
Schematics of a streaky flow induced by an array of spanwise-periodic surface heating elements. The contours show the surface temperature distribution, where  $x^*$ and
 $z^*$ represent the streamwise and spanwise coordinates,
 $\lambda _z^*$ and
 $d^*$ denote the spanwise wavelength and streamwise extent of the heating elements, and
 $U_\infty$ the free-stream velocity.

We begin with a standard triple-deck structure whose streamwise and spanwise length scales are of  $O({\textit {Re}}^{-3/8}L)$. The asymptotic description of the flow induced by such a form of heating was presented by Lipatov (Reference Lipatov2006). It is convenient to use the rescaled coordinates
 \begin{equation} \{X,Z\} = \epsilon^{{-}3}\{x,z\},\quad \{y_1,y_2,y_3\} = \{\epsilon^{{-}3}y,\epsilon^{{-}4}y,\epsilon^{{-}5}y\},\quad \epsilon=Re^{{-}1/8}, \end{equation}
where  $y_1$,
 $y_2$ and
 $y_3$ are the local coordinates in the upper, main and lower decks, respectively. We assume that the wall temperature is varied by
 $O(1)$ through heating. The induced velocity field near the surface is of
 $O(\epsilon )$. Specifically, in the lower deck where
 $y_3=O(1)$, the dependent variables have the expansions (Lipatov Reference Lipatov2006)
 \begin{gather} \{u,w\} = \epsilon \{u_3,w_3\}+O(\epsilon^2),\quad v = \epsilon^3v_3+O(\epsilon^4), \end{gather}
 \begin{gather}p = \epsilon^2p_3+O(\epsilon^3),\quad \{\rho,T,\mu\} = \{\rho_3,T_3,\mu_3\}+O(\epsilon). \end{gather}
Substitution into the Navier–Stokes (NS) equations leads to the governing equations of the lower deck,
 \begin{gather} \frac{\partial \left(\rho_3u_3\right)}{\partial X}+ \frac{\partial \left(\rho_3 v_3\right)}{\partial y_3}+ \frac{\partial \left(\rho_3 w_3\right)}{\partial Z}=0, \end{gather}
 \begin{gather}\rho_3\left(u_3\frac{\partial u_3}{\partial X}+v_3\frac{\partial u_3}{\partial y_3}+w_3 \frac{\partial u_3}{\partial Z}\right)={-}\frac{\partial p_3}{\partial X}+ \frac{\partial}{\partial y_3}\left(\mu_3 \frac{\partial u_3}{\partial y_3}\right), \end{gather}
 \begin{gather}\rho_3\left(u_3\frac{\partial w_3}{\partial X}+v_3\frac{\partial w_3}{\partial y_3}+w_3 \frac{\partial w_3}{\partial Z}\right)={-}\frac{\partial p_3}{\partial Z}+ \frac{\partial}{\partial y_3}\left(\mu_3 \frac{\partial w_3}{\partial y_3}\right), \end{gather}
 \begin{gather}\rho_3\left(u_3\frac{\partial T_3}{\partial X}+v_3\frac{\partial T_3}{\partial y_3}+w_3 \frac{\partial T_3}{\partial Z}\right)=\frac{\partial}{\partial y_3} \left(\mu_3 \frac{\partial T_3}{\partial y_3}\right), \end{gather}
with the  $y$-momentum equation giving
 $\partial p_3/\partial y_3=0$ and the state equation
 $\rho _3T_3=1$, where we assume that the specific heat capacities are constant and the Prandtl number
 $Pr$ is unity. The matching and boundary conditions of the above system are
 \begin{gather} u_3\to \lambda_By_3,\quad w_3\to 0,\quad T_3\to T_B(0)\quad \text{as}\ X\to -\infty; \end{gather}
 \begin{gather}u_3=v_3=w_3=0,\ T_3=T_w(X,Z)\quad \text{at}\ y_3=0; \end{gather}
 \begin{gather}u_3\to \lambda_B(A(X,Z)+y_3),\quad w_3\to \frac{D(X,Z)}{\lambda_By_3\rho_B(0)},\quad T_3\to T_B(0) \quad \text{as}\ y_3\to \infty, \end{gather}
among which (2.10a,b) represents the matching with the unperturbed state upstream (and serves as the leading-order initial condition when elongated heating arrays are considered later). In (2.10a,b)–(2.12a–c),  $\lambda _B=0.3321T_B^{-1}(0)$ is the wall shear of the compressible Blasius flow,
 $T_B(y_2)$ and
 $\rho _B(y_2)$ are the corresponding temperature and density profiles, of which
 $T_B(y_2)$ is related to the velocity profile
 $u_B(y_2)$ via
 $T_B=1+(\gamma -1)M_\infty ^2(1-u_B^2)/2$ under the assumption that the unperturbed wall temperature takes the adiabatic value with
 $\gamma$ denoting the ratio of the specific heat capacities. These unperturbed flow quantities are evaluated at
 $x=0$, the ‘centre’ of the heating elements (and at
 $y_2=0$ if the argument is set to zero). The function
 $T_w(X,Z)$ represents the wall temperature imposed by the heating elements. The unknown functions
 $D(X,Z)$ and
 $A(X,Z)$ are introduced with
 $D$ satisfying
 $\partial D/\partial X=-\partial P/\partial Z$ and
 $A$ being the displacement function.
In the main deck, where  $y_2=O(1)$, we express the dependent variables as
 \begin{gather} u = u_B+\epsilon u_2+O(\epsilon^2),\quad \{v,w\} =\epsilon^2\{v_2,w_2\}+O(\epsilon^3), \end{gather}
 \begin{gather}p = \epsilon^2p_2+O(\epsilon^3),\quad \{\rho,T\} = \{\rho_B,T_B\} +\epsilon\{\rho_2,T _2\}+O(\epsilon^2). \end{gather}
Substitution of the above expansions into the NS equations leads to the equations governing the main-deck disturbance, and their leading-order solution can be found as
 \begin{gather} u_{2}=A(X,Z)\frac{\mathrm{d}u_B}{\mathrm{d}y_2},\quad v_{2}={-}\frac{\partial A(X,Z)}{\partial X}u_B,\quad w_{2}=\frac{D(X,Z)}{u_B\rho_B}, \end{gather}
 \begin{gather}p_2=P(X,Z),\quad T_{2}=A(X,Z)\frac{\mathrm{d}T_B}{\mathrm{d}y_2}, \end{gather}
where the function  $P(X,Z)$ is introduced to denote the pressure in the lower deck, i.e.
 $p_3=P(X,Z)$, which is independent of the transverse coordinate. The main deck plays a passive role of conveying the displacement effect produced in the lower deck to the upper deck.
In the upper deck, where  $y_1=O(1)$, the displacement-induced pressure can be expanded as
 $p=\epsilon ^2p_1+O(\epsilon ^3)$, where
 $p_1$ is governed by
 $$\begin{gather} \left(M_\infty^2-1\right)\frac{\partial ^2 p_1}{\partial X^2}- \frac{\partial ^2 p_1}{\partial y_1^2}-\frac{\partial ^2 p_1}{\partial Z^2}=0, \end{gather}$$
and subjected to the matching and boundary conditions
 \begin{equation} \left.\frac{\partial p_1}{\partial y_1}\right|_{y_1=0}= \frac{\partial^2A}{\partial X^2}, \quad p_1|_{y_1=0}= P(X,Z),\quad p_1|_{y_1\to\infty}\to0. \end{equation}
The solution to the boundary-value problem (2.17)–(2.18a–c) leads to the so-called pressure-displacement relation.
2.2. Streaky flow induced by streamwise-elongated heating elements
Surface heating with both streamwise and spanwise lengths on the triple-deck scale is of interest, but its impact on stability must be accounted for by an extension of the local scattering approach (Wu & Dong Reference Wu and Dong2016), which is computationally expensive. We now consider elongated heating elements whose spanwise length scale remains unchanged but the streamwise length scale  $d^*$ is stretched to
 $O(\epsilon ^3\epsilon _x^{-1})L$, where
 $\epsilon _x\ll 1$ is the aspect ratio, i.e. the ratio of the spanwise spacing and streamwise extent of the heating elements. This is a departing point from the previous work (Koroteev & Lipatov Reference Koroteev and Lipatov2009, Reference Koroteev and Lipatov2012). The order of magnitude of
 $\rho _3$,
 $T_3$ and
 $\mu _3$ remains
 $O(1)$. A simplified structure arises after appropriate balances. We first introduce the rescaled independent and dependent variables,
 \begin{gather} \{\bar{X},\bar{y}_3,\bar{A}\}=\{\epsilon_xX,\epsilon_yy_3,\epsilon_aA\}, \end{gather}
 \begin{gather}\{\bar{u}_3,\bar{v}_3,\bar{w}_3,\bar{p}_3\}=\{\epsilon_uu_3, \epsilon_vv_3,\epsilon_ww_3,\epsilon_pp_3\}, \end{gather}
where rescaling factors  $\epsilon _y$,
 $\epsilon _u$,
 $\epsilon _v$,
 $\epsilon _w$,
 $\epsilon _p$ and
 $\epsilon _a$ are to be found. In the lower deck, all three terms in the continuity equation (2.6) balance, and the inertial and viscous terms balance in momentum equations (2.7) and (2.8). The terms in the matching condition (2.12a) balance. Meanwhile, the matching condition (2.18a) holds. These balances lead to six relations,
 \begin{equation} \frac{\epsilon_x}{\epsilon_u}= \frac{\epsilon_y}{\epsilon_v}= \frac{1}{\epsilon_w},\quad \frac{\epsilon_x}{\epsilon_u}= \epsilon_y^2,\quad \epsilon_u= \epsilon_y = \epsilon_a, \quad \frac{1}{\epsilon_p}= \frac{\epsilon_x^2}{\epsilon_a},\end{equation}
from which the six rescaling factors are expressed in terms of  $\epsilon _x$,
 \begin{equation} \{\epsilon_y, \epsilon_u, \epsilon_v, \epsilon_w, \epsilon_p, \epsilon_a\}= \{\epsilon_x^{1/3}, \epsilon_x^{1/3}, \epsilon_x^{{-}1/3},\epsilon_x^{{-}2/3},\epsilon_x^{{-}5/3},\epsilon_x^{1/3}\}.\end{equation}
Substitution of (2.19)–(2.20) with (2.22) into (2.6)–(2.9) leads to the equations governing the lower-deck flow,
 \begin{gather} \frac{\partial \left(\rho_3\bar{u}_3\right)}{\partial \bar{X}}+ \frac{\partial \left(\rho _3 \bar{v}_3\right)}{\partial \bar{y}_3}+ \frac{\partial \left(\rho _3 \bar{w}_3\right)}{\partial Z}=0, \end{gather}
 \begin{gather}\rho_3\left(\bar{u}_3\frac{\partial \bar{u}_3}{\partial \bar{X}}+\bar{v}_3\frac{\partial \bar{u}_3}{\partial \bar{y}_3}+\bar{w}_3\frac{\partial \bar{u}_3}{\partial Z}\right)=\frac{\partial}{\partial \bar{y}_3}\left(\mu_3 \frac{\partial \bar{u}_3}{\partial \bar{y}_3}\right), \end{gather}
 \begin{gather}\rho_3\left(\bar{u}_3\frac{\partial \bar{w}_3}{\partial \bar{X}}+\bar{v}_3\frac{\partial \bar{w}_3}{\partial \bar{y}_3}+\bar{w}_3\frac{\partial \bar{w}_3}{\partial Z}\right)=\frac{\partial}{\partial \bar{y}_3}\left(\mu_3 \frac{\partial \bar{w}_3}{\partial \bar{y}_3}\right), \end{gather}
 \begin{gather}\rho_3\left(\bar{u}_3\frac{\partial T_3}{\partial \bar{X}}+\bar{v}_3\frac{\partial T_3}{\partial \bar{y}_3}+\bar{w}_3\frac{\partial T_3}{\partial Z}\right)=\frac{\partial}{\partial \bar{y}_3}\left(\mu_3 \frac{\partial T_3}{\partial \bar{y}_3}\right), \end{gather}
 \begin{gather}\frac{\partial \bar{p}_3}{\partial \bar{y}_3}=0,\quad \rho_3T_3=1, \end{gather}
and the boundary and matching conditions (2.10a,b)–(2.12a–c) take on the rescaled form
 \begin{gather} \bar{u}_3\to \lambda_B\bar{y}_3,\quad \bar{w}_3\to0,\quad T_3\to T_{B}(0)\quad \text{as}\ \bar{X}\to -\infty; \end{gather}
 \begin{gather}\bar{u}_3=\bar{v}_3=\bar{w}_3=0,\quad T_3=T_w(\bar{X},Z)\quad \text{on}\ \bar{y}_3=0; \end{gather}
 \begin{gather}\bar{u}_3\to \lambda_B(\bar{y}_3+\bar{A}),\quad \bar{w}_3\to0,\quad T_3\to T_{B}(0)\quad \text{as}\ \bar{y}_3\to\infty. \end{gather}
In the upper deck, the pressure is rescaled as  $\bar {p}_1=\epsilon _x^{-5/3}p_1$. Since the streamwise derivative of the pressure is relatively small, the governing equation (2.17) reduces to
 \begin{equation} \frac{\partial^2 \bar{p}_1}{\partial y_1^2}+\frac{\partial^2 \bar{p}_1}{\partial Z^2}=0, \end{equation}
with the matching conditions (2.18a–c) remaining unchanged.
2.3. Solutions of the lower deck
We first consider the boundary-value problem for  $\bar {w}_3$ consisting of the
 $z$-momentum equation (2.25) together with the vanishing initial and boundary conditions of
 $\bar {w}_3$ in (2.28a–c)–(2.30a–c). Based on this system, an analogy (or equivalence) may be drawn between
 $\bar {w}_3$ and a passive scalar that is advected and undergoes diffusion. The homogeneous upstream and boundary conditions imply that no scalar is introduced to the flow field, and it follows that
 $\bar {w}_3\equiv 0$. Alternatively and more mathematically, according to the weak maximum principle of parabolic partial differential equations (Renardy & Rogers Reference Renardy and Rogers2006), the spanwise velocity
 $\bar {w}_3$ is identically zero. Therefore, the elongated-element induced streaky flow can, despite its three-dimensional nature, be calculated in a quasi-two-dimensional manner. This is a simple but useful result as it allows for simplification of the computations. However, a numerical approach still has to be taken for a general viscosity law.
When Chapman's viscosity law is adopted, for which  $\mu _3=CT_3$ with
 $C=1$ for the non-dimensionalisation adopted, and after employing the Dorodnitsyn–Howarth transformation and the associated substitution of the transverse velocity (cf. Aljohani & Gajjar Reference Aljohani and Gajjar2017b),
 \begin{equation} \bar{Y}_3(\bar{X},\bar{y}_3,Z)=\int_0^{\bar{y}_3}\rho_3(\bar{X},y,Z)\,\mathrm{d} y,\quad \rho_3\bar{v}_3=\bar{V}_3(\bar{X},\bar{Y}_3,Z)-\bar{u}_3\left.\frac{\partial \bar{Y}_3}{\partial \bar{X}}\right|_{\bar{y}_3}, \end{equation}
the fully nonlinear equations (2.23)–(2.26) simplify to
 \begin{equation} \frac{\partial\bar{u}_3}{\partial \bar{X}}+\frac{\partial \bar{V}_3}{\partial \bar{Y}_3}=0,\quad \bar{u}_3\frac{\partial \bar{u}_3}{\partial \bar{X}}+\bar{V}_3 \frac{\partial \bar{u}_3}{\partial \bar{Y}_3}=\frac{\partial^2 \bar{u}_3}{\partial \bar{Y}_3^2},\quad \bar{u}_3\frac{\partial T_3}{\partial \bar{X}}+\bar{V}_3\frac{\partial T_3}{\partial \bar{Y}_3}= \frac{\partial^2 T_3}{\partial \bar{Y}_3^2}, \end{equation}
which are the same as in the incompressible case. A seemingly trivial solution to (2.33a,b) satisfying both the matching and boundary conditions (2.28a–c)–(2.30a–c) is found as
 \begin{equation} \bar{u}_3=\frac{\lambda_B}{\rho_B(0)}\bar{Y}_3,\quad \bar{V}_3=0,\quad \bar{A}=\frac{1}{\rho_B(0)}\int_0^\infty[\rho_3-\rho_B(0)]\,\mathrm{d}y.\end{equation}
Therefore, the temperature equation (2.33c) simplifies to a linear diffusion equation and can be solved by a marching method first. With the temperature field known, the velocity field can be obtained using (2.34a–c). Indeed (2.34a–c) is the appropriate solution with the similarity variable  $\bar {Y}_3$ containing both the streamwise and wall-normal coordinates through (2.32a). It is rather remarkable that the solution to the fully nonlinear equations (2.23)–(2.26) for the induced three-dimensional flow can be constructed in such a simple procedure; this observation has not been made before to the best of our knowledge.
The lower-deck solutions  $u_3$ and
 $T_3$, and main-deck solutions
 $u_2$ and
 $T_2$, are only valid in their respective regions. A composite solution that is valid in both decks can be constructed by using the additive composition (Van Dyke Reference Van Dyke1975). On noting the scalings in (2.4a,b)–(2.5a,b), (2.13a,b)–(2.14a,b) and (2.19)–(2.20) with (2.22) the composite solution for the streamwise velocity and the temperature can be expressed as
 \begin{gather} u^c=\underbrace{\epsilon\epsilon_x^{{-}1/3}\bar{u}_3(\bar{X}, \bar{y}_3,Z)}_{{lower\text{-}deck solution}}+ \underbrace{u_B(y_2)+\epsilon\epsilon_x^{{-}1/3}\bar{A}(\bar{X},Z)u'_B(y_2)}_{{main\text{-}deck solution}} -\underbrace{\epsilon\epsilon_x^{{-}1/3}\lambda_B(\bar{y}_3+\bar{A} (\bar{X},Z))}_{{common\ part}}, \end{gather}
 \begin{gather}T^c=\underbrace{T_3(\bar{X},\bar{y}_3,Z)}_ {{lower\text{-}deck\ solution}} +\underbrace{T_B(y_2)}_{{main\text{-}deck solution}} -\underbrace{T_B(0)}_{{common\ part}}. \end{gather}
Numerical calculations of  $u^c$ and
 $T^c$ are performed for the three-dimensional flow induced by a surface temperature distribution of the variable separation form,
 \begin{equation} T_w(\bar{X},Z) = T_B(0)+hf(\bar{X})S(Z),\end{equation}
where  $h$ measures the heating level,
 $f(\bar {X})$ is taken to be Gaussian distribution and
 $S(Z)$ has a Fourier series representation,
 \begin{equation} f(\bar{X}) = \exp(-(\bar{X}/d)^2),\quad S(Z) = \sum_{n=0}^{+\infty} s_n\cos(n\beta Z),\end{equation}
where  $d$ is the rescaled length measuring the streamwise extent, and
 $\beta$ the spanwise wavenumber, of the heating elements. For simplicity, in our calculations we take
 $s_1=1$ and
 $s_n=0$ for all
 $n\neq 1$, i.e.
 \begin{equation} S(Z)=\cos(\beta Z). \end{equation}
Other parameter values are:  $M_\infty =3$,
 $\gamma =1.4$ (in air),
 $d=0.5$,
 $\beta =2{\rm \pi}$ and
 $h=1$, which corresponds to heating with the maximum surface temperature variation being the same as the free-stream temperature, or
 $36\,\%$ of the unperturbed adiabatic surface temperature since
 $T_B(0)=2.8$. We take
 $\epsilon =0.2$ (which corresponds to a typical Reynolds number
 ${\textit {Re}}\approx 5\times 10^5$) and
 $\epsilon _x=0.06$ as in Kátai & Wu (Reference Kátai and Wu2020), where these values are pertinent to the experiment of Downs & Fransson (Reference Downs and Fransson2014). Figure 2 shows in the
 $y_2$–
 $Z$ plane the contours of the composite streamwise velocity and temperature,
 $u^c$ and
 $T^c$, and their deviation from the Blasius flow,
 $u^c-u_B$ and
 $T^c-T_B$, at four different streamwise locations. The form of streaks can be observed in both the velocity and temperature deviations. High-temperature low-speed streaks arise at the centreline of the heating (
 $Z=0$), along with low-temperature high-speed streaks at
 $Z=\pm 0.5$. While the temperature field
 $T^c$ exhibits obvious three dimensionality, the velocity
 $u^c$ as shown in the figure varies weakly in the spanwise direction. This is due to the fact that in the main layer the heating-induced spanwise-varying velocity is much smaller than, and, hence, masked by, the Blasius flow. The former is comparable with the latter only in the region closer to the wall. A zoomed view of this part of the flow is displayed in figure 3, and a significant spanwise variation is observed for
 $-0.5\leq \bar {X}\leq 0.5$, and indeed
 $u^c \approx \epsilon \epsilon _x^{-1/3}\lambda _u(\bar {X},Z)\bar {y}_3$ as expected, where
 $\lambda _u$ represents the rescaled wall shear of the streaky flow.
(a,c,e,g) Contours of the composite temperature  $T^c$ (dotted lines) and its deviation from the Blasius flow,
 $T^c-T_B$ (solid and dashed lines); (b,d,f,h) contours of the composite streamwise velocity
 $u^c$ (dotted lines) and its deviation from the Blasius flow,
 $u^c-u_B$ (solid and dashed lines). Results are shown for (a,b)
 $\bar {X}=-0.5$; (c,d)
 $\bar {X}=0$; (e,f)
 $\bar {X}=0.5$; (g,h)
 $\bar {X}=1$. Parameters:
 $\epsilon =0.2$,
 $\epsilon _x=0.06$.

A zoomed near-wall view of the flow shown in figure 2. Results are shown for (a,b)  $\bar {X}=-0.5$; (c,d)
 $\bar {X}=0$; (e,f)
 $\bar {X}=0.5$; (g,h)
 $\bar {X}=1$. Black lines:
 $T^c$ (a,c,e,g) and
 $u^c$ (b,d,f,h); red lines:
 $\epsilon \epsilon _x^{-1/3}\lambda _u\bar {y}_3$.

As the flow depends on both the transverse and spanwise coordinates, the instability is in general of a bi-global type (Theofilis Reference Theofilis2011). However, our concern is with the lower-branch viscous instability, which will later be shown to be controlled by the wall shear  $\lambda _u$ and wall temperature
 $T_w$ only. Interestingly, the wall shear
 $\lambda _u$ has the analytical expression
 \begin{equation} \lambda_u(\bar{X},Z)=\left.\frac{\partial \bar{u}_3}{\partial \bar{y}_3}\right|_{\bar{y}_3=0}= \lambda_B\frac{\rho_3 (\bar{X},0,Z)}{\rho_B(0)}=\lambda_B\frac{T_B(0)}{T_w(\bar{X},Z)}, \end{equation}
which can be calculated without solving for the flow field in the boundary layer. The constant  $\lambda _B$ will be set to unity on the understanding that the dependence on it is accounted for by the rescaling as in Smith (Reference Smith1989).
3. Linear stability analysis of the streaky boundary layer
Lower-branch Tollmien–Schlichting (T-S) modes of a subsonic boundary layer are well known to be governed by the triple-deck structure (Lin Reference Lin1946; Smith Reference Smith1979b). As continuation of oblique T-S modes into the supersonic regime, first Mack modes are also shown to have the triple-deck scales with the wavelength being of  $O(\epsilon ^3)$ and the frequency
 $O(\epsilon ^{-2})$ (Smith Reference Smith1989). These scales carry over to the viscosity instability of the heating-induced streaky flow. Therefore, we introduce the rescaled time variable,
 $\hat {t}=\epsilon ^{-2}t$, for instability analysis. The instability remains being governed by the same triple-deck structure but the lower-deck dynamics differs significantly from that in the classical settings (Smith Reference Smith1979b, Reference Smith1989) and in incompressible streaky flows (Kátai & Wu Reference Kátai and Wu2020). By taking advantage of the triple-deck structure, the dependence of the mode on the vertical coordinate can be treated analytically, thereby reducing the bi-global instability to a one-dimensional eigenvalue problem in the spanwise direction.
3.1. Main deck
In the main deck, the perturbed flow field can be expanded as
 \begin{gather} \{u,v,w\}=\{u_{2b},\epsilon^2\epsilon_x^{2/3}v_{2b},\epsilon^2\epsilon_x^{2/3}w_{2b}\}+ \epsilon\epsilon_d\{\hat{u}_2,\epsilon\hat{v}_2,\epsilon \hat{w}_2\}E, \end{gather}
 \begin{gather}\{p,\rho,T\}=\{\epsilon^2\epsilon_x^{5/3}p_{2b},\rho_{2b},T_{2b}\}+\epsilon\epsilon_d\{\epsilon \hat{p}_2,\hat{\rho}_2,\hat{T}_2\}E, \end{gather}
where the quantities with a subscript  $b$ signify those of the base flow, the second terms represent a normal-mode disturbance, in which
 $\epsilon _d\ll 1$ denotes its amplitude and
 $E=\exp {[\textrm {i}(\alpha X-\omega \hat {t})]}$ with
 $\alpha$ and
 $\omega$ being of
 $O(1)$. For spatial stability,
 $\omega$ is real denoting the frequency and
 $\alpha =\alpha _r+\textrm {i}\alpha _i$ is complex with
 $\alpha _r$ being the wavenumber and
 $(-\alpha _i)$ the growth rate. The relative orders of magnitude of the velocity, pressure and density (temperature) of the disturbance, as indicated by (3.1)–(3.2), are the same as those for the viscous first mode (Smith Reference Smith1989). This is because the present instability retains the spatial and temporal scales of the latter, while the heating-induced mean-flow distortion amounts to a small correction to the Blasius flow. Substituting (3.1)–(3.2) into the NS equations and solving the resultant equations, we obtain the leading-order solution,
 \begin{gather} \hat{u}_2=A_1\frac{\partial u_{2b}}{\partial y_2},\quad \hat{v}_2={-}\text{i}\alpha A_1u_{2b},\quad \hat{w}_2={-}\frac{1}{\text{i}\alpha \rho_{2b}u_{2b}} \frac{\partial \hat{p}_2}{\partial Z}, \end{gather}
 \begin{gather}\hat{p}_2=\hat{p}_2(Z),\quad \hat{T}_2=A_1\frac{\partial T_{2b}}{\partial y_2}, \end{gather}
where  $A_1(Z)$ is introduced as the displacement function.
3.2. Lower deck
In the lower deck, the flow field, consisting of the streaky boundary layer flow and the modal disturbance, expands as
 \begin{gather} \{u,v,w\}=\epsilon\{\epsilon_x^{{-}1/3}u_{3b},\epsilon^2\epsilon_x^{1/3}v_{3b},\epsilon_x^{2/3}w_{3b}\} +\epsilon\epsilon_d\{\hat{u}_3, \epsilon^2\hat{v}_3, \hat{w}_3\}E, \end{gather}
 \begin{gather}\{p,\rho,T,\mu\}=\{\epsilon^2\epsilon_x^{5/3}p_{3b},\rho_{3b},T_{3b},\mu_{3b}\}+\epsilon_d \{\epsilon^2\hat{p}_3,\hat{\rho}_3,\hat{T}_3,\hat{\mu}_3\}E. \end{gather}
Since the lower deck for the streaky base flow is much thicker than that for instability modes, we approximate the base-flow quantities by their Taylor expansions about the wall,
 \begin{equation} \{u_{3b}, v_{3b}, w_{3b}\} \approx \epsilon_x^{1/3}\{\lambda_u, \epsilon_x^{1/3}\lambda_v y_3, \lambda_w\}y_3,\quad \{T_{3b},\rho_{3b},\mu_{3b}\}\approx \{T_w,\rho_w,\mu_w\}, \end{equation}
where  $\lambda _u$ is given by (2.40),
 $\lambda _w={\partial w_{3b}}/{\partial \bar {y}_3}|_{\bar {y}_3=0}$,
 $\lambda _v=-\frac {1}{2}(\lambda _{u,\bar {X}}+\lambda _{w,Z})$,
 $T_w=T_w(\bar {X},Z)$,
 $\rho _w=1/T_w$ and
 $\mu _w=\mu (T_w)$.
Attention should be paid to the asymptotic scalings of the modal disturbance in (3.5)–(3.7a,b). Its velocity components and pressure have the same scalings as for the viscous first mode (Smith Reference Smith1989) as a result of the shared characteristic frequency and wavelength. However, due to the presence of the  $O(1)$ heating-induced spanwise varying temperature
 $T_{3b}$, the spanwise advection induces a temperature disturbance that is greater than the velocity fluctuation by a factor of
 $\epsilon ^{-1}$. This is deduced by considering the key balance in the energy equation as follows. Let the temperature disturbance be denoted by
 $\tilde T$. The unsteady term
 $\partial \tilde {T}/\partial t=$
 $O(\epsilon ^{-2} \tilde T)$ while the spanwise advection
 $w\partial T_{3b}/\partial z=O(\epsilon \epsilon _d\cdot \epsilon ^{-3})$, and so the balance of the two suggests that
 $\tilde T =O(\epsilon _d)$. The associated density disturbance of the same order-of-magnitude would then appear at the leading-order expansion of the continuity equation. Substituting (3.5)–(3.7a,b) into the NS equations, we obtain the equations governing the lower-deck normal-mode disturbance,
 \begin{gather} -\text{i}\omega\hat{\rho}_3+\rho_w\left(\text{i}\alpha \hat{u}_3+\frac{\partial \hat{v}_3}{\partial y_3}+ \frac{\partial \hat{w}_3}{\partial Z}\right)+\text{i}\alpha\lambda_u y_3\hat{\rho}_3 +\frac{\partial \rho_w}{\partial Z}\hat{w}_3=0, \end{gather}
 \begin{gather}\rho_w\left(-\text{i}\omega \hat{u}_3+\text{i}\alpha \lambda_u y_3 \hat{u}_3+\lambda_u\hat{v}_3+\lambda_{u Z}y_3\hat{w}_3\right)={-}\text{i}\alpha \hat{p}_3+\mu_w \frac{\partial^2 \hat{u}_3}{\partial y_3^2}+ \lambda_u\frac{\partial \hat{\mu}_3}{\partial y_3}, \end{gather}
 \begin{gather}\frac{\partial \hat{p}_3}{\partial y_3}=0,\quad \rho_w\left(-\text{i}\omega \hat{w}_3+\text{i}\alpha \lambda_u y_3 \hat{w}_3\right)={-}\frac{\partial \hat{p}_3}{\partial Z}+\mu_w \frac{\partial^2 \hat{w}_3}{\partial y_3^2}, \end{gather}
 \begin{gather}\rho_w\left(-\text{i}\omega \hat{T}_3+\text{i}\alpha \lambda_u y_3 \hat{T}_3+\frac{\partial T_{w}}{\partial Z}\hat{w}_3\right)= \mu_w \frac{\partial^2 \hat{T}_3}{\partial y_3^2}, \end{gather}
while the expansion of Chapman's viscosity law yields
 \begin{equation} \hat\mu_3 =\frac{\partial\mu}{\partial\bar{y}_3}(0)\hat{T}_3 =\hat{T}_3. \end{equation}
It is worth pointing out that (3.8)–(3.11) remain valid for a general viscosity law, but (3.12) would be different. The present instability exhibits two significantly distinct features from those of usual T-S or first Mack modes (Smith Reference Smith1979b, Reference Smith1989). The temperature/density fluctuation is of  $O(\epsilon _d)$, much stronger than the
 $O(\epsilon \epsilon _d)$ velocity fluctuation. As a result, the temperature/density and velocity fields are coupled, i.e. the disturbance in the lower deck is fully compressible as opposed to the incompressible dynamics of first Mack modes. Instability with such an asymptotic structure does not appear to have been identified before. Governed by partial differential equations, the instability is of a bi-global nature. Interestingly and remarkably, the system can be reduced to a one-dimensional eigenvalue problem in the spanwise direction, which amounts to a substantial simplification (cf. Kátai & Wu Reference Kátai and Wu2020). The ensuing algebra may appear rather complex. The end result is (3.21), which along with (3.25a–c) will form the eigenvalue problem. Readers uninterested in the derivation may go directly to (3.21).
The lower-deck velocities and temperature can, despite being coupled, be solved in terms of the pressure by following earlier papers (Smith Reference Smith1979a; Walton & Patel Reference Walton and Patel1998; Kátai & Wu Reference Kátai and Wu2020). In order to simplify (3.8)–(3.11), we first introduce the rescaled variable
 \begin{equation} \zeta=\left(\text{i} \alpha\lambda_u\rho_w/\mu_w\right)^{1/3}y_3+\zeta_0,\quad \zeta_0={-}\left( \text{i} \alpha\lambda_u\rho_w/\mu_w\right)^{1/3}\omega/(\alpha \lambda_u).\end{equation}
The  $z$-momentum equation (3.10a,b) is then reduced to an inhomogeneous Airy equation. The solution for
 $\hat {w}_3$, which satisfies the vanishing boundary and matching conditions, is found as
 \begin{equation} \hat{w}_3=\frac{\rm \pi}{\mu_w}\left(\frac{\mu_w}{\text{i}\alpha \lambda_u \rho_w}\right)^{2/3} \frac{\partial \hat{p}_3}{\partial Z}\left(\frac{\text{Gi}(\zeta_0)}{\mbox{Ai}(\zeta_0)}\mbox{Ai}(\zeta)-\text{Gi} (\zeta)\right),\end{equation}
where  $\mbox {Ai}(\zeta )$ and
 $\textrm {Gi}(\zeta )$ denote the Airy and Scorer functions, respectively. With
 $\hat {w}_3$ found, the temperature equation (3.11) amounts to an inhomogeneous Airy equation as well, and the solution subject to vanishing matching and boundary conditions is obtained as
 \begin{equation} \hat{T}_3={-}\frac{\hat{T}^*_3(\zeta_0)}{\mbox{Ai}(\zeta_0)}\mbox{Ai}(\zeta) +\hat{T}^*_3(\zeta),\end{equation}
where
 \begin{equation} \hat{T}^*_3(\zeta)=\frac{\rm \pi}{\text{i}\alpha\lambda_u\mu_w} \left(\frac{\mu_w}{\text{i}\alpha \lambda_u \rho_w}\right)^{1/3} \frac{\partial \hat{p}_3}{\partial Z}\frac{\partial T_w}{\partial Z} \left(\frac{\text{Gi}(\zeta_0)}{\mbox{Ai}(\zeta_0)} \mbox{Ai}'(\zeta)-\text{Gi}'(\zeta)\right), \end{equation}
with the prime representing the derivative with respect to  $\zeta$.
Differentiating (3.9) with respect to  $y_3$ followed by using the continuity and energy equations (3.8) and (3.11), to eliminate
 $\hat {p}_3$,
 $\hat {v}_3$ and
 $\hat {T}_3$, (3.9) simplifies to
 \begin{equation} \frac{\partial^3 \hat{u}_3}{\partial \zeta^3}-\zeta\frac{\partial \hat{u}_3}{\partial \zeta}= \frac{\lambda_{u Z}}{\text{i}\alpha\lambda_u}\hat{w}_3+\frac{\lambda_{u Z}}{\text{i}\alpha\lambda_u} \left(\zeta-\zeta_0\right)\frac{\partial \hat{w}_3}{\partial \zeta}-\frac{1}{\text{i}\alpha} \frac{\partial \hat{w}_3}{\partial Z},\end{equation}
on which the boundary and matching conditions are imposed as
 \begin{gather} \hat{u}_3|_{\zeta=\zeta_0}=0,\quad \left.\frac{\partial^2 \hat{u}_3}{\partial \zeta^2}\right|_{\zeta=\zeta_0}= \left(\frac{\mu_w}{\text{i}\alpha \lambda_u \rho_w}\right)^{2/3} \frac{\text{i}\alpha \hat{p}_3}{\mu_w}-\left(\frac{\mu_w}{\text{i}\alpha \lambda_u \rho_w}\right)^{1/3} \frac{\lambda_u}{\mu_w}\left.\frac{\partial \hat{T}_3}{\partial \zeta}\right|_{\zeta=\zeta_0}, \end{gather}
 \begin{gather}\hat{u}_3|_{\zeta \to \infty}=A_1\lambda_u. \end{gather}
With  $\hat {w}_3$ and
 $\hat {T}_3$ given by (3.14)–(3.15), the solution to (3.17)–(3.19) is found as
 \begin{equation} \hat{u}_3=\phi_1\int_{\zeta_0}^{\zeta}\mbox{Ai}(t)\,{\rm d} t+ \phi_2\mbox{Ai}(\zeta)+\phi_3\text{Gi}(\zeta)+\phi_4\zeta\mbox{Ai}'(\zeta) +\phi_5\zeta\text{Gi}'(\zeta)-\phi_6,\end{equation}
where the expressions of  $\phi _1$-
 $\phi _6$ are given in Appendix A. Inserting (3.20) into (3.19), we obtain the equation for
 $\hat {p}_3$,
 \begin{equation} \frac{\partial^2 \hat{p}_3}{\partial Z^2}-\mathcal{R}(Z) \frac{\partial \hat{p}_3}{\partial Z}-\alpha^2\hat{p}_3=\mathcal{Q}(Z)A_1,\end{equation}
which is an ordinary differential equation with respect to the spanwise variable  $Z$. The functions
 $\mathcal {R}(Z)$ and
 $\mathcal {Q}(Z)$ have the expressions,
 \begin{equation} \left.\begin{gathered} \mathcal{R}(Z) = \left(\frac{1}{4}\frac{\mu_{wZ}}{\mu_w}- \frac{1}{4}\frac{\rho_{wZ}}{\rho_w}+\frac{1}{2} \frac{\lambda_{uZ}}{\lambda_u}\right)\frac{\zeta_0}{\mbox{Ai}(\zeta_0)} \left(\zeta_0\kappa(\zeta_0)+\mbox{Ai}'(\zeta_0)\right) \\ \quad +\left(\frac{1}{4}\frac{\mu_{wZ}}{\mu_w}+\frac{3}{4}\frac{\rho_{wZ}}{\rho_w}+ \frac{3}{2}\frac{\lambda_{uZ}}{\lambda_u}\right)+ \left(1+\frac{\mbox{Ai}'(\zeta_0)}{\mbox{Ai}^2(\zeta_0)}\kappa(\zeta_0)\right)\frac{\partial T_w}{\partial Z},\\ \mathcal{Q}(Z) = \left(\text{i}\alpha\lambda_u\right)^{5/3}\rho_w^{2/3} \mu_w^{1/3}\frac{\mbox{Ai}'(\zeta_0)}{\kappa(\zeta_0)}, \end{gathered}\right\} \end{equation}
with
 \begin{equation} \kappa(\zeta_0)=\int_{\zeta_0}^\infty\mbox{Ai}(t)\,{\rm d} t.\end{equation}
The reader is reminded that the main result (3.21) with (3.22) is derived under the assumption of Chapman's relation for viscosity. When the more accurate viscosity Sutherland's law is adopted, (3.21) can still be derived, but the expressions for  $\mathcal {R}(Z)$ and
 $\mathcal {Q}(Z)$ would differ from (3.22).
3.3. Upper deck
Similar to the first mode (Smith Reference Smith1989), the wall-normal velocity at the outer edge of the main layer acts on the upper deck to generate a pressure perturbation, which acts in turn on the viscous lower deck. It thus suffices to consider the pressure of the modal disturbance in the upper deck, where the pressure expands as
 \begin{equation} p=\epsilon^2\epsilon_x^{5/3}\bar{p}_1+\epsilon^2\epsilon_d\hat{p}_1 E. \end{equation}
The equation governing the pressure disturbance and the matching conditions are
 \begin{align} \alpha^2\left(M_\infty^2-1\right)\hat{p}_1+\frac{\partial^2 \hat{p}_1}{\partial y_1^2}+ \frac{\partial^2 \hat{p}_1}{\partial Z^2}=0,\quad \left.\frac{\partial \hat{p}_1}{\partial y_1}\right|_{y_1= 0}={-}\alpha^2A_1,\quad \hat{p}_1|_{y_1= 0}=\hat{p}_3(Z). \end{align}
The instability of the heating-induced streaky flow is governed by (3.25a–c) and (3.21). Note that the coefficients are only related to the wall shear  $\lambda _u(Z)$ and wall temperature
 $T_w(Z)$, indicating that the instability is, to leading-order accuracy, controlled by
 $\lambda _u$ and
 $T_w$ only.
3.4. The eigenvalue problem
Since the coefficients of (3.21) are periodic functions of  $Z$ with spanwise number
 $\beta$ (see (2.37)–(2.38a,b)), we use Floquet theory to express
 $\hat {p}_1$,
 $\hat {p}_3$ and
 $A_1$ in the form
 \begin{equation} \{\hat{p}_1(y_1,Z), \hat{p}_3(Z),A_1(Z)\}=\exp{(\text{i}q\beta Z)}\sum_{n={-}\infty}^\infty\{\bar{p}_n(y_1), \bar{P}_n, \bar{A}_n\}\exp{(\text{i}n\beta Z)},\end{equation}
where  $q$ is the Floquet exponent, which is taken to be real-valued since the disturbance is bounded in the spanwise direction. Substitution of (3.26) into (3.25a–c
 $a$) yields
 \begin{equation} \frac{\partial^2 \bar{p}_n}{\partial y_1^2}-\left[(n+q)^2\beta^2-\alpha^2(M_\infty^2-1)\right]\bar{p}_n=0. \end{equation}
Let  $\varLambda =(n+q)^2\beta ^2-\alpha ^2(M_\infty ^2-1)$, whose real part is denoted by
 $\varLambda _r$. Typically,
 $\alpha _r$ turns out to be significantly greater than
 $\alpha _i$ numerically, and so the far-field behaviour of
 $\bar {p}_n$ is dominated by
 $\varLambda _r$. The solution satisfying (3.25a–c
 $c$) is found as
 \begin{align} \bar{p}_n=\bar{P}_n\exp(-\varLambda^{1/2}y_1)\quad \mbox{if}\ \varLambda_r>0,\quad \bar{p}_n=\bar{P}_n\exp(-\text{i}(-\varLambda)^{1/2}y_1)\quad \mbox{if}\ \varLambda_r<0; \end{align}
here we dismiss the branch that becomes exponentially large in the far field when  $\varLambda _r>0$, while for
 $\varLambda _r<0$, the branch corresponding to a negative group velocity in the wall-normal direction is dismissed on physical grounds. Equation (3.28b) indicates that due to spanwise-periodic heating, instability modes may emit acoustic waves to the far field while attenuating slowly, the rate of which is controlled by
 $\alpha _i$. When the mode is neutral, the disturbance is purely oscillatory in the far field, in contrast to non-radiating first Mack modes. Substitution of (3.28a) or (3.28b) into (3.25b) yields the pressure-displacement relation
 \begin{equation} \bar{A}_n=\alpha^{{-}2}\mathcal{L}_n(\alpha)\bar{P}_n,\end{equation}
where  $\mathcal {L}_n(\alpha )=\varLambda ^{1/2}$ for
 $\varLambda _r>0$, while
 $\mathcal {L}_n(\alpha )=\textrm {i}(-\varLambda )^{1/2}$ for
 $\varLambda _r<0$.
4. Numerical analysis and results
4.1. Dispersion relation
In order to solve the eigenvalue problem, (3.21) and (3.29), which is one dimensional in the spanwise direction, we express  $\mathcal {R}(Z)$ and
 $\mathcal {Q}(Z)$ in (3.21) as Fourier series
 \begin{equation} \mathcal{R}(Z)=\sum_{l={-}\infty}^{\infty}R_l\,{\rm e}^{\text{i}l\beta Z},\quad \mathcal{Q}(Z)=\sum_{l={-}\infty}^{\infty}Q_l\,{\rm e}^{\text{i}l\beta Z}. \end{equation}
Equating the coefficients of the respective Fourier components, we obtain an infinite-dimensional system for  $\bar {P}_n$, which is truncated to
 $[-N,N]$ and written in the matrix form
 \begin{equation} \boldsymbol{M}\bar{\boldsymbol{P}}=\boldsymbol{0},\quad \bar{\boldsymbol{P}}=(\bar{P}_{{-}N},\bar{P}_{{-}N+1}, \ldots,\bar{P}_0,\ldots,\bar{P}_N)^\text{T},\end{equation}
where  $\boldsymbol {M}=\boldsymbol {M_1}(\alpha,\beta,q)+\boldsymbol {M_2}(\alpha,\beta,\omega,q, \lambda _u,T_w)$, with
 $\boldsymbol {M_1}$ being a diagonal matrix and
 $\boldsymbol {M_2}$ a full matrix,
 \begin{equation} (\boldsymbol{M}_{\boldsymbol{1}})_{n,n} = \alpha^2+\beta^2(q+n)^2,\quad (\boldsymbol{M}_{\boldsymbol{2}})_{n,j} = \text{i}\beta(j+q)R_{n-j}+\alpha^{{-}2}\mathcal{L}_nQ_{n-j}. \end{equation}
For (4.2a,b) to have non-zero solutions, the determinant of matrix  $\boldsymbol {M}$ must vanish, namely,
 \begin{equation} \mathcal{D}(\alpha)=\text{det}\left(\boldsymbol{M} (\alpha,\beta,\omega,q,\lambda_u,T_w)\right)=0,\end{equation}
which is the dispersion relation. In the limiting case where the heating is absent or negligible (i.e.  $h=0$ in (2.37)),
 $\lambda _u=1$, we have
 $R_l=0$
 $\forall l$, and
 $Q_l=0$
 $\forall l \neq 0$. The relation (4.4) simplifies to
 \begin{equation} \mathcal{D}(\alpha)=\alpha^2\left(\alpha^2+\beta^2(q+K)^2\right)\kappa(\zeta_0) +\left(\text{i}\alpha\right)^{5/3}\rho_w^{2/3}\mu_w^{1/3} \mathcal{L}_K \mbox{Ai}'(\zeta_0) =0,\end{equation}
where  $\kappa (\zeta _0)$ is given in (3.23). For any integer
 $K$, this is the dispersion relation for first Mack modes with spanwise wavenumber
 $\beta _{TS}=\beta (q+K)$ (Smith Reference Smith1989).
4.2. Growth rates
The streaky flow induced by surface temperature distribution (2.37)–(2.38a,b) with  $h=1$,
 $d=0.5$ and
 $\beta =2{\rm \pi}$ was calculated in § 2 for
 $M_\infty =3$, and we now consider the impact of the heating on linear stability. The eigenvalue problem is solved starting from a position far upstream where the effect of heating is negligible so that the value of
 $\alpha$ for the first Mack mode, obtained by solving (4.5), is taken as the first guess in Muller's iteration (Muller Reference Muller1956). At subsequent streamwise locations, the convergent value of
 $\alpha$ for the previous location is used as an initial guess to find the root of the dispersion relation (4.4). The tolerance is taken to be
 $10^{-10}$. Resolution checks were performed, and it was found that the results with the Fourier series truncated at
 $N=7$,
 $15$ and
 $31$ exhibit no difference to the graphical precision; the relative errors between the two resolutions (
 $N=15$ and 7) are
 $O(10^{-6})$, and the relative errors between
 $N=15$ and
 $31$ reduced to be no greater than
 $10^{-10}$, the level of tolerance. The rapid convergence with respect to
 $N$ is due to the simple sinusoidal distribution of the surface temperature
 $T_w(Z)$ and wall shear
 $\lambda _u(Z)$. A larger
 $N$ is likely required for a more complex spanwise distribution (cf. Kátai & Wu Reference Kátai and Wu2020).
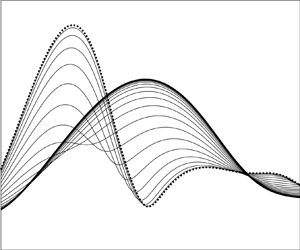
In figure 4 we show in the  $\alpha$–
 $\omega$ plane the growth rates of instability modes with different spanwise wavenumbers for
 $\lambda _u(Z)$ being calculated for surface temperature distribution (2.38a,b) with (2.39). Different lines refer to different streamwise locations between
 $\bar {X}=-1.2$ (thick solid lines) and
 $\bar {X}=0$ (thick dotted lines) with an increment of
 $0.05$. The thick solid lines can be considered as representing the growth rates of first Mack modes. Due to the local nature of the instability problem as well as the symmetry of the wall temperature (2.37) and the wall shear (2.40), it suffices to calculate only the upstream half of the heating region. Six representative spanwise wavenumbers (
 $\beta _{TS}/\beta =0.2$,
 $0.3$,
 $0.4$,
 $0.6$,
 $0.7$ and
 $0.8$) are chosen. For weakly three-dimensional modes with
 $\beta _{TS}<0.5\beta$ (figures 4a–c), there is always a range of frequencies in which the growth rate
 $(-\alpha _i)$ of instability modes decreases monotonically from the upstream to the centre of the elements. For example, for
 $\beta _{TS}/\beta =0.3$, a stabilising effect occurs for
 $4<\omega <6$. For sufficiently low and high frequencies, the growth rate increases monotonically. Between the low and intermediate frequencies, the growth rate varies non-monotonically. However, for strongly three-dimensional modes with
 $\beta _{TS}>0.5\beta$, figures 4(d–f) show that the growth rate
 $(-\alpha _i)$ increases monotonically with
 $\bar {X}$ for almost all frequencies with the exception for high values in figure 4(f), and the heating elements play a broad destabilising role. Non-continuous variations of the growth rate
 $(-\alpha _i)$ with the frequency
 $\omega$ can be observed for high frequencies in figures 4(a,f). Such discontinuities will be discussed later.
Growth rates vs the frequency  $\omega$ at various streamwise locations
 $\bar {X}$ for
 $S(Z)=\cos (2{\rm \pi} Z)$. Thick solid lines:
 $\bar {X}=-1.2$; thick dotted lines:
 $\bar {X}=0$. Different lines in between refer to different streamwise locations with an increment of
 $0.05$. The red dotted lines represent the continuation of the mode to the right/left by increasing/descreasing
 $\omega$ for fixed
 $\bar {X}=0$.

As in Kátai & Wu (Reference Kátai and Wu2020), for  $\beta _{TS}/\beta =0.5$ (i.e.
 $q=0.5$), we have also identified antisymmetric and symmetric modes, whose eigenfunctions
 $\hat {p}_3(Z)$ are odd and even functions of
 $Z$, respectively, and their growth rates are shown in figure 5(a,b). The instability characteristics of these antisymmetric/symmetric modes are similar to that of weakly/strongly three-dimensional modes in figure 4, and can be regarded as the continuation of the latter, respectively. The spanwise distributions of the lower-deck pressure
 $\hat {p}_3(Z)$ of these modes, which are also referred to as subharmonic modes, are displayed in figure 6(a,b). In addition to
 $q=1/2$, antisymmetric/symmetric modes are also found for
 $q=k/2$ with
 $k=2,3,\ldots$. Of these,
 $q=1$ (
 $k=2$) represents fundamental parametric resonance. Different from the subharmonic ones, figure 5(c,d) shows nearly the same variation (increase) of the growth rates for antisymmetric and symmetric fundamental modes. The corresponding spanwise distributions of the pressure
 $\hat {p}_3(Z)$ are presented in figure 6(c,d).
Growth rates vs the frequency  $\omega$ of subharmonic (a,b) and fundamental modes (c,d): (a,c) antisymmetric modes; (b,d) symmetric modes. Thick solid lines:
 $\bar {X}=-1.2$; thick dotted lines:
 $\bar {X}=0$. Different lines in between refer to different streamwise locations with an increment of
 $0.05$.

Spanwise shapes  $\hat {p}_3(Z)$ of symmetric (b,d) and antisymmetric (a,c) modes at
 $\bar {X}=0$ with
 $\omega =3$: (a,b) subharmonic modes; (c,d) fundamental modes.

Calculations are carried out also for heating elements with larger spanwise spacing, corresponding to  $\beta ={\rm \pi}$. The growth rates are displayed in figure 7. Compared with the case of
 $\beta =2{\rm \pi}$ shown in figure 4, the instability characteristics are broadly similar, but appreciable differences arise. For example, for
 $\beta _{TS}=0.4\beta$ (figure 7b), a distinctive band of high-frequency Mack modes are destabilised to become as dominant as destabilised low-frequency modes, and this band is marked by non-continuous variations with the frequency. For
 $\beta _{TS}>0.5\beta$, the modes within a small range of frequencies are stabilised by an amount that becomes rather moderate as
 $\beta _{TS}$ increases.
Growth rates vs the frequency  $\omega$ at various streamwise locations
 $\bar {X}$ for
 $S(Z)=\cos ({\rm \pi} Z)$. Thick solid lines:
 $\bar {X}=-1.2$; thick dotted lines:
 $\bar {X}=0$. Different lines in between refer to different streamwise locations with an increment of
 $0.05$. The red dotted lines represent the continuation of the mode to the right/left by increasing/descreasing
 $\omega$ for fixed
 $\bar {X}=0$.

A discussion of the discontinuities in figures 4 and 7 is in order. The discontinuities reflect coexistence of a multi-family of modes and ‘mode crossing’ phenomenon. The eigenvalue  $\alpha (\omega,\bar {X})$ is a function of
 $\omega$ and
 $\bar {X}$. It can be calculated by using either of the two approaches: the first fixes
 $\bar {X}$ but varies
 $\omega$ gradually, and while the second fixes
 $\omega$ but increases
 $\bar {X}$ in small increments. The data in the figures were calculated by the latter approach. Each eigen mode so obtained evolves from an upstream first mode with a spanwise wavenumber
 $\beta _{TS}=(k+q)\beta$ with
 $0\leq q \leq 1/2$, and, hence, each mode can be distinguished by
 $(k,q)$, and be designated by
 $\alpha _{k,q}(\omega,\bar {X})$ with
 $k=0,\pm 1,\ldots$, as shown by Kátai & Wu (Reference Kátai and Wu2020). At each
 $\bar {X}$, these modes coexist and are intricately interlinked as
 $\bar {X}$ and
 $\omega$ vary. If
 $k$ and
 $q$ are fixed also,
 $\alpha _{k,q}(\omega,\bar {X})$ may not be a continuous function of
 $\omega$. Taking
 $\bar {X}=0$ as an example, a jump occurs at
 $\omega _c \approx 6.5$ as is shown figure 4(a), and the modes on both sides may be designated as
 $\alpha _{0,0.2}(\omega,\bar {X})$, which evolves from a first mode upstream with
 $\beta _{TS}=0.2\beta$. On the other hand, with
 $\bar {X}=0$ being fixed, the mode to the left of the jump with
 $\omega <\omega _c$ may be continued parametrically to the right by gradually increasing
 $\omega$, and similarly, the mode to the right of the jump with
 $\omega >\omega _c$ may be continued to the left by decreasing
 $\omega$. The results are indicated by the red dotted lines. Interestingly, these extended lines turned out to coincide with the dotted lines in figure 4(f), and the jumps in figure 4(a,f) overlap. As each mode on the dotted lines in figure 4(f) develops from an upstream first mode with
 $\beta _{TS}=(-1+0.2)\beta$, it is designated as
 $\alpha _{-1,0.2}(\omega,\bar {X})$ and so is the mode on the red extended lines in figure 4(a). Indeed, starting with a mode on this line, we can trace it back to an upstream first mode with
 $\beta _{TS}/\beta =0.8$. It follows that as
 $\omega$ crosses
 $\omega _c$, there is a crossover from
 $\alpha _{0,0.2}(\omega,\bar {X})$ to
 $\alpha _{-1,0.2}(\omega,\bar {X})$ despite the fact they are on the same smooth line.
The jumps in figure 7(c,d) are associated with similar crossovers of modes. Again take  $\bar {X}=0$ for illustration. The discontinuous dotted curve represents the mode
 $\alpha _{0,0.4}(\omega,\bar {X})$. The small segment between the two jumps on the left can be continued to the smaller and larger
 $\omega$, whilst the dotted line to the left of the first jump is continued to the right (to connect with
 $\alpha _{0,0.4}(\omega,\bar {X})$). The extended lines turn out to be the same as the three segments of the dotted line in figure 7(d), and, thus, represent the mode
 $\alpha _{-1,0.4}(\omega,\bar {X})$, which evolves from an upstream first mode with
 $\beta _{TS}=(-1+0.4)\beta$. Similarly, the dotted lines to the right/left of the third jump in figure 7(c) can also be continued to the left/right, respectively. The resulting extended lines represent the mode
 $\alpha _{1,0.4}(\omega,\bar {X})$, which develops from an upstream first mode with
 $\beta _{TS}=(1+0.4)\beta$ (not shown).
Figure 8 displays the results for the heating elements with spanwise distribution  $S(Z)$ given in (2.38a,b) with
 $s_0=0.5$,
 $s_1=1$ and
 $s_n=0$ for all
 $n\leq 2$, that is,
 \begin{equation} S(Z)=0.5+\cos(2{\rm \pi} Z),\end{equation}
which combines a spanwise uniform part with a simple spanwise-harmonic Fourier component. Stabilising effects can be observed for most cases except low-frequency modes for  $\beta _{TS}/\beta <0.5$ plus a band of high-frequency modes for
 $\beta _{TS}/\beta =0.2$. Comparing figure 8 with figure 4, one notes that the addition of the spanwise uniform component leads to an opposite effect for the modes with
 $\beta _{TS}/\beta >0.5$, whose growth rates are substantially reduced, while for modes
 $\beta _{TS}/\beta <0.5$, the effect remains similar but quantitatively the combined spanwise uniform and periodic heating causes a stronger stabilising effect. These results indicate the possibility of inhibiting/enhancing first Mack modes via a suitable combination of Fourier components in the spanwise distribution
 $S(Z)$.
Growth rates vs the frequency  $\omega$ at various streamwise locations
 $\bar {X}$ for
 $S(Z)=0.5+\cos (2{\rm \pi} Z)$. Thick solid lines:
 $\bar {X}=-1.2$; thick dotted lines:
 $\bar {X}=0$. Different lines in between refer to different streamwise locations with an increment of
 $0.05$.

4.3. Distribution of eigenfunctions
The eigenfunction distributions in the upper and lower decks are of interest as they project distinctive features of the instability modes. Figure 9(a) displays the distribution of the upper-deck pressure at  $\bar {X}=0$ of a radiating mode with
 $\omega =3$ and
 $\beta _{TS}/\beta =1$ for the spanwise distribution
 $S(Z)=\cos (2{\rm \pi} Z)$. Only the real part,
 $(\hat {p}_1(y_1,Z))_r$, is shown since the distribution of the imaginary part looks similar. As is illustrated, the mode radiates an acoustic wave to the far field while undergoing slow attenuation, which is controlled by
 $\alpha _i$. The profiles of several low-order Fourier components
 $(\bar {p}_n(y_1))_r$ are shown in figure 9(b), where
 $n=-1$ represents the radiating component while other components rapidly attenuate exponentially in the region
 $y_1=O(1)$ as shown in figure 9(c,d). That the
 $n=-1$ component emits a sound wave is indicated by (3.28b). For an integer
 $\beta _{TS}/\beta$, there is at least one value
 $n=-q$ ensuring
 $\varLambda _r<0$, and so the
 $n=-1$ component is radiating for modes with
 $\beta _{TS}/\beta =1$ (i.e.
 $q=1$ and
 $K=0$). It is worth noting that the growth rate of the mode shown is rather significant. For modes with reduced growth rates, the radiating character becomes even more prominent (see figure 12). These modes are fundamentally different from the radiating modes identified in high enthalpy boundary layers over a cooled wall (Mack Reference Mack1984; Chuvakhov & Fedorov Reference Chuvakhov and Fedorov2016).
Distributions of  $(\hat {p}_1)_r$ and corresponding Fourier components
 $(\bar {p}_n)_r$ at
 $\bar {X}=0$ for a radiating mode with
 $\omega =3$ and
 $\beta _{TS}/\beta =1$: (a,c) contours of
 $(\hat {p}_1)_r$; (b,d) profiles of
 $(\bar {p}_n)_r$ for several values of
 $n$.

Figure 10 displays the contours of the temperature and velocity disturbances in the  $y_3$–
 $Z$ plane at three streamwise locations,
 $\bar {X}=-1$,
 $-0.5$ and
 $0$, for a mode with
 $\omega =4$ and
 $\beta _{TS}/\beta =0.3$; again, only the real parts,
 $(\hat {T}_3(y_3,Z))_r$ and
 $(\hat {u}_3(y_3,Z))_r$, are shown as representatives. One notes that
 $(\hat {T}_3)_r$ (left column) and
 $(\hat {u}_3)_r$ (right column) feature double- and single-deck structures, respectively. From the upstream to the centre of the elements,
 $(\hat {T}_3)_r$ and
 $(\hat {u}_3)_r$ exhibit qualitatively similar characters, but they both become progressively more concentrated in the spanwise direction with their maxima and minima moving closer to the centreline. This mode exhibits no symmetry about
 $Z=0$. Contours of the eigenfunction of a symmetric radiating mode with
 $\omega =3$ and
 $\beta _{TS}/\beta =1$ are shown in figure 11. A comparison with figure 10 reveals a number of differences between the eigenfunction contours of symmetric and asymmetric modes. The temperature contours of the present symmetric mode again feature two decks of cells, but the cells in each deck remain of the same sign, in contrast to the alternating signs of
 $(\hat {T}_3)_r$ for an asymmetric mode. Within one spanwise wavelength, contours of
 $(\hat {u}_3)_r$ consist of three cells with the central cell being flanked symmetrically by two side ones.
Contours of  $(\hat {T}_3)_r$ (a,c,e) and
 $(\hat {u}_3)_r$ (b,d,f) for
 $\omega =4$ and
 $\beta _{TS}/\beta =0.3$ at three locations
 $\bar {X}=-1$ (a,b),
 $-0.5$ (c,d) and
 $0$ (e,f). Solid and dashed lines represent contours of positive and negative values.

Contours of  $(\hat {T}_3)_r$ (a,c,e) and
 $(\hat {u}_3)_r$ (b,d,f) for a symmetric mode with
 $\omega =3$ and
 $\beta _{TS}/\beta =1$ at three locations
 $\bar {X}=-1$ (a,b),
 $-0.5$ (c,d) and
 $0$ (e,f). Solid and dashed lines represent contours of positive and negative values.

Figures 12 and 13 display the eigenfunction distributions respectively in the upper and lower decks of the mode with  $\omega =3$ and
 $\beta _{TS}/\beta =1$ for the spanwise heating distribution (4.6); the parameters are otherwise the same as those in figures 9 and 11. Figure 12 indicates a more prominent acoustic radiation than that shown in figure 9. As explained earlier, this is due to the fact that the growth rate is reduced by the stabilising effect of heating in this case. Contours of the real parts of disturbance temperature and velocity,
 $(\hat {T}_3(y_3,Z))_r$ and
 $(\hat {u}_3(y_3,Z))_r$, are broadly similar to those in figure 11.
Distributions of  $(\hat {p}_1)_r$ and corresponding Fourier components
 $(\bar {p}_n)_r$ at
 $\bar {X}=0$ for a radiating mode with
 $\omega =3$ and
 $\beta _{TS}/\beta =1$ when heating is of form (4.6): (a,c) contours of
 $(\hat {p}_1)_r$; (b,d) profiles of
 $(\bar {p}_n)_r$ for several values of
 $n$.

Contours of  $(\hat {T}_3)_r$ (a,c,e) and
 $(\hat {u}_3)_r$ (b,d,f) for
 $\omega =3$ and
 $\beta _{TS}/\beta =1$ at three locations
 $\bar {X}=-1$ (a,b),
 $-0.5$ (c,d) and
 $0$ (e,f) when heating is of form (4.6). Solid and dashed lines represent contours of positive and negative values.

5. Summary and conclusions
In this paper we have investigated the impact of streamwise-elongated, spanwise-periodic surface heating on supersonic first Mack modes, whose streamwise and spanwise wavelengths are both of  $O(Re^{-3/8}L)$, which is on the triple-deck scale. We take the spanwise length scale of the heating elements to be of this order, but the streamwise length scale is assumed to be much longer. A simplified system governing the heating-induced streaky flow is then deduced. When Chapman's viscosity law is employed, a remarkably simple similarity solution is found in terms of the Dorodnitsyn–Howarth variable.
In the presence of spanwise-periodic heating elements, the linear stability of the streaky flow is fully compressible in the lower deck with the disturbance temperature and velocity being coupled. The instability is bi-global in its nature. For the viscous instability on the triple-deck scale, this bi-global stability is simplified to a one-dimensional eigenvalue problem in the spanwise direction. Moreover, the instability is shown to be controlled by the spanwise-dependent wall shear  $\lambda _u$ and wall temperature
 $T_w$ only. With
 $T_w$ prescribed and
 $\lambda _u$ obtained analytically from the similarity solution, it was possible to omit the calculation of the streaky flow and focus on the instability directly, which may be considered as the continuation of upstream first Mack modes into the streaky region. The asymptotic approach provides an efficient tool to predict the surface-heating-induced streaky flow, and further to quantify the effect of heating on linear stability. Equally importantly, it reveals a priori the distinctive characteristics of the instability, namely, strong temperature perturbation within the boundary layer and spontaneous radiation of an acoustic wave to the far field.
The reduced eigenvalue problem was solved numerically for an array of spanwise-periodic heating elements whose streamwise and spanwise distributions are taken to be Gaussian and cosine, respectively. Heating of this form stabilises weakly three-dimensional modes in a range of frequencies. Outside of this band, the effect is opposite. For strongly three-dimensional modes, an appreciable destabilising effect is observed for almost all frequencies. Calculations are performed also for the heating elements with a different spanwise distribution which combines spanwise uniform and sinusoidal Fourier components. Apart from the low-frequency modes and high-frequency weakly three-dimensional modes, stabilising effects are found for the heating with this spanwise combination. These results, pertinent to some simplest spanwise distributions of heating, suggest that it is possible to suppress/enhance transition by using this simple active control technique. The required stabilising/destabilising effects may be achieved and optimized by a suitable combination of the Fourier components in the spanwise distribution of the heating source. The destabilising effect might be exploited in scramjet combustor to expedite transition and thereby enhance mixing.
It should be pointed out here that the numerical results summarised above are limited to supersonic flows of moderate Mach number where Chapman's viscosity law is valid. Furthermore, the ratio of the streamwise and spanwise length scales of the heating elements is assumed to be no greater than  ${\textit {Re}}^{3/8}$. It is necessary to extend the analysis and calculations to a more accurate (e.g. Sutherland's) law for viscosity and/or to heating elements which are more elongated than assumed here. Work on these aspects is in progress.
Acknowledgements
The authors would like to thank the reviewers for their comments and suggestions, which have helped us improve the presentation and content of the paper.
Funding
This work was supported by NSFC (grant no. 91952202).
Declaration of interests
The authors report no conflict of interest.
Appendix A
The expressions of  $\phi _1$–
 $\phi _6$ in (3.20) are found as
 \begin{equation} \left.\begin{gathered} \phi_1 = \frac{1}{\mbox{Ai}'(\zeta_0)} \left(\frac{\mu_w}{\text{i}\alpha \lambda_u \rho_w}\right)^{2/3} \left(\frac{\text{i}\alpha \hat{p}_3}{\mu_w}-\frac{1}{\text{i}\alpha\mu_w^2} \frac{\partial \hat{p}_3}{\partial Z}\frac{\partial T_w}{\partial Z}\right)\\ +\left(\frac{\mu_w}{\text{i}\alpha\lambda_u\rho_w}\right)^{2/3} \frac{\rm \pi}{\text{i}\alpha\mu_w^2}\frac{\partial \hat{p}_3}{\partial Z} \frac{\partial _w}{\partial Z}\left(\frac{\text{Gi}(\zeta_0)}{\mbox{Ai}(\zeta_0)}\mbox{Ai}'(\zeta_0) -\text{Gi}'(\zeta_0)\right)-\frac{B_3\zeta_0^2}{4}\\ -\frac{1}{\mbox{Ai}'(\zeta_0)}\left(B_1\zeta_0\mbox{Ai}(\zeta_0)+B_2\zeta_0\text{Gi}(\zeta_0)+ \frac{1}{4}B_4\zeta_0^2\text{Gi}'(\zeta_0)+\frac{B_4-4B_2}{4{\rm \pi}}\right),\\ \phi_2 = B_1-\frac{3}{4}B_3,\quad \phi_3 = B_2-\frac{3}{4}B_4,\quad \phi_4 = \frac{1}{4}B_3,\quad \phi_5 = \frac{1}{4}B_4,\quad \phi_6 = \frac{1}{3}B_5, \end{gathered}\right\} \end{equation}
where
 \begin{equation} \left.\begin{gathered} B_1=\left(\frac{1}{3}\frac{\mu_{wZ}}{\mu_w}-\frac{1}{3} \frac{\rho_{wZ}}{\rho_w}+\frac{2}{3} \frac{\lambda_{uZ}}{\lambda_u}\right)\zeta_0 \varGamma \frac{\partial \hat{p}_3}{\partial Z}\left(\frac{\text{Gi}'(\zeta_0)}{\mbox{Ai}(\zeta_0)}- \frac{\text{Gi} (\zeta_0)\mbox{Ai}'(\zeta_0)}{\mbox{Ai}^2(\zeta_0)}\right)\\ +\left(\frac{1}{3}\frac{\mu_{wZ}}{\mu_w}+\frac{2}{3}\frac{\rho_{wZ}}{\rho_w}+\frac{5}{3} \frac{\lambda_{uZ}}{\lambda_u}\right)\varGamma \frac{\partial\hat{p}_3}{\partial Z}\frac{\text{Gi}(\zeta_0)}{\mbox{Ai}(\zeta_0)} -\varGamma \frac{\partial^2\hat{p}_3}{\partial Z^2}\frac{\text{Gi}(\zeta_0)}{\mbox{Ai}(\zeta_0)},\\ B_2={-}\left(\frac{1}{3}\frac{\mu_{wZ}}{\mu_w}+\frac{2}{3}\frac{\rho_{wZ}}{\rho_w} +\frac{5}{3}\frac{\lambda_{uZ}}{\lambda_u}\right)\varGamma\frac{\partial \hat{p}_3}{\partial Z} +\varGamma\frac{\partial^2 \hat{p}_3}{\partial Z^2},\\ B_3=\left(\frac{1}{3}\frac{\mu_{wZ}}{\mu_w}-\frac{1}{3}\frac{\rho_{wZ}}{\rho_w} +\frac{2}{3}\frac{\lambda_{uZ}}{\lambda_u}\right)\varGamma \frac{\partial\hat{p}_3}{\partial Z} \frac{\text{Gi}(\zeta_0)}{\mbox{Ai}(\zeta_0)},\quad B_4={-}B_3\frac{\mbox{Ai}(\zeta_0)}{\text{Gi}(\zeta_0)}, \end{gathered}\right\} \end{equation}
with
 \begin{equation} \varGamma=\frac{\rm \pi}{\text{i}\alpha\mu_w}\left(\frac{\mu_w} {\text{i}\alpha\lambda_u\rho_w}\right)^{2/3}. \end{equation}



