Introduction
A high-intensity pulsed ion beam (HIPIB) is a unique tool for the modification of metal products. It provides high rates of heating and subsequent cooling of the near-surface layer that exceeds 107–109 K/s. In this case, solid solutions and secondary phases are formed, which are not typical for the equilibrium phase diagram. In addition, at high energy densities, ablation of the target material occurs and shock waves of recoil are formed within it, reaching a pressure of 0.5 GPa (Bystritskii and Didnko, Reference Bystritskii and Didenko1989; Boyko et al., Reference Boyko, Skvortsov, Fortov and Shamanin2003). This method is more effective in modifying the structure and properties of the surface layer of metal products than hardening, forging and so on (Proskurovsky et al., Reference Proskurovsky, Rotshtein, Ozur, Ivanov and Markov2000).
At an ion current density of 200–300 A/cm2 and a pulse duration of 100–150 ns, the ion flux per pulse is ≈1014 cm−2. The range of ions with an energy of 200–300 keV in metals does not exceed 1 µm, and their concentration in the near-surface layer is <1018 cm−3 (the concentration of iron atoms is 8.5 × 1022 cm−3). In this case, the HIPIB energy density is 5–10 J/cm2 and the main factor determining the change in the properties of the product under the HIPIB irradiation is, therefore, the thermal effect, rather than the implantation of ions. However, in many works devoted to the HIPIB modification of metal products, the parameters of the ion beam are controlled by the amplitude of the ion current density pulse (Wen et al., Reference Wen, Liu, Wang, Zhang, Zhu and Lei2012; Kovivchak et al., Reference Kovivchak, Panova, Krivozubov, Davletkil'deev and Knyazevet2013).
Thermal imaging diagnostics is an effective method of operational control of HIPIB energy density (Davis et al., Reference Davis, Bartsch, Olson, Rej and Waganaar1997; Isakova and Pushkarev, Reference Isakova and Pushkarev2018). It allows us to measure the total energy of the HIPIB and the energy density distribution over the cross section, to optimize the operation of the ion diode and to monitor the irradiation mode of the target. The sensitivity of the thermal imaging diagnostics is sufficient to record a thermal imprint formed on the target after each HIPIB pulse. For an infrared camera sensitivity of 0.2 °C, the minimum energy density for a 0.1 mm thick stainless steel target is 0.03 J/cm2.
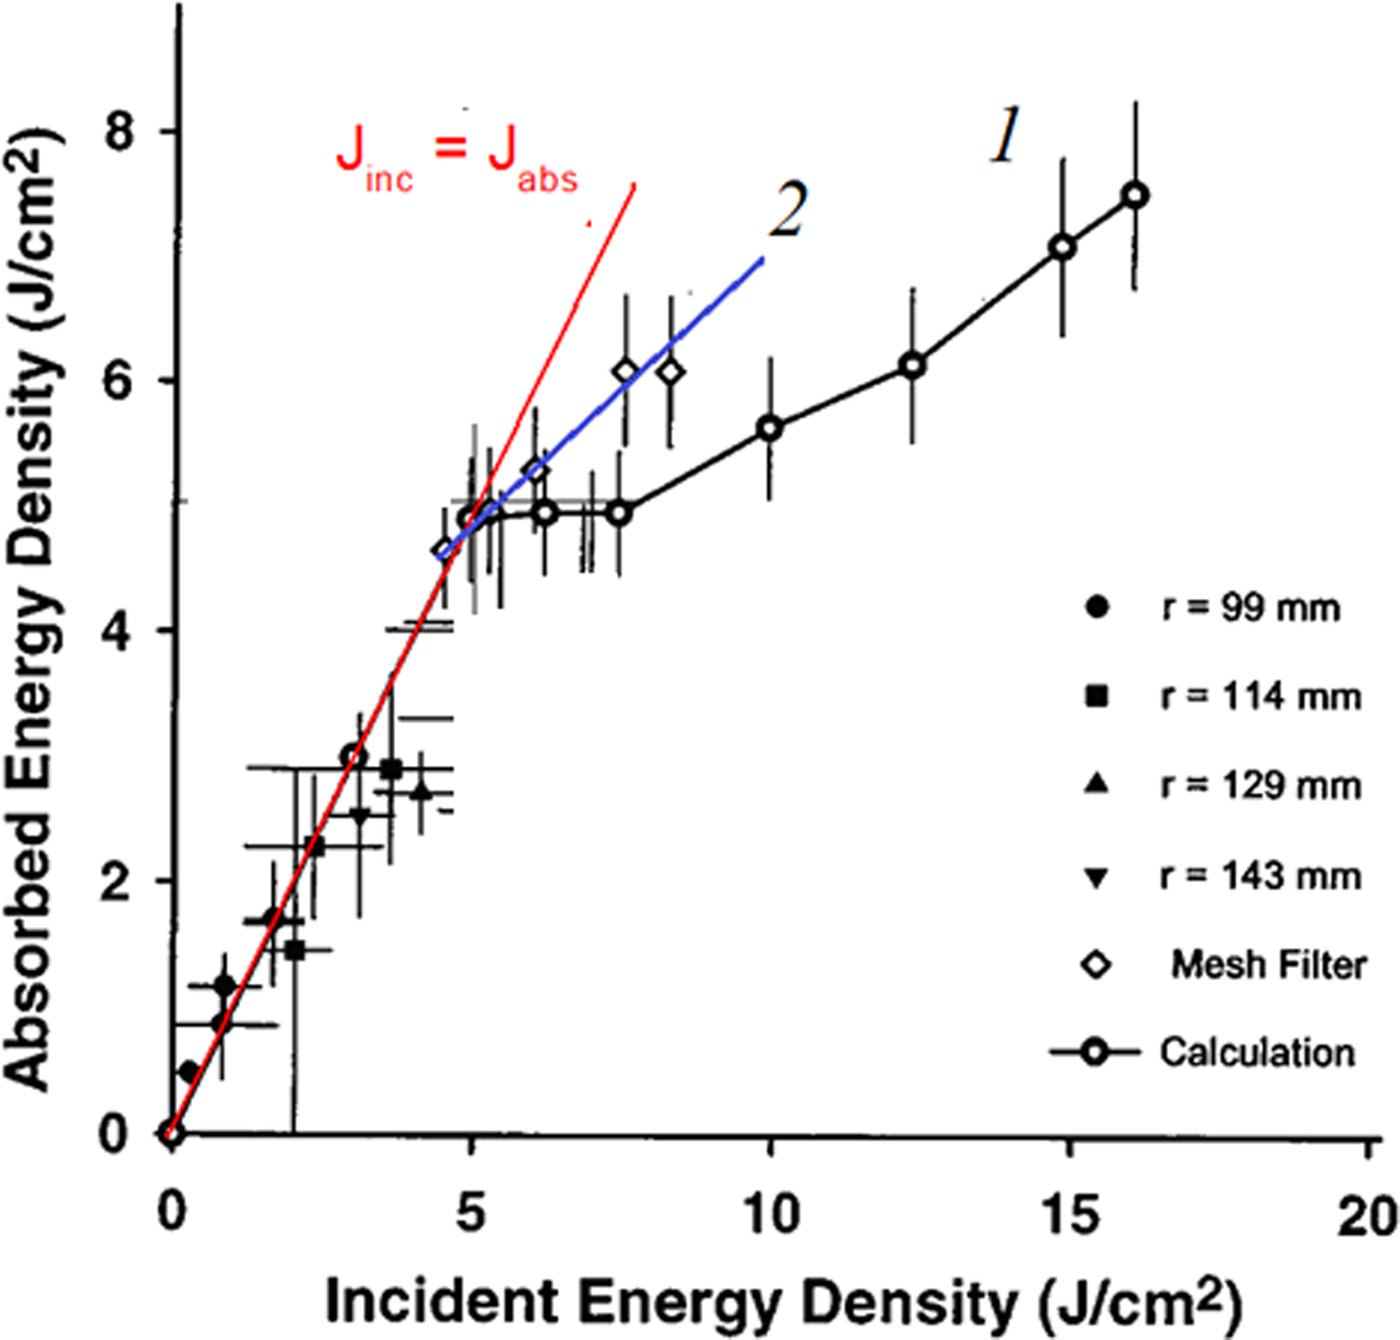
Of great interest is the control of HIPIB parameters with high energy density, as this is required for the modification of metal products. However, with an increase in the HIPIB energy density, ablation of the target material takes place, which limits the measurement range of thermal imaging diagnostics. Davis et al. (Reference Davis, Bartsch, Olson, Rej and Waganaar1997) a metal mesh was used to extend the measurement range, and the results of thermal imaging measurements were then adjusted for transparency (see Fig. 1).
Dependence of the energy density measured by an infrared camera on the incident energy density: (1) Without a grid on the target; and (2) with a grid (Davis et al., Reference Davis, Bartsch, Olson, Rej and Waganaar1997).

Davis et al. (Reference Davis, Bartsch, Olson, Rej and Waganaar1997) present the results of measuring the HIPIB energy density by two methods: using thermal imaging diagnostics (i.e. the absorbed energy density), and using the ion current density (i.e. the incident energy density, which is equal to the integral of the product of the ion current density and the accelerating voltage). The results showed that at high energy densities (j > 5 J/cm2, see Fig. 1), the transparency of the metal grid is reduced, and the data produced by the two methods to determine the energy density are significantly different.
The transparency of the metal mesh can vary due to the bridging of the spaces between the mesh wires by plasma, especially at low optical transparency of the grid. Renk et al. (Reference Renk, Harper-Slaboszewicz, Mikkelson, Ginn, Ottinger and Schumer2014) observed the underestimation of ion current density measurements using a Faraday cup, due to the closure of the collimating aperture by ablation plasma. In addition to reducing the optical transparency of the metal mesh under HIPIB irradiation, additional focusing of the ion beam may occur. We observed additional ions focusing by its own space charge at metal grid installation in the ion beam transport region (Zhu et al., Reference Zhu, Ding, Zhang, Isakova, Prima, Pushkarev and Lei2018).
Another experimental approach to extending the measurement range of thermal imaging diagnostics is to use the scattering of the ion beam after passing through a collimating hole in the target (Davis et al., Reference Davis, Bartsch, Olson, Rej and Waganaar1997; Isakova and Pushkarev, Reference Isakova and Pushkarev2018). When the ion beam is scattered after passing through the hole in the first target, the energy density falling on the second target decreases to below the ablation threshold, which should provide a correct measure of the total energy of the beam passing through the collimating hole and allow us to calculate the average energy density incident on the first target in the region of the hole. However, this method does not allow us to measure the energy density distribution of the beam over the cross-section and to determine its total energy.
At ion energy of <100 keV, the formation of radiation-induced defects is the main mechanism for dissipation in metal targets (Trushin, Reference Trushin2000; Sigmund, Reference Sigmund2014). The formation of these defects can be used to extend the measurement range of the HIPIB energy density by thermal imaging diagnostics. The migration of radiation defects in metals has a low activation energy, which ensures high mobility even at room temperature. As a result, a significant proportion of the radiation defects arising during HIPIB irradiation may leave the target ablation area. In subsequent annealing, these will contribute to the heating of the target, which will provide an extension of the HIPIB energy density measurement range. The purpose of this study is to analyze the influence of the formation, migration, and annihilation of radiation-induced defects in the target on the measurement of HIPIB energy density, and the choice of material and thickness of the target for which the measurement range of thermal imaging diagnostics is greatest.
Experimental setup
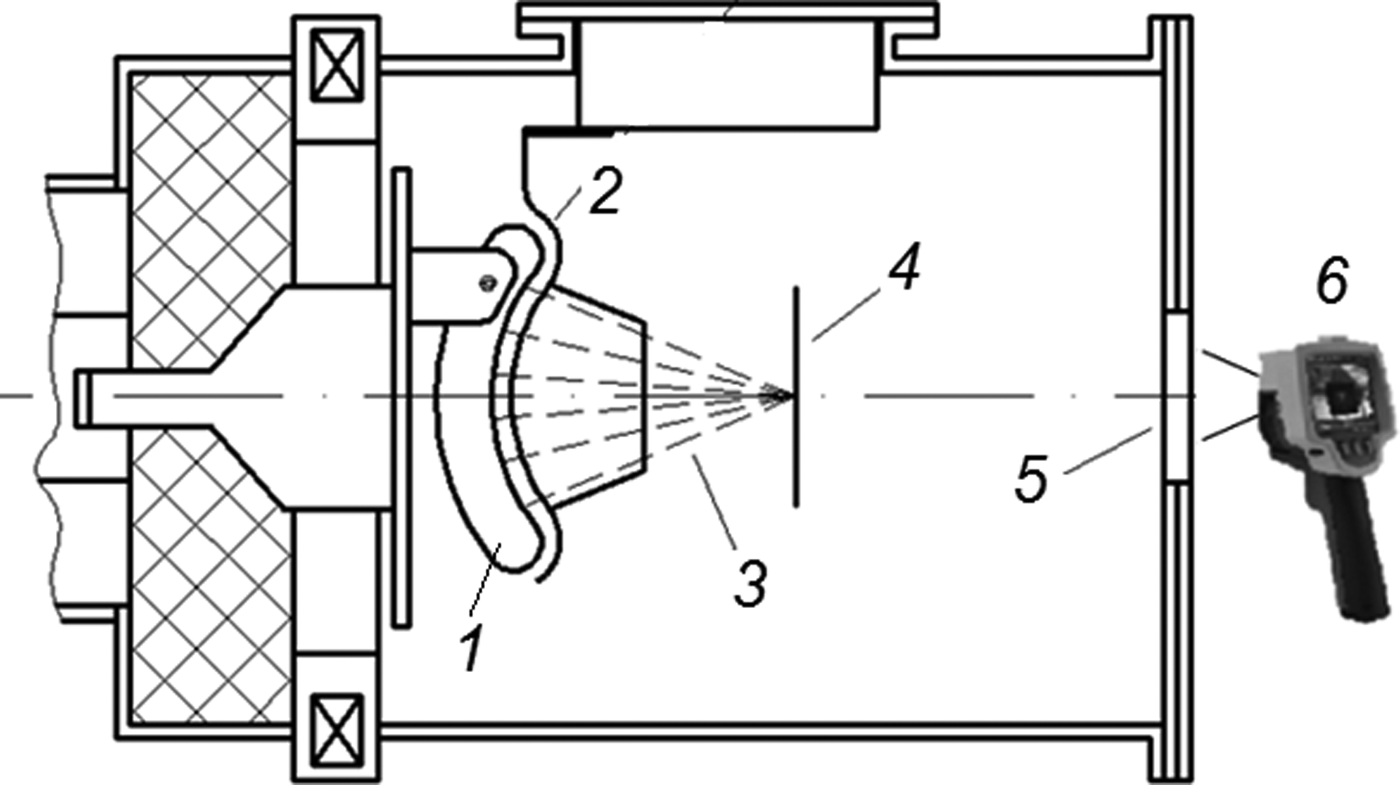
Experiments were conducted using the TEMP-6 accelerator (Zhu et al., Reference Zhu, Lei and Ma2002), which consists of a Marx generator, a pulse-forming line (PFL) and a vacuum ion diode with self-magnetic insulation of electrons. The diode assembly is shown in Figure 2.
Scheme used for ion beam generation (1 – anode, 2 – cathode, 3 – ion beam) and energy density measurement (4 – target, 5 – BaF2 window, 6 – infrared camera).

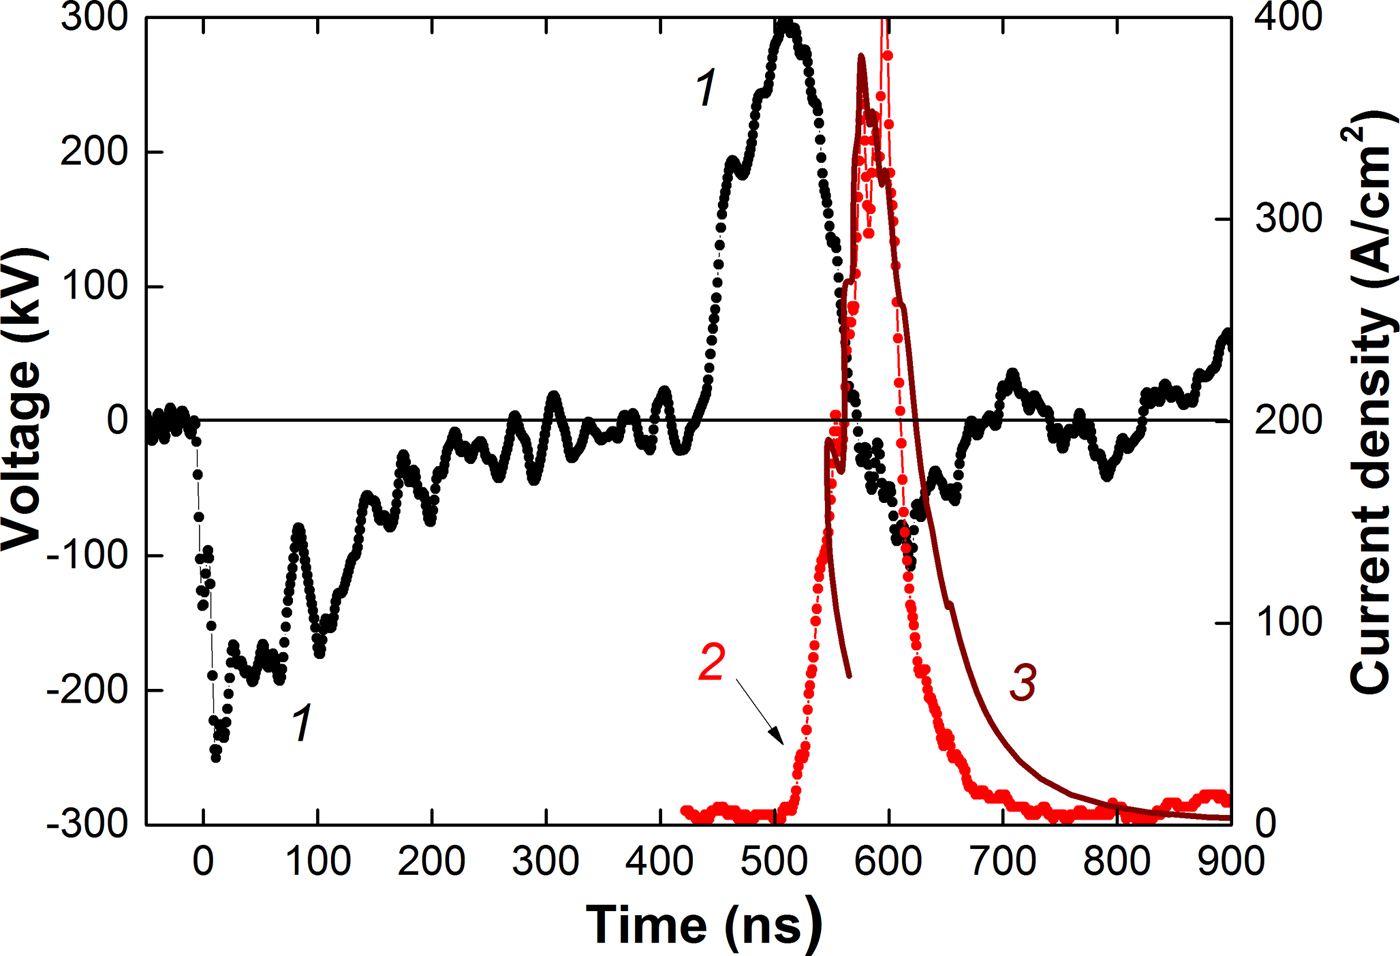
The accelerator is configured in bipolar pulse operation mode, and forms two pulses with opposite polarity: The first pulse has negative polarity (for plasma formation), and this is followed by a second pulse with positive polarity (150 ns, 250–300 kV). Figure 3 shows characteristic waveforms and the results of time-of-flight diagnostics for HIPIB composition (Pushkarev et al., Reference Pushkarev, Isakova, Xiao and Khailov2013).
Waveforms of (1) accelerating voltage; (2) experimental ion current density (points); and (3) calculated current density of C + ions (line).

The voltage at the PFL output was measured with a voltage divider, which was installed in the transition chamber between the PFL and the diode unit. The current at the PFL output was measured using a Rogowski coil. Electric signals from the sensors were recorded with a Tektronix DPO 2024B oscilloscope (200 MHz, 5 × 10⁹ readings/s). A TEMP-6 accelerator provided high stability for the HIPIB parameters in a series of pulses in which the standard deviation of the energy density in the focus of the diode did not exceed 10% over a series of 25–30 pulses (Pushkarev et al., Reference Pushkarev, Isakova, Xiao and Khailov2013; Zhu et al., Reference Zhu, Ding, Zhang, Isakova, Prima, Pushkarev and Lei2018).
In our analysis of the ion beam parameters, we used the thermal imaging diagnostics of the beam energy density (with a spatial resolution of 1–2 mm) (Isakova and Pushkarev, Reference Isakova and Pushkarev2018), as shown in Figure 2, and the time-of-flight diagnostics of its compositions (with a time resolution of 1 ns) (Pushkarev et al., Reference Pushkarev, Isakova and Prima2018). The ion beam formed by the diode with a graphite anode consists of carbon ions (80–90%) and protons, as shown in Figure 3.
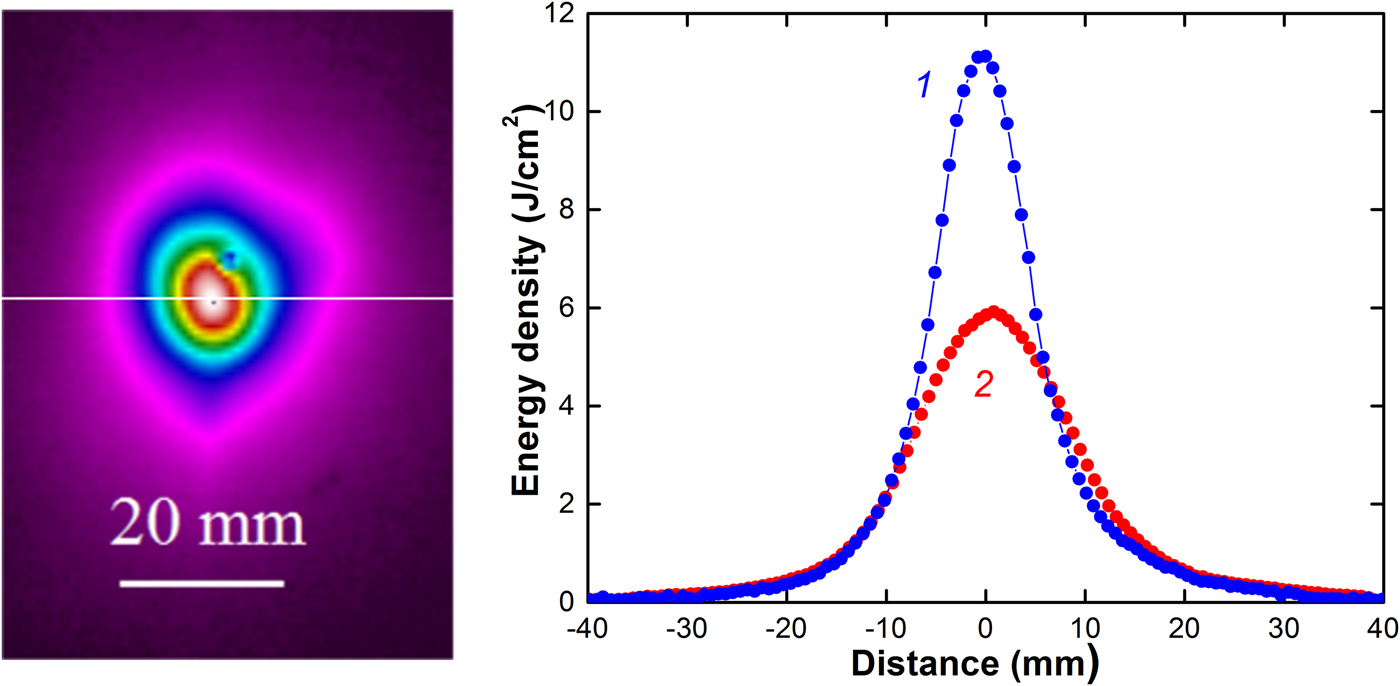
The HIPIB thermogram was registered using a Fluke Ti400 infrared camera in video mode, with a step of 0.1 s. The delay between HIPIB generation and thermogram registration was 0.1 s. Figure 4 shows a HIPIB thermogram for a 0.1 mm stainless steel target placed in the diode focus, and the distribution of the energy density of the beam.
HIPIB thermogram and energy density distribution in the diode focus in the horizontal direction: (1) HIPIB filtered with a mesh (after correction); and (2) without a mesh.

Targets (125 × 150 mm2) made from different materials were placed 135 mm downstream from the cathode, in the diode focus. The HIPIB energy density is:
 $$J_{\exp }(x,y) = c_vd{\rm \rho} K[T(x,y)-T_{0}],\;J/{\rm c}{\rm m}^2$$
where c v is the specific heat of the solid target, ρ is the density of the target material, d is the thickness of the target, Т 0 is the initial temperature of the target, Т(x,y) is the temperature of the target within 0.1 s after HIPIB irradiation, and K is the optical transparency of the grid.
To eliminate the target ablation at a distance of 2–3 mm upstream of the target, we installed a filtering mesh made from stainless steel. The energy density was calculated taking into account the optical transparency of the mesh (K = 50%, see Fig. 4, curve 1).
Some experiments were performed on targets with dimensions that were much smaller than the transverse dimensions of the HIPIB. A disc of stainless steel (or other metal) with a diameter of ≈10 mm was installed in the central hole of a large stainless steel target and fixed with thin wires 0.1 mm in diameter. This design of the small target ensured uniform heating and eliminated energy losses due to thermal conductivity.
After heating the front of the target using the ion beam, we measured the temperature on the reverse using an infrared camera, as shown in Figure 2. For a 0.1 mm stainless steel target, the time for temperature equalization along its depth is <10 ms (Yu et al., Reference Yu, Shen, Qu, Zhong, Zhang, Zhang, Yan, Zhang, Zhang and Le2015b). A Fluke Ti400 infrared camera was used to register a thermal image of the target only 0.1 s after HIPIB generation (due to a hardware delay). Heat transfer along the depth of the target does not, therefore, introduce a large error into the measurement of HIPIB energy density by thermal imaging diagnostics. The cooling of the target due to thermal radiation and the blurring of the thermal image due to the thermal conductivity of the target over 0.1 s are insignificant.
Calculation of the threshold energy density
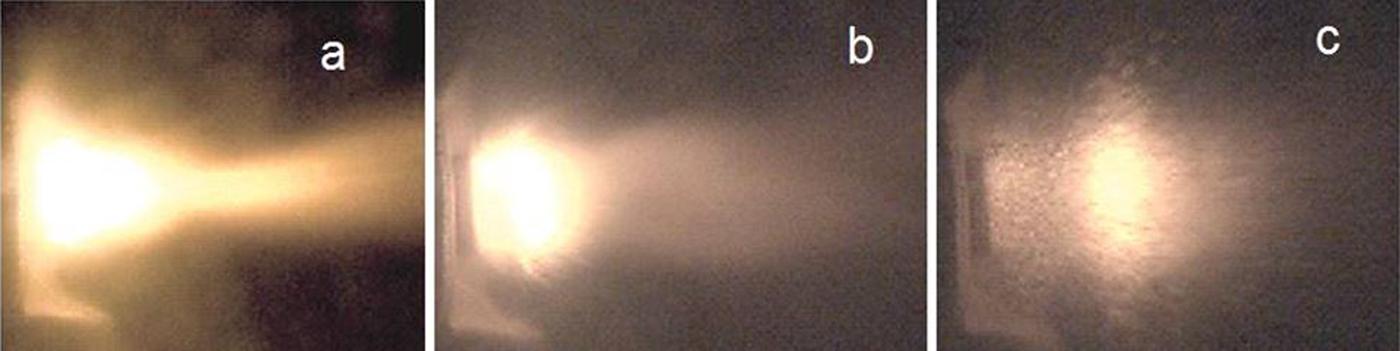
The maximum energy of an ion beam that can be registered by thermal imaging diagnostics is limited by the ablation of the surface layer of the target and is equal to the sum of the energy required to heat the near-surface layer of the target to melting, on melting and to heat from melting to boiling. Figure 5 shows that under HIPIB irradiation using the TEMP-6 accelerator, intensive ablation of the target material occurs. A target of size 10 ×10 mm2 is located to the left, and the ion diode to the right. Images were captured by means of a Phantom MultiCam high-speed camera, with a frame rate of 1 µs.
Ablation of an Al target registered at (a) 0.01 ms; (b) 0.1 ms; and (c) 0.38 ms after HIPIB irradiation.

The range of С + ions with energy 200–300 keV in a metal target does not exceed 0.3 µm and the pulse duration of the ion current is 150 ns (see Fig. 3). Under HIPIB irradiation, only the surface layer of the target is heated. The HIPIB energy density required to heat the near-surface layer of the target to the melting point is:
 $$J_{{\rm h}1} = c_v{\rm \rho} {\rm \lambda} [T_{{\rm melt}}-T_0],\;\quad J/{\rm c}{\rm m}^2$$
where λ is the depth of target heating during HIPIB irradiation, T melt is the temperature of the target melting, and T 0 is the initial temperature of the target.
The HIPIB energy density necessary to melt the near-surface layer of the target is:
 $$J_{{\rm melt}} = E_{{\rm melt}}{\rm \rho} {\rm \lambda}, \;\quad J/{\rm c}{\rm m}^2$$
where E melt is the specific heat of melting of the target material.
The HIPIB energy density necessary to heat the surface layer of the molten target to the boiling temperature is equal to:
 $$J_{h2} = c_{v2}{\rm \rho} {\rm \lambda} [T_b-T_{{\rm melt}}],\;\quad J/{\rm c}{\rm m}^2$$
where с v2 is the specific heat of the boiling target, and T b is the equilibrium boiling temperature of the target.
To calculate the ablation threshold of the target (J th = J h1 + J melt + J h2), it is necessary to determine the depth of heating under HIPIB irradiation. When the pulse duration is τ = 150 ns (see Fig. 3) and the thermal diffusivity of stainless steel is a = 1.5 × 10⁻⁵ m2/s, the target heating depth (the depth at which the temperature decreases by a factor of 2.72 in comparison with the surface temperature) is λ = (a·τ)0.5 = 1.5 µm. For a copper target, λ = 4.1 µm.
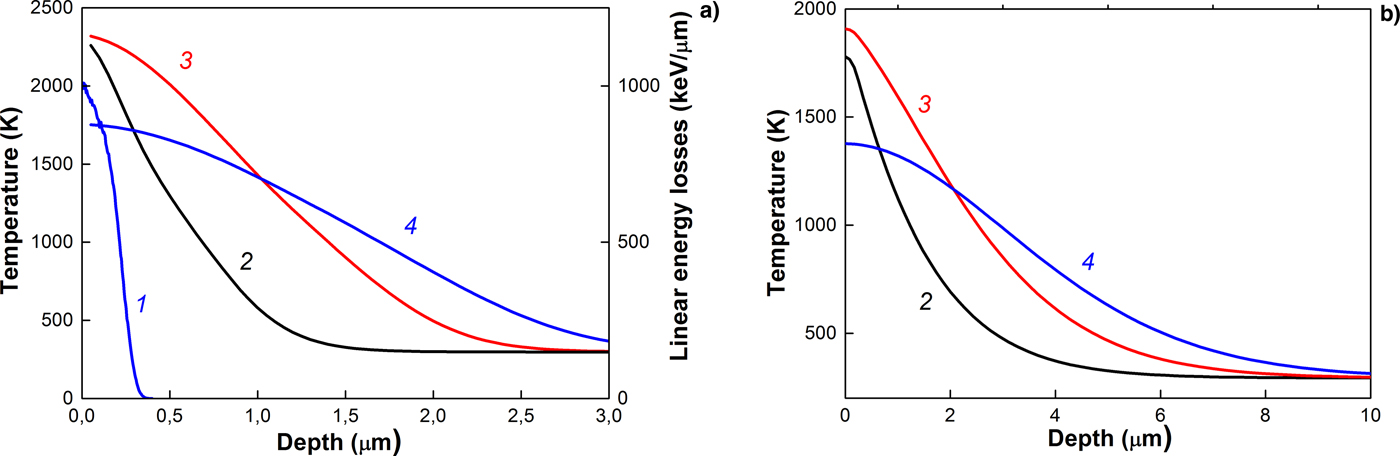
The results of simulating the heating of a target by an ion beam are confirmed by the values obtained for the depth of heating. Figure 6 shows the results of simulation of the temperature distribution over the depth of a target irradiated with an ion beam (70% C + + 30% H +) with an ion energy of 200 keV (Pushkarev et al., Reference Pushkarev, Isakova, Xiao and Khailov2013; Zhu et al., Reference Zhu, Ding, Zhang, Isakova, Prima, Pushkarev and Lei2018).
Linear energy losses of C + ions (1) and temperature distributions in (a) stainless steel and (b) copper; targets irradiated with an ion beam for different times after the onset of irradiation: (2) 50 ns; (3) 75 ns; and (4) 100 ns.

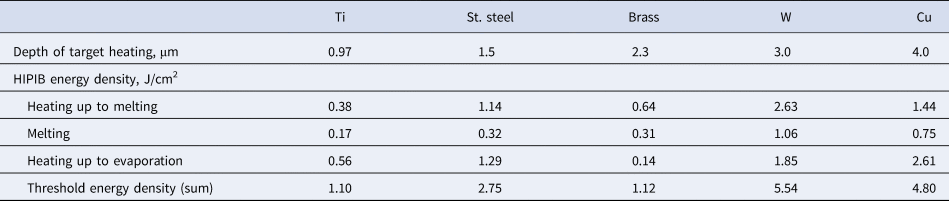
The phase transformation energy was not taken into account. Simulation was carried out using the COMSOL Multiphysics program for the following parameters: A pulse duration of 100 ns; a Gaussian pulse shape; and an ion beam energy density of 1 J/cm2 (for stainless steel) and 2 J/cm2 (for Cu). The results of the calculation of the beam energy density in Eqs. (2)–(4) for different targets are shown in Table 1.
Calculation of threshold energy density

In this calculation, we took into account the target heating depth for the highest heating of the target surface (line 3 in Fig. 6). This calculation gives the upper limit on the threshold energy density since when calculating the HIPIB energy density required to heat the near-surface layer of the molten target to the boiling point, we took into account the target heating depth, which is greater than the melting depth.
The obtained values are close to those obtained from the modeling of HIPIB heating of a target Yu et al. (Reference Yu, Shen, Qu, Liu, Zhong, Zhang, Zhang, Yan, Zhang, Zhang and Le2015a). These authors calculated the temperature evolution on the front surface of 304 stainless steel under HIPIB irradiation with different energy densities, without taking the heat of fusion into account. When the energy density reached 2.5 J/cm2, the maximum temperature of the target surface reached its boiling point. In Table 1, for stainless steel J h1 + J h2 = 2.43 J/cm2.
Experimental energy density measurements
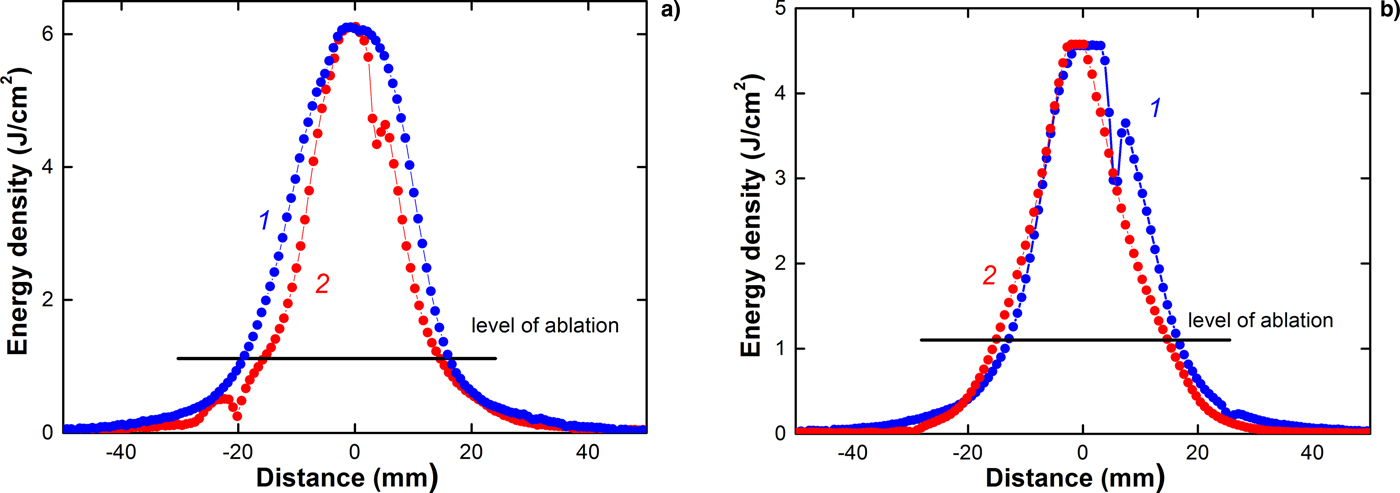
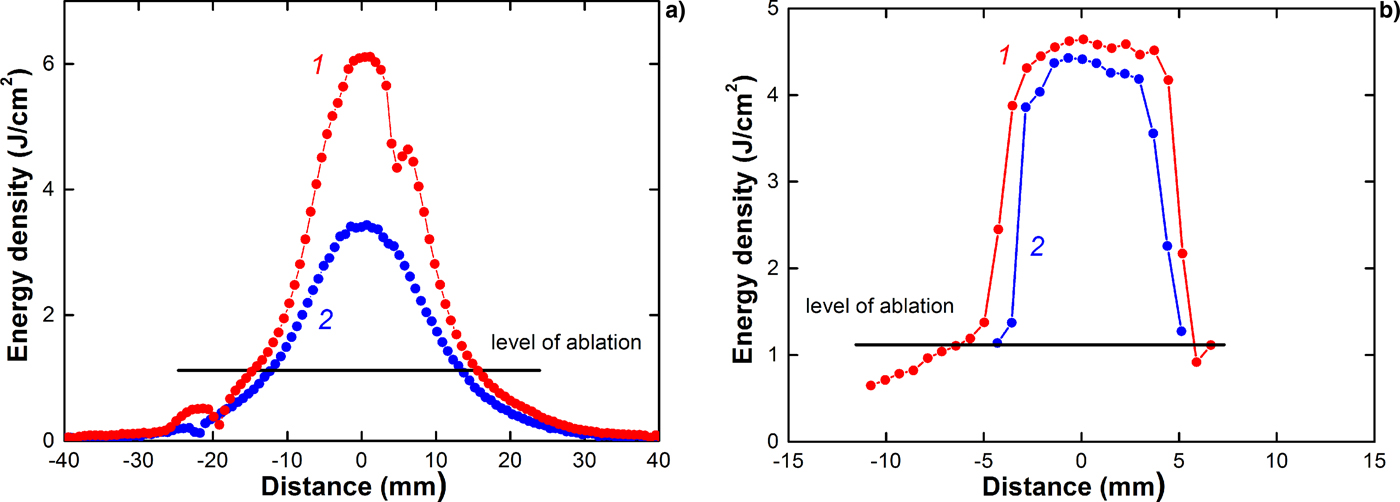
Our observations show that the maximum energy density measured with the thermal imaging diagnostics without the mesh considerably exceeds the calculation of threshold energy density, as shown in Figures 4 and 7.
HIPIB energy density distribution in the focus in the (1) vertical and (2) horizontal directions. Large targets of (a) brass 75 µm and (b) titanium 50 µm were used.

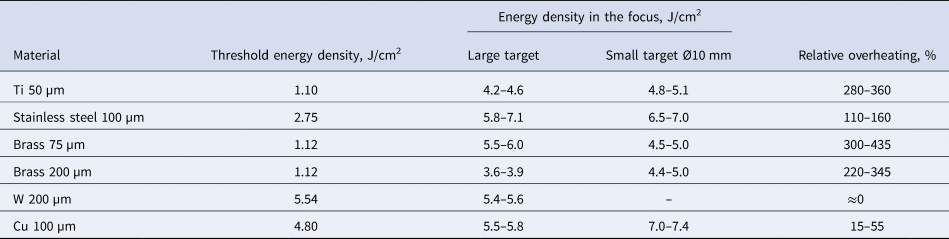
This was observed for all investigated materials, except tungsten, see Table 2.
HIPIB energy density in the focus

Relative overheating was calculated as:
 $$R = \displaystyle{{100(J_{\max} -J_{{\rm th}})} \over {J_{{\rm th}}}},\;\% $$
where J max is the HIPIB energy density in the focus, and J th is the threshold energy density.
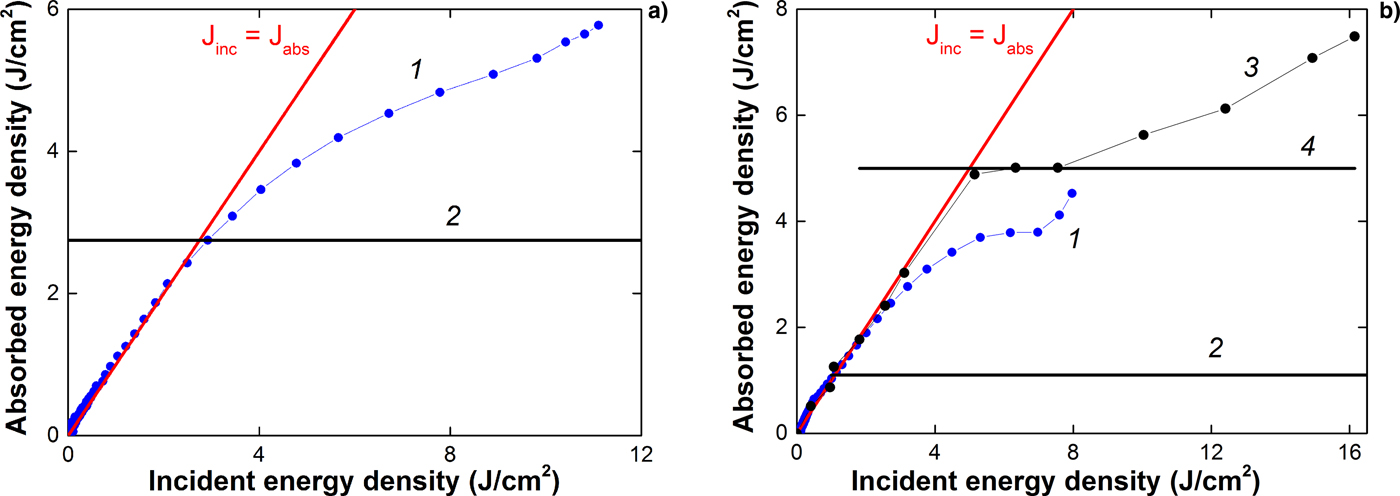
The obtained experimental data allow us to determine the relationship between the energy density absorbed by the target, and the incident energy density, similarly to Figure 1. We, therefore, measured the distribution of HIPIB energy density over the cross section when the beam energy was reduced (filtered) using a metal mesh (incident energy density), and without the mesh (absorbed energy density), see Figure 4. The results are shown in Figure 8.
Dependence of (1) the absorbed energy density and (2) the threshold energy density on the incident energy density. Targets made from (a) stainless steel and (b) titanium were used. Results from Davis et al. (Reference Davis, Bartsch, Olson, Rej and Waganaar1997) are shown by lines (3) and (4).

Similar results for the overheating effect in a 0.64-mm-thick titanium target under HIPIB irradiation (400 kV, 30 kA, duration 0.5 µs) are presented by Davis et al. (Reference Davis, Bartsch, Olson, Rej and Waganaar1997) (see Figs 1 and 8b). The incident energy density was derived by multiplying the ion current density (measured by a Faraday cup) with the voltage at the diode and integrating the product over time.
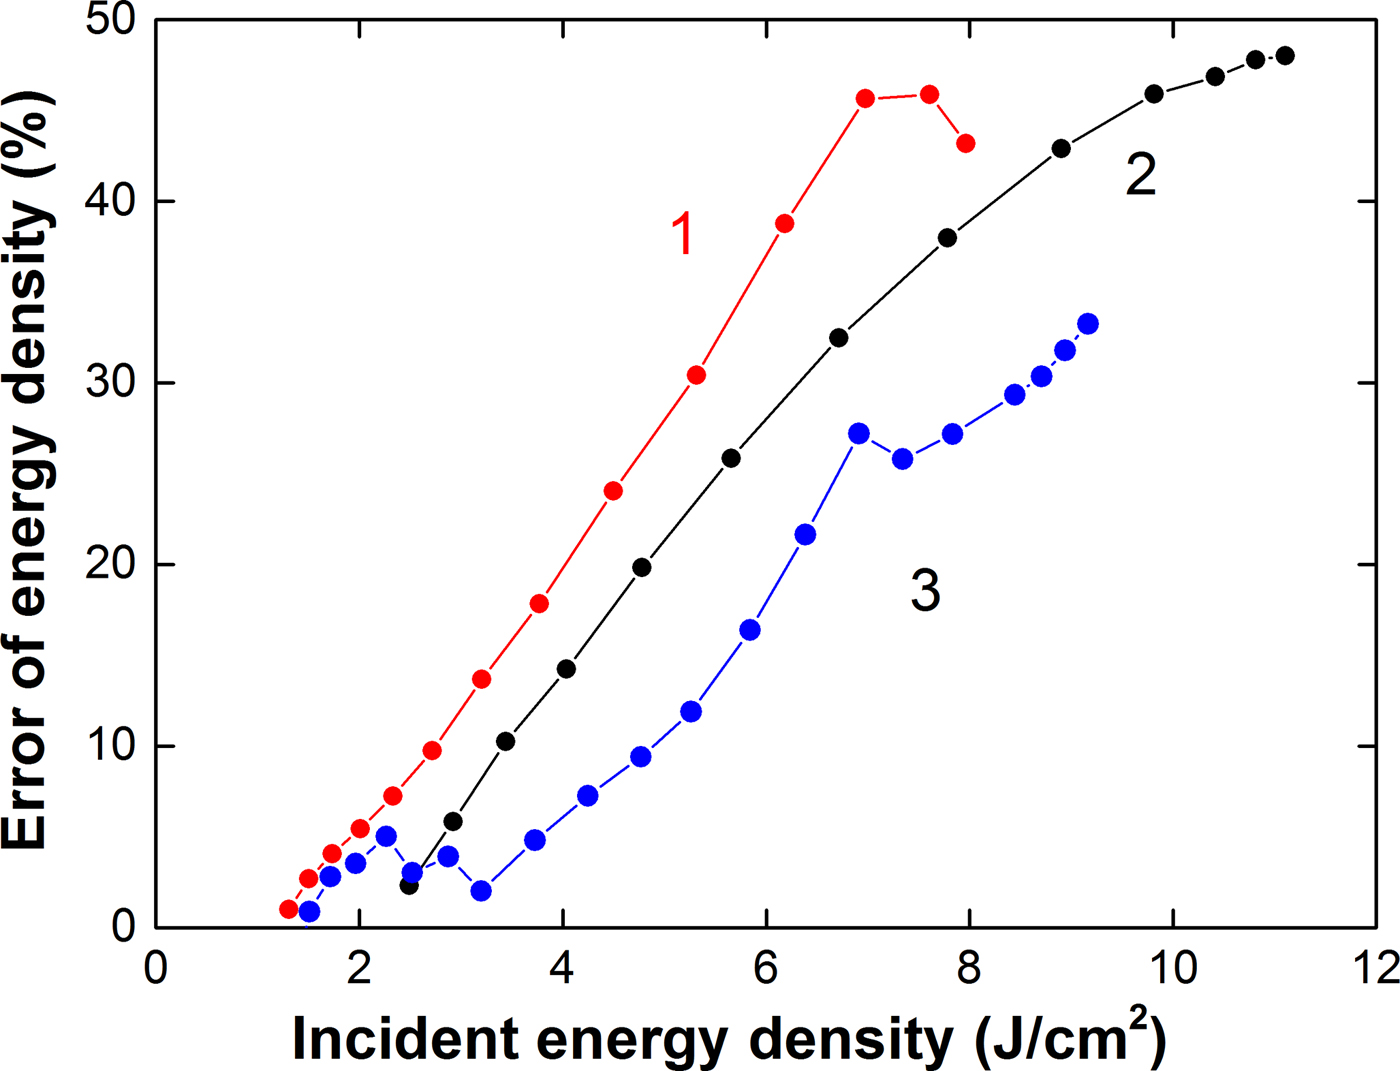
The overheating effect of the target under HIPIB irradiation expands the range of measurement of the energy density with the thermal imaging diagnostics but introduces an error into the results of measurement (J abs < J inc). At an energy density >10 J/cm2, this error exceeds 45%, as shown in Figure 9.
Dependence of the error in the energy density measurement on HIPIB energy density for targets made from (1) titanium; (2) stainless steel; and (3) brass.

The error is calculated as:
 $${\rm \delta} = \displaystyle{{100(J_{{\rm inc}}-J_{{\rm abs}})} \over {J_{{\rm inc}}}},\;\% $$
where J inc is the incident energy density of HIPIB, and J abs is the absorbed energy density.
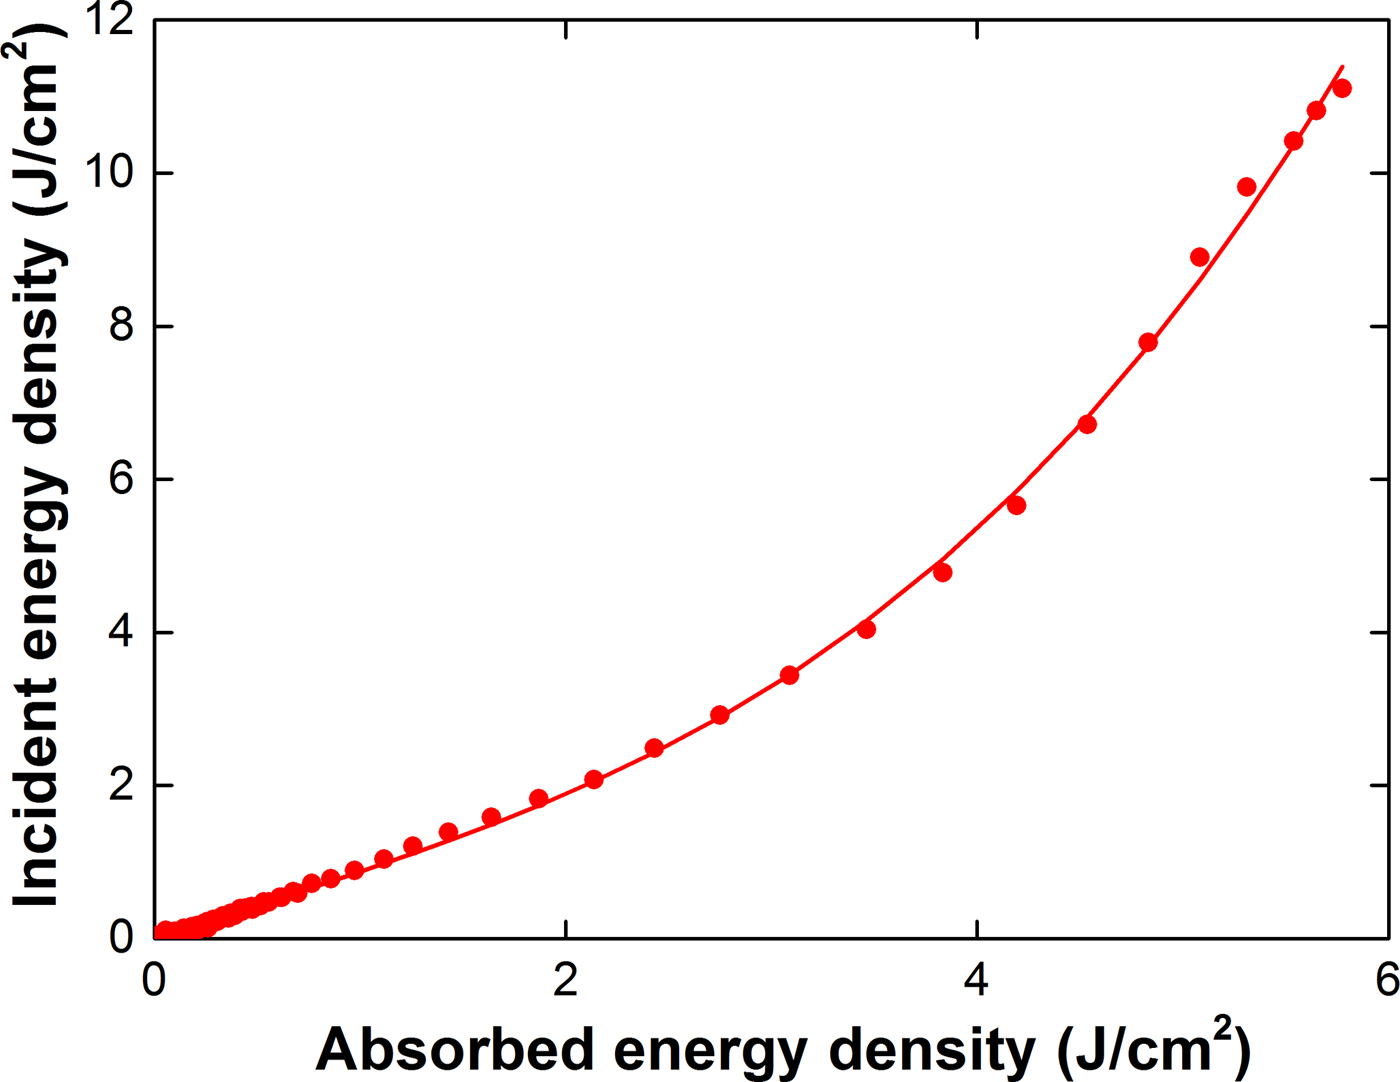
To correct the results of thermal imaging diagnostics of a pulsed ion beam under conditions of intense ablation of the target material, it is possible to use the calibration dependence obtained from the results of measuring the HIPIB energy density with and without a mesh filter (see Fig. 10).
Dependence of the incident energy density on the absorbed energy density in the stainless steel target.

The use of a calibration curve instead of a metal mesh on the target extends the range of ion beam energy density measurement.
Discussion
The effects of the target overheating under HIPIB irradiation can be connected with the metastable overheating (above its equilibrium boiling temperature) of the molten surface layer during rapid heating (above 3 × 10¹⁰ K/s, see Fig. 6). The experimental data on the overheating of liquid metals at a heating rate of 108–1010 K/s, obtained by heating the wire with a pulsed electric current, are given by Martyniuk (Reference Martyniuk1999). The relative excess temperature varied from 21% (Al) to 114% (Cd). This value was 66% for copper and 110% for tungsten and remained unchanged at a heating rate of (2–80)·109 K/s (Martyniuk, Reference Martyniuk1999). The relative excess temperature was calculated as:
 $$R_{\rm T} = \displaystyle{{100(T_{\max} -T_{\rm b})} \over {T_{\rm b}}},\;\% $$
where T max is the temperature at the initial point of the wire explosion, and T b is the equilibrium boiling temperature of the wire material.
In the process of pulsed laser heating of a metal target, a thin near-surface layer of the metal melts, and in the liquid state overheats to above its boiling point (Upadhyay et al., Reference Upadhyay, Inogamov, Bärbel and Urbassek2008). At a sufficiently high radiation flux density, overheating is accompanied by entry into the region of the metastable liquid phase. However, over the duration of a laser pulse of more than 1–5 ns, the overheating does not exceed a critical temperature [phase transition spinodal (Martyniuk, Reference Martyniuk1999)] and the relative excess temperature is <125%.
However, our study shows that the overheating of most targets during HIPIB irradiation is much higher than the values obtained by pulsed heating of metal wires with an electric current or a pulsed laser (see Table 2). In addition, the overheating of a target under HIPIB irradiation depends on its size and thickness. When the thickness of a large brass target decreases, its overheating increases (see Fig. 11).
HIPIB energy density distribution in the focus in the horizontal direction, measured using (a) large and (b) small brass targets, (1) 75 µm and (2) 200 µm in thickness.

The thickness of the molten target layer does not exceed 1–2 µm (see Fig. 6). An increase in the thickness of the target from 75 to 200 µm should not affect the evaporation process. However, when the thickness of the large brass target is reduced from 200 to 75 µm, the target overheating increases from 110–160% to 300–435%. The change in the thickness of a small target does not affect the overheating, which reaches 350% (see Fig. 11b and Table 2).
The effect of target overheating under HIPIB irradiation can be connected with the formation, migration, and subsequent annealing of fast radiation-induced defects. At ion energy of <200 keV, the elastic (nuclear) mechanism of its deceleration in the target is realized by the formation of radiation-induced defects. These have high mobility in metals, and their characteristic time constant for dominant dynamic annealing in Si at room temperature is about 6 ms (Myers et al., Reference Myers, Charnvanichborikarn, Shao and Kucheyev2012). The activation energy of migration of interstitial atoms in metals is lower than the activation energy of migration of vacancies (Michio et al., Reference Michio, Hikoshi, Koji and Eiichi Fujita1979; Sigmund, Reference Sigmund2014). Molecular dynamics simulations (Wirth et al., Reference Wirth, Odette, Maroudas and Lucas2000; Terentyev et al., Reference Terentyev, Malerba and Hou2007) and elastic model methods (Ohsawa and Kuramoto, Reference Ohsawa and Kuramoto2005) show that in pure iron, the activation energy of migration of interstitial atoms is 0.05–0.10 eV, and in titanium 0.08–0.11 eV (Mendelev et al., Reference Mendelev, Underwood and Ackland2016). The presence of impurities increases the threshold energy of migration of interstitial atoms (Satoh et al., Reference Satoh, Sohtome, Abe, Matsukawa and Kano2017). In a study of changes in the resistivity of SS316L and EP838 stainless steel after irradiation with an electron beam (Van Renterghem et al., Reference Van Renterghem, Mazouzi and Dyck2011), it was found that the activation energy of migration of interstitial atoms was 0.30–0.33 eV. This corresponds to a threshold temperature for migration defects of 200–300°С.
In the surface layer of a target, the temperature is very high (see Fig. 6), which leads to the fast migration of some of the radiation defects from the ablation layer of the target and the subsequent allocation of the energy under annealing. The thickness of the surface layer of a target which melts and evaporates under the influence of HIPIB irradiation does not exceed 1 µm (see Fig. 6), and the migration of radiation defects does not, therefore, require a lot of time.
Our study shows that the radiation-induced defects formed in the target under HIPIB irradiation have a considerable influence on the target cooling. The experimental power of the energy loss from the target is less than the power of thermal radiation, that is, the cooling of the target is slower than when it is cooled by thermal radiation only. This indicates that additional energy is being released in the target. We assume that the source of this additional energy is the fast thermal annealing of radiation-induced defects formed in the target under HIPIB irradiation. After HIPIB irradiation of a large target, most of the interstitial atoms have left the irradiation region, and the probability of annealing the radiation defects (and additional target heating) is low. Increasing the thickness of the target enhances the migration of the interstitial atoms and reduces the additional heating of the target in the focus due to fast thermal annealing. For a small target, the migration of the interstitial atoms is limited and does not reduce the probability of fast thermal annealing.
Conclusion
Our observations show that the maximum energy density of a HIPIB measured with thermal imaging diagnostics considerably exceeds the ablation threshold of targets made from stainless steel, titanium, brass, and copper. This effect expands the possible range of the energy density measurement using thermal imaging diagnostics, from 2–3 J/cm2 up to 10–12 J/cm2, but introduces an error in the results. At an energy density of more than 10 J/cm2, this error in measurement exceeds 45%; at an energy density of <4 J/cm2, the error in the IR diagnostics does not exceed 15%.
The effect of target overheating under HIPIB irradiation is attributed to the formation, migration, and subsequent annealing of fast radiation-induced defects in the targets. The increase in the size and thickness of the target enhances the migration of the interstitial atoms from the irradiation region, limits its fast thermal annealing with vacancies, and reduces the additional heating of the target. A stainless steel target with a thickness of 0.1 mm provides the greatest extension to the possible range of energy density measurement with thermal imaging diagnostics.
To correct the results of thermal imaging diagnostics of a pulsed ion beam under conditions of intense ablation of the target material, it is possible to use the calibration dependence obtained from the results of measuring the HIPIB energy density with and without a mesh filter.
Author ORCIDs
A. Pushkarev, https://orcid.org/0000-0002-1312-9810.
Acknowledgements
The analysis of experimental data and the development of a model of the effects of radiation defects on the expansion of the measurement range of thermal imaging diagnostics were supported by RFBR, grant № 17-08-00067. The experiments on the TEMP-6 accelerator were supported by the National Natural Science Foundation of China under Grant No. 51371043.