1. Introduction
Layered mafic intrusions are produced during the development of large igneous provinces, associated with continental break-up. The North Atlantic Igneous Province is one of the most intensely studied large igneous provinces (e.g. Saunders et al. Reference Saunders, Fitton, Kerr, Norry and Kent1997), and hosts a number of renowned layered intrusions. These include the Skaergaard Complex (East Greenland) and the Rum Layered Suite (NW Scotland), classic examples of ancient closed and open system magma chambers, respectively. Although layered mafic intrusions have formed the basis for much of our understanding of the way in which magmas differentiate (Wager, Brown & Wadsworth, Reference Wager, Brown and Wadsworth1960; Irvine, Reference Irvine1982; McBirney, Reference McBirney1995), much historical work has been questioned by the proposal that cumulate textures have often undergone substantial recrystallization and chemical equilibration at a postcumulus stage (see McBirney, Reference McBirney2009, and references therein, for summary). It is probable that no layered intrusion has been more controversial than the Skaergaard Complex; after 80 years of intense study, there is still considerable debate in the literature over the mechanisms by which the Skaergaard magma evolved (McBirney, Reference McBirney1975; Hunter & Sparks, Reference Hunter and Sparks1987; McBirney & Naslund, Reference McBirney and Naslund1990; McBirney, Boudreau & Marsh, Reference McBirney, Boudreau and Marsh2009; Holness, Morse & Tegner, Reference Holness, Morse and Tegner2009). Recent work on the cumulate stratigraphy of the Skaergaard has highlighted the importance of applying detailed quantitative textural studies to these problems (Holness, Nielsen & Tegner, Reference Holness, Nielsen and Tegner2007; Holness et al. Reference Holness, Tegner, Nielsen, Stripp and Morse2007; Tegner et al. Reference Tegner, Thy, Holness, Jakobsen and Lesher2009). These workers have shed new light on magma chamber processes such as replenishment, convection and compaction, as well as making observations on the onset of crystallization of specific minerals, profoundly important issues for magma evolution in a closed system.
The c. 49 Ma Lilloise intrusion, East Greenland, is also interpreted as a closed system (Chambers & Brown, Reference Chambers and Brown1995). This is based on a well-developed transition from olivine-dominated cumulates at its base, through olivine, clinopyroxene and plagioclase cumulates to plagioclase and amphibole-dominated cumulates at the top. Major phases in the layered cumulates show progressive systematic changes in composition from Mg–Fe-rich olivine, clinopyroxene and amphibole phases and from Ca–Na-rich plagioclase (Chambers & Brown, Reference Chambers and Brown1995). No reversals in this trend are observed. In this study, the evolution of crystal size distribution (CSD) data for specific mineral phases of the Lilloise cumulates is tracked through the stratigraphy of the intrusion. The variation in the CSD plots for different minerals of the Lilloise cumulates are recorded and compared to the development of a theoretical closed system, as predicted by the CSD models of Marsh (Reference Marsh1998). The Lilloise intrusion is also associated with a major phase of syn-magmatic deformation at a postcumulus stage, believed to be the result of major subsidence of parts of the cumulate pile (Chambers & Brown, Reference Chambers and Brown1995). The effect of this deformation on textures in the cumulates is investigated.
The combination of petrographic observations and CSD data presented here and the quantification of the changes in the different mineral phases as cooling and crystallization of the magma progresses has important implications for the development of cumulates in closed system magma chambers.
2. Geological setting
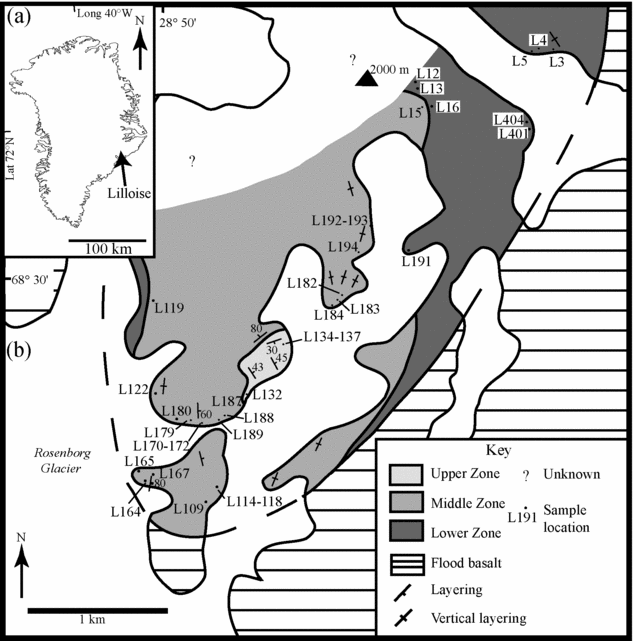
The Lilloise intrusion is located just inland from the Blosseville coast of East Greenland, approximately 120 km NE of the Skaergaard intrusion (Fig. 1). Emplacement of the Lilloise intrusion occurred during the opening of the North Atlantic Ocean and formation of the North Atlantic Igneous Province. A period of voluminous flood basalt activity occurred between 60.5 Ma and 54.5 Ma (Jolley & Bell, Reference Jolley, Bell, Jolley and Bell2002), represented in East Greenland by widespread 2–6 km thick flood basalt sequences (Tegner et al. Reference Tegner, Duncan, Bernstein, Brooks, Bird and Storey1998). The intrusive Sorgenfrei Gletscher Sill, Skaergaard and Kærven Gabbro complexes (Tegner et al. Reference Tegner, Brooks, Duncan, Heister and Bernstein2008) were emplaced slightly after the extrusive flood basalts c. 53 Ma. Tegner et al. (Reference Tegner, Brooks, Duncan, Heister and Bernstein2008) have proposed that the Lilloise intrusion is related to a later phase of magmatism that occurred at 50–47 Ma. Radiometric dating of K–Ar in amphiboles and apatite fission track analyses yield emplacement ages of 49.4 ± 2.0 Ma and 51.0 ± 1.2 Ma, respectively, for Lilloise (Chambers & Brown, Reference Chambers and Brown1995).
(a) Regional map of Greenland and (b) locality map for Lilloise showing the known outcrop area of the three cumulate zones and sample localities (adapted from Chambers & Brown, Reference Chambers and Brown1995).

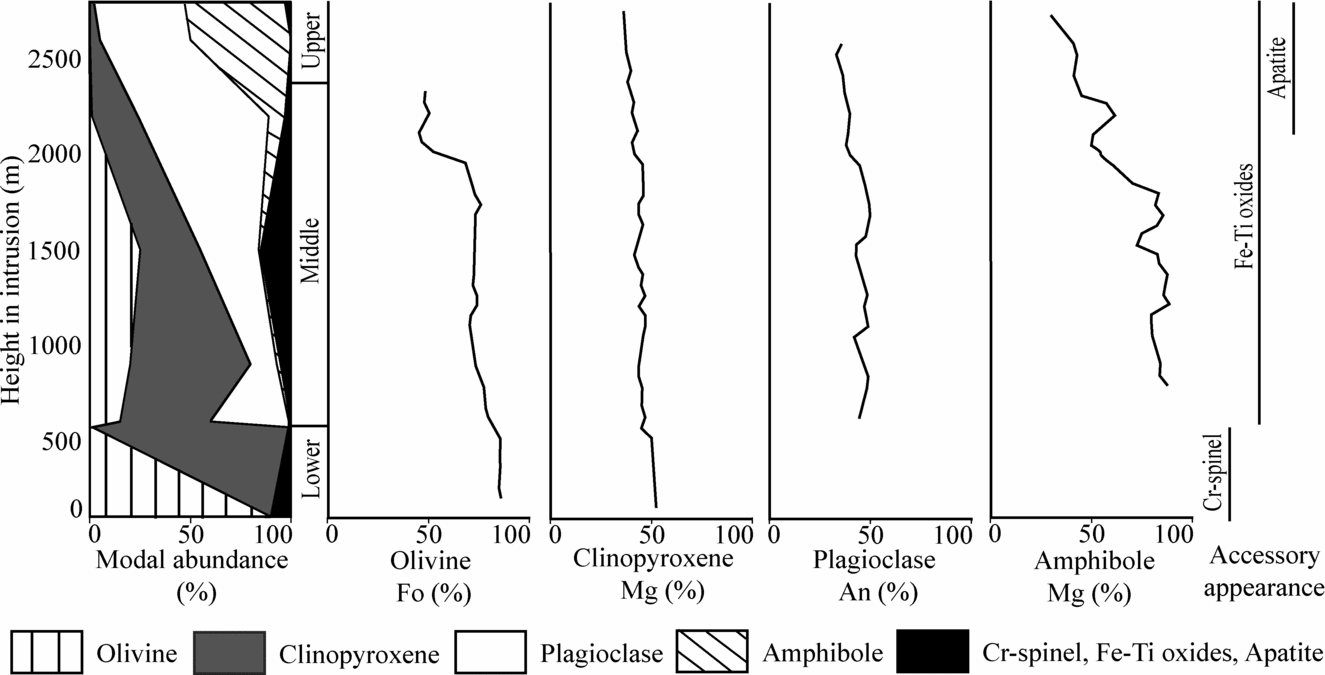
The Lilloise intrusion covers an area of approximately 32 km2 (Fig. 1). It cuts a 5 km thick sequence of seaward-dipping tholeiitic flood basalts (Brown, Reference Brown1973) and was emplaced at ~ 2 km depth (Chambers & Brown, Reference Chambers and Brown1995). Lilloise is unusual in that the cumulate sequence indicates a hydrous alkali-picritic parent magma (Brown, Reference Brown1973). The intrusion can be sub-divided into three compositional zones: (1) the Lower Olivine–Clinopyroxene Zone; (2) the Middle Olivine–Clinopyroxene–Plagioclase Zone and (3) the Upper Plagioclase–Amphibole Zone (see Fig. 2). The Lower Olivine–Clinopyroxene Zone is approximately 600 m thick with a massive appearance, although rhythmic modal layering is developed locally (Brown, Reference Brown1973). The gabbroic Middle Zone is 1800 m thick and has well-developed rhythmic modal layering, with locally developed slumped and cross-bedded layering (Chambers & Brown, Reference Chambers and Brown1995). The thickness of the Upper Plagioclase–Amphibole Zone is about 400 m, giving a total intrusion height of 2800 m (Chambers & Brown, Reference Chambers and Brown1995).
Comparison of mineral modal abundances, cumulus mineral composition and the appearance of accessory minerals with stratigraphic height (Chambers & Brown, Reference Chambers and Brown1995).

An overall absence of stratigraphically controlled geochemical reversal patterns in the cryptic layering suggests that the Lilloise intrusion was a closed system with no new influxes of magma during formation of the cumulate sequence (Fig. 2). The chemical composition of cumulus minerals indicates that the magma became more evolved toward the top of the intrusion (Fig. 2).
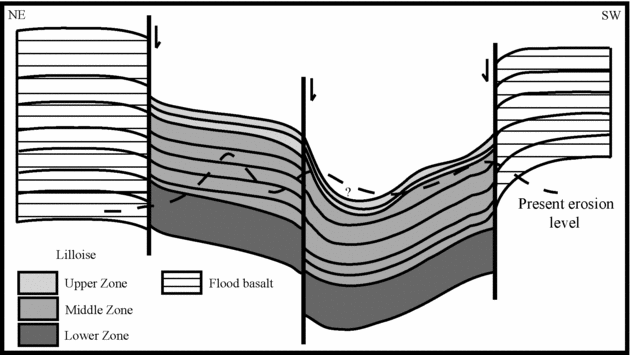
Field relations preserve evidence for a major deformational phase in the cumulate history of Lilloise (Fig. 3), occurring as a result of widespread syn-magmatic slumping of partially solidified crystal mush (Matthews, Reference Matthews1976; Brown, Chambers & Becker, Reference Brown, Chambers, Becker and Parsons1987). The latter authors described deformation as asymmetrical, with greater strain recorded in the rocks of the southwest than the northeast (see Fig. 3). The down-turned basalts of the contact zone are adjacent to the up-turned layering developed in the Middle Zone cumulates, signifying that at least some of the deformation occurred under sub-solidus conditions (Fig. 3; Brown, Chambers & Becker, Reference Brown, Chambers, Becker and Parsons1987). Internal deformation is most pronounced in the Upper Zone, where a synform is developed over 1 km across, involving approximately 400 m thickness of plagioclase–amphibole cumulate. Brown, Chambers & Becker (Reference Brown, Chambers, Becker and Parsons1987) postulated that this major fold is a slump structure created by the subsidence of the Lilloise magma chamber and the sagging of a partially crystallized plagioclase–amphibole mush over the solidified olivine–clinopyroxene–plagioclase unit (Middle Zone). Abundant minor felsic sheets have compositions consistent with the residual magmatic fluid that was present as an intercumulus liquid in the plagioclase–amphibole cumulates and was expelled by this collapse.
Schematic cross-section of Lilloise showing the overall deformed structure of the intrusion (adapted from Chambers & Brown, Reference Chambers and Brown1995). At the intrusion contacts the lava pile is down-turned and the layering is up-turned. Diagram is not to scale.

3. Petrography of the Lilloise Intrusion
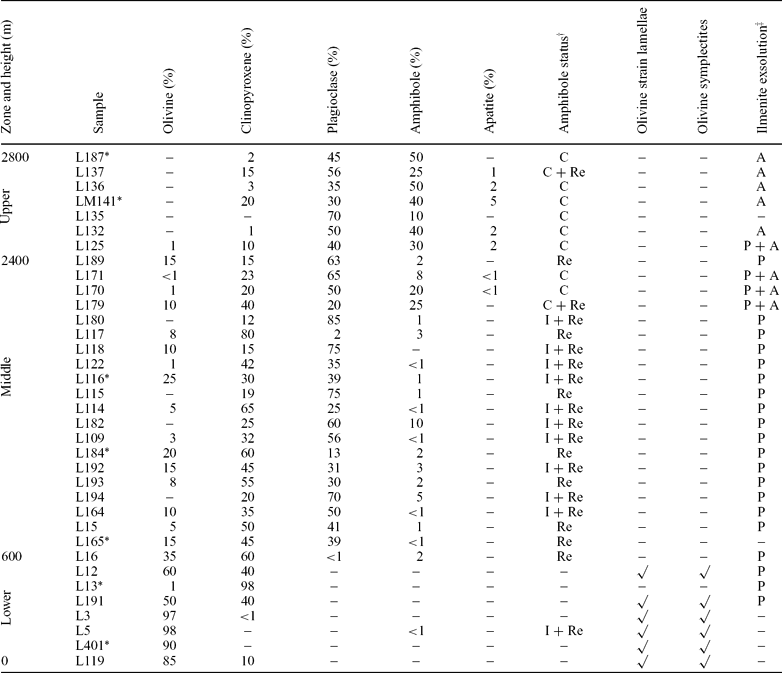
The suite of samples of the Lilloise intrusion studied here was collected in two expeditions. Parts of the Lilloise intrusion proved inaccessible, leading to some sampling bias. Table 1 summarizes the stratigraphic positions and petrography of selected samples from the Lilloise layered series.
Mineral modes and petrography of the Lilloise cumulates

* Samples used for CSD analysis. ✓ Feature present. – Feature not present. † C – cumulus, Re – replacement, I – interstitial.
‡ P – in clinopyroxene, A – in amphibole.
3.a. Olivine
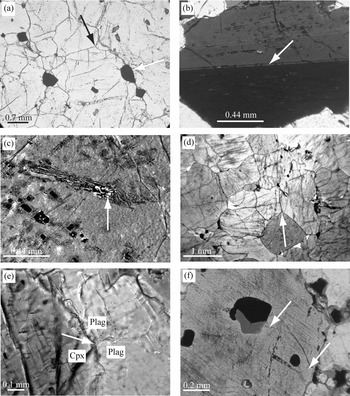
Olivine is the dominant mineral phase in the Lower Zone and has a maximum forsterite content of Fo86. Olivine abundance and Fo content decrease markedly toward the middle of the Lower Zone (Fig. 2; Chambers & Brown, Reference Chambers and Brown1995). The Lower Zone cumulates are highly texturally equilibrated with euhedral Cr-spinel commonly occurring at olivine triple junctions; the latter usually have dihedral angles approaching 120° and straight-to-slightly-curved, clean grain contacts (Figs 4, 5a). Most of the olivine crystals in the Lower Zone show evidence for solid-state deformation, such as strain lamellae (Fig. 4b) and undulose extinction, probably due to loading of the overlying cumulate pile (Chambers & Brown, Reference Chambers and Brown1995). Linear arrays of fine dendritic opaques (~ 10 μm to 0.25 mm), composed of intergrowths of clinopyroxene and magnetite (Ashworth & Chambers, Reference Ashworth and Chambers2000), are often observed parallel to these strain lamellae (Fig. 4b, c). Brown (Reference Brown1973) first described and interpreted these dendritic opaques as exsolution textures, and Chambers & Brown (Reference Chambers and Brown1995) subsequently referred to them as symplectites (Fig. 4c). This dendritic spinel exsolution is only apparent in olivines with Mg contents > 78 % and where strain lamellae have developed (Table 1). They are concentrated in the cores of crystals and do not cut grain boundaries. The exsolved dendritic opaques may overprint the fracture networks developed in olivine, suggesting that deformation occurred at relatively high temperatures > 800 °C (Ashworth & Chambers, Reference Ashworth and Chambers2000). Chambers & Brown (Reference Chambers and Brown1995) referred to the Lower Zone rocks as adcumulates, as they found negligible compositional zoning in either cumulus olivine or cumulus clinopyroxene. In addition, there are only very small quantities of intercumulus minerals (< 5%) present.
(a) Texturally equilibrated mono-mineralic olivine sample (L401) displaying 120° olivine–olivine–olivine apparent dihedral angles (black arrow). Cr-spinel occurs at olivine grain boundaries (white arrow). (b) Photomicrograph of Sample L5 showing a linear array of dendritic symplectites oriented parallel to an olivine strain wall (white arrow). (c) Large symplectite from Sample L5 consisting of two distinct phases, magnetite and diopside (white arrow), within an olivine crystal. (d) Mono-mineralic clinopyroxene sample (L13) with texturally equilibrated 120° apparent dihedral angles (white arrow). (e) Photomicrograph from L171, a gabbroic Middle Zone sample, showing the typical clinopyroxene-plagioclase–plagioclase dihedral angles that approach ~ 100° (white arrow) of the Middle Zone orthocumulates. (f) Fine-grained ilmenite crystals, oriented parallel to cleavage planes, exsolved in clinopyroxene from Sample L192. Note the absence of ilmenite surrounding the central amphibole crystal and the crystal rims (white arrows).

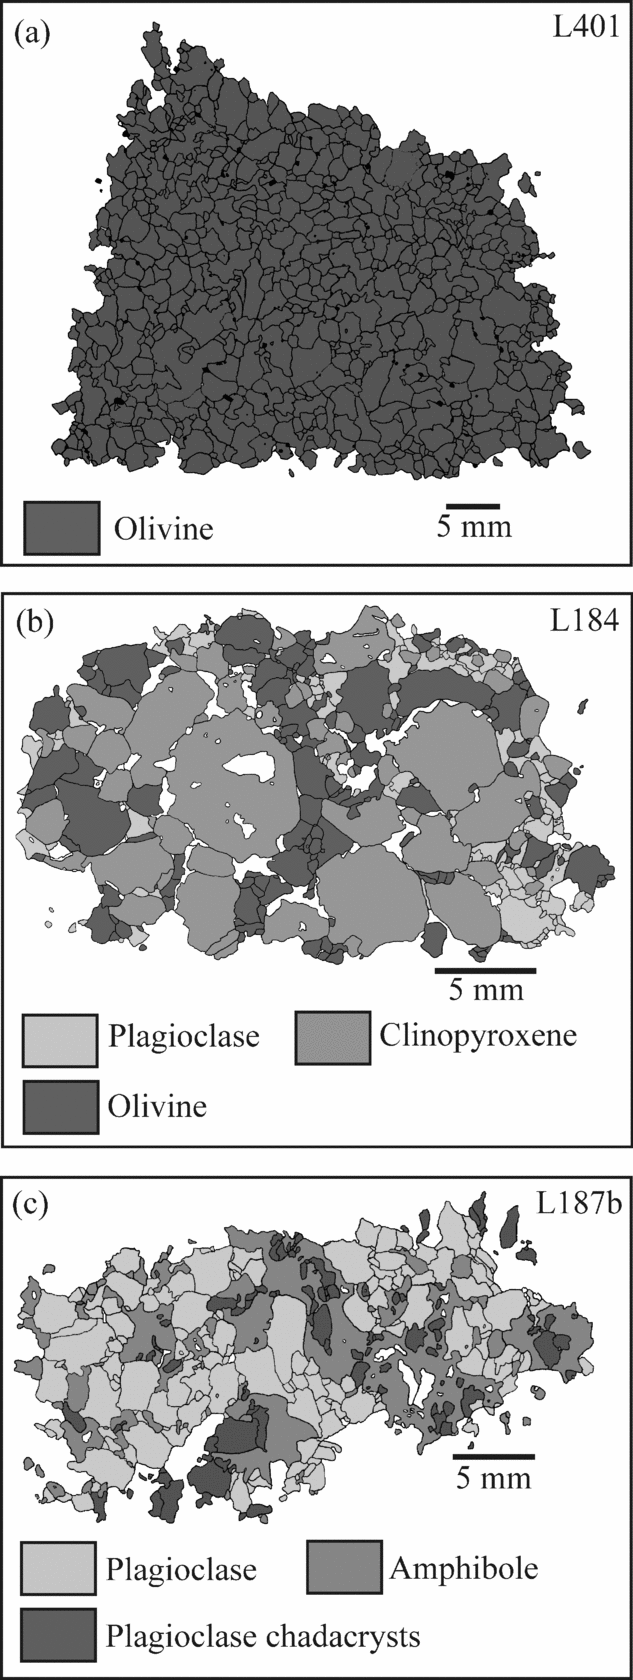
Digitized textural maps of thin-sections, from the Lower Zone (a), Middle Zone (b) and Upper Zone (c), used to measure textural parameters input into CSDCorrections 1.37. (a) Mono-mineralic olivine cumulate sample (L401) showing a texturally equilibrated adcumulate texture. (b) Typical orthocumulate texture observed in the gabbroic Middle Zone samples, which typically consist of cumulus olivine, clinopyroxene and plagioclase. (c) Texture map of Sample L187 showing the oikocrystic nature of cumulus amphibole encompassing plagioclase chadacrysts.

Cumulus olivine in the Middle Zone has an anhedral–subhedral nature and a significantly reduced modal abundance (< 25%), compared to the Lower Zone cumulates. Figure 2 shows the steady decrease in Fo content throughout the Middle Zone. No exsolution textures or solid-state deformation are observed in the olivines of the Middle Zone. Olivine is absent in the Upper Zone.
3.b. Clinopyroxene
The cumulus status of clinopyroxene in the Lower Zone is established towards the top of the zone before which it is either intercumulus or absent (Table 1). At the top of the Lower Zone, where clinopyroxene forms > 90 vol. % of the cumulate, the rocks are highly texturally equilibrated (Fig. 4d). Clinopyroxene is cumulus throughout the Middle Zone but crystals are often relatively isolated (surrounded by crystals of differing phases), except for L184 where very coarse (3–7 mm) clinopyroxene crystals form a pervasive framework of touching crystals (Fig. 5b). Little strain shadowing or deformation twinning, is observed in clinopyroxene in the Middle Zone cumulates. A degree of hydrous alteration of the Middle Zone clinopyroxene is attested to by patchy and rim replacement by amphibole and biotite. Clinopyroxene–plagioclase–plagioclase triple junctions are often obscured or altered, but observations on several samples suggest that mean apparent dihedral angles in these rocks are about 100° (Fig. 4e). No mineral alignment is observed. Exsolved platelets of ilmenite are a common texture observed within clinopyroxene of the Lower and Middle zones (Fig. 4f). Table 1 indicates that clinopyroxene is only a minor phase of the Upper Zone. Clinopyroxene crystals are often located centrally within coarser amphibole crystals or as fine rounded inclusions and angular fragments in plagioclase.
3.c. Plagioclase
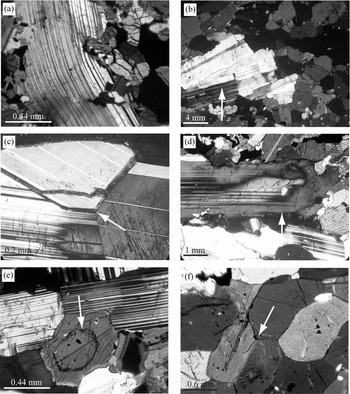
Plagioclase is only a minor intercumulus phase (< 1 %) in the uppermost sample of the Lower Zone (Table 1). The coarse-grained (up to 8 mm) subhedral cumulus plagioclase crystals of the Middle Zone typically share curved or irregular grain boundaries with the other major cumulus phases. Undulose extinction, as well as spindle and bent twin lamellae, are common in virtually all plagioclase-bearing samples, being restricted to crystals approximately > 0.5 mm, and increasing with crystal size (Table 1; Fig. 6a). These features are interpreted as being the result of solid-state deformation, although this deformation is not developed to the same degree as in plagioclase crystals from the Upper Zone (see below).
(a) Bent and spindle plagioclase twin lamellae observed in Sample L192. (b) Photomicrograph of LM141 showing a plagioclase glomerocryst (white arrow), consisting of aligned tabular plagioclase crystals and surrounded by cumulus amphibole, which also contain a visible fabric. (c) Equilibrated plagioclase–plagioclase–plagioclase apparent dihedral angles of 120° (white arrow) from within a plagioclase glomerocryst in LM141. (d) Zoning of a plagioclase crystal (white arrow) in Sample LM141. (e) Thick, stubby ilmenite crystals exsolved in amphibole crystals, from Sample LM141, forming a hexagonal outline. Note the sub-parallelism between the hexagonal outline of exsolved ilmenite and crystal edges of the euhedral amphibole. (f) Photomicrograph of amphibole-amphibole-amphibole apparent dihedral angles from LM141. The 120° dihedral angles (white arrow) indicate a significant amount of textural equilibration has occurred.

Rhythmic modal layering and micro-rhythmic layering of plagioclase-rich and amphibole-rich cumulate is common in the Upper Zone. This layering is accompanied by a strongly developed layer-parallel planar mineral lamination, controlled by the preferred alignment of tabular plagioclase and amphibole crystals (Fig. 6b). Compositional layering is not well-developed on thin-section scale, but a striking texture is present in some samples where small glomerocrysts of plagioclase occur in amphibole-rich cumulate (Fig. 6b). These glomerocrysts are aligned parallel to the mineral lamination. Plagioclase crystals are predominantly tabular in shape, particularly at larger grainsizes, though small isolated (in amphibole-rich domains) crystals are rounded in form. They exhibit a large range in grainsize (e.g. < 1 mm to > 1.5 cm), though the largest crystals are always associated with glomerocrysts. The largest crystals are frequently the most strongly aligned (e.g. as in sample LM141). Plagioclase grain contacts are straight and show an approach to solid-state textural equilibrium, with dihedral angles approaching 120° (Fig. 6c). Cumulus plagioclase crystals are often compositionally zoned (Fig. 6d), but no link between crystal size and intensity of zoning is observed (Fig. 6d). Plagioclase crystals of all sizes exhibit a range of textures, suggesting significant deformation in the solid state, including undulose extinction, deformation twinning, broken crystals and sub-grain development. Importantly, on mineral lamination planes, large plagioclase tablets and glomerocrysts display a weak to moderate lineation.
3.d. Amphibole
Within the Lower Zone, amphibole is generally absent, although minor patchy replacement of clinopyroxene is observed in some samples, and minor (< 2 %; Table 1) intercumulus amphibole is also present (cf. Brown, Tocher & Chambers, Reference Brown, Tocher and Chambers1982). Above the top of the Middle Zone (e.g. Sample L179) amphibole becomes an important cumulus phase (Table 1), often with ilmenite exsolution developed in the crystals (Fig. 6e). Ilmenite crystals in amphibole are usually stubbier and thicker when compared to ilmenite crystals in clinopyroxene. They are also typically concentrated into small patches or hexagonal outlines (see Fig. 6e).
Brown amphibole is the most abundant cumulus mineral in Upper Zone cumulates, comprising up to 50 vol. % for most samples. Coarse-grained amphibole crystals in the Upper Zone cumulates are often oikocrystic, containing chadacrysts of plagioclase, clinopyroxene, Fe–Ti oxides and apatite (Fig. 5c). Plagioclase chadacrysts do not show deformation textures exhibited by plagioclase outside of the oikocrysts as described above. Amphibole crystals are prismatic in habit, and do not show as large a grainsize range as plagioclase, with most crystals generally between two and five millimetres in size. Thin-section observation reveals that amphibole crystals also carry the strong mineral lamination in these rocks. Elongate crystals also contribute to the linear fabric observed on lamination planes. Like the cumulus plagioclase crystals described above, mono-mineralic podiform-shaped regions of amphibole occur and are texturally equilibrated (Fig. 6f). The amphibole crystals tend not to show solid-state deformation textures to the same degree as plagioclase crystals, though deformation twinning is preserved in the larger crystals. Ilmenite exsolution is common in amphibole crystals of the Upper Zone and is often organized into hexagonal outlines (Fig. 6e). In some cases where euhedral basal sections through amphibole crystals are observed, the hexagonal pattern of ilmenite crystals can be seen to parallel the crystal edges (Fig. 6e). These exsolution patterns are not affected by deformation twinning, perhaps suggesting formation after deformation had occurred.
3.e. Oxide minerals and apatite
Cr-spinel is a minor cumulus phase (up to 5 vol. %) in the Lower Zone cumulates (Table 1). It tends to be predominantly observed at olivine triple junctions and along olivine–olivine grain boundaries. Cr-spinels are typically euhedral and have an average grain size of 0.6 mm. Intracrystal Cr-spinel inclusions principally occur in olivine, but some are observed in clinopyroxene, and are finer and more rounded. Cumulus magnetite and ilmenite are observed from the base of the Middle Zone upwards, with some magnetite containing exsolved ilmenite (Chambers & Brown, Reference Chambers and Brown1995). Throughout the Middle and Upper zones, Fe–Ti oxides are commonly observed as inclusions, but their distribution is variable. Pleonaste spinel forms fine-medium sized crystals rimmed by Fe–Ti oxides in L115–L118 of the Middle Zone. Euhedral apatite occurs from the top of the Middle Zone upwards. In the Upper Zone, it is abundant and occurs mostly as euhedral hexagonal crystals (approximately 0.3 mm in diameter) along plagioclase and amphibole crystal boundaries. Inclusions of apatite are also common in the cores of amphibole crystals, but these are typically needle-like in shape. These apatite needle inclusions can exhibit strong alignments parallel to the overall mineral lamination defined by the cumulus phases. Mineral chemical analyses have revealed that all of the apatites are fluorapatites (Chambers & Brown, Reference Chambers and Brown1995).
4. Crystal Size Distribution analysis
Marsh (Reference Marsh1988) adapted the Crystal Size Distribution (CSD) technique of Randolph & Larson (Reference Randolph and Larsen1971), used in materials sciences, to geological problems. CSD analyses of rocks allow a quantitative insight into crystallization kinetics and postcumulus modification of magmatic systems to be gained by plotting crystal population density (logarithmic number of crystals per unit volume) versus crystal size (e.g. Marsh, Reference Marsh1988, Reference Marsh1998; Boorman, Boudreau & Kruger, Reference Boorman, Boudreau and Kruger2004). Crystals are ordered into size bins, and application of stereological corrections allows their distribution to be measured volumetrically (Higgins, Reference Higgins2000). The data can yield information on the nucleation and growth rate history of crystals in magma (Higgins, Reference Higgins2006a) and place crystallization within a time framework (Marsh, Reference Marsh1998). There are two end-member models for CSDs in an igneous context: an open system (steady-state) model, involving continuous crystal growth and simultaneous input and output of crystals through physical circulation, and a closed system (batch) model, where no crystal input or output occurs (Marsh, Reference Marsh1988, Reference Marsh1998; O'Driscoll et al. Reference O'Driscoll, Donaldson, Troll, Jerram and Emeleus2007). Perfect examples of either may yield log-linear CSD plots (Marsh, Reference Marsh1998). Deviation of a CSD from log-linear behaviour has been attributed to various processes, including textural coarsening, compaction and magma mixing (e.g. Marsh, Reference Marsh1988, Reference Marsh1998; Higgins, Reference Higgins2006a).
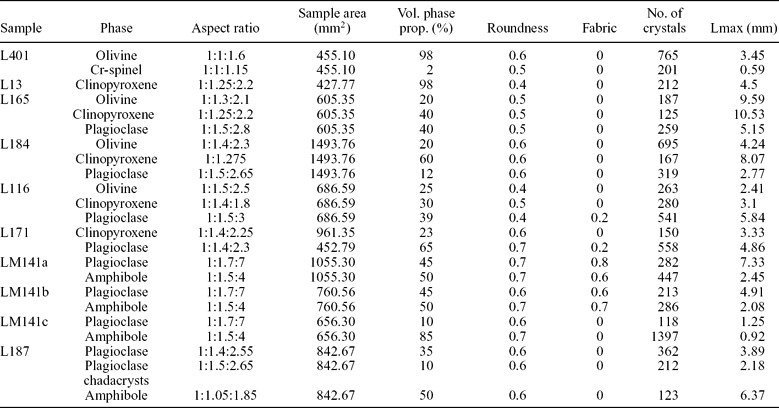
CSD analysis requires the input of a variety of crystal parameters measured using image software (Table 2). In this study, thin-sections were scanned at high resolution and crystal outlines were manually traced with the aid of a petrographic microscope, creating a ‘texture map’ (Fig. 5a–c). All crystals present from each cumulus phase were measured, the smallest approximately 0.1 mm. All samples are holocrystalline, so it is considered that the smallest crystals measured from each sample represent the lower limit of crystal size (O'Driscoll et al. Reference O'Driscoll, Donaldson, Troll, Jerram and Emeleus2007). Subsequently, the digitized textural map was opened into the image analysis packages Imagetool and ImageJ (Higgins, Reference Higgins2006a). Crystal roundness and major and minor axis lengths were measured after image calibration, as was the overall area of each sample. This study utilizes the major ellipse axis to calculate CSD. Stereological conversion of the 2-dimensional digitized data to 3-dimensional textural size data was carried out using the CSD Corrections package of Higgins (Reference Higgins2000; CSDCorrections 1.37). In most cases, more than 200 crystals were measured from each sample, as advocated by Mock, Jerram & Breitkreuz (Reference Mock, Jerram and Breitkreuz2003). Only cumulus phases were measured from each sample.
Textural data parameters input into CSDCorrections 1.37

LM141 aspect ratios calculated manually as discussed in text.
Crystal aspect ratios, consisting of short (S)–intermediate (I)–long (L) axes, are calculated after Morgan & Jerram (Reference Morgan and Jerram2006) using CSDSlice. The aspect ratio is an integral CSD parameter, as the variable shapes of crystals can create diverse results dependent on the orientation of the thin-section. Sample LM141 exhibits a strong planar lamination, so the amphibole and plagioclase crystal aspect ratios were calculated manually, as problems may arise using CSDSlice for samples with well-developed crystal alignments (cf. Higgins, Reference Higgins2006a; O'Driscoll, Stevenson & Troll, Reference O'Driscoll, Stevenson and Troll2008). To address this problem with LM141, the S/I and I/L values were estimated by measuring the modes of the width/length intersections from thin-sections, two cut normal (LM141 a and b) and one cut parallel (LM141c) to the mineral lamination, respectively (O'Driscoll, Stevenson & Troll, Reference O'Driscoll, Stevenson and Troll2008). To test the accuracy of the results with respect to crystal shape, a comparison of the volumetric proportion of a phase measured from the total intersection area and that calculated within CSDCorrections 1.37 was made (after Higgins, Reference Higgins2002b). A strong positive correlation of volumetric phase proportions (Table 3), calculated both manually and using CSDCorrections 1.37, verifies the CSD data with respect to the crystal aspect ratios used (after Higgins, Reference Higgins2002b).
CSD results including slope and intercept data

*Measured volume phase proportion calculated from total intersection area of phase.
Closure limits, which in principle restrict calculated crystal content to 100 % or below, have been calculated to verify the quality of the CSD data (after Higgins, Reference Higgins2002b; Boorman, Boudreau & Kruger, Reference Boorman, Boudreau and Kruger2004). Characteristic length (C i) v. intercept and particularly C i v. volumetric abundance are used to represent the closure limits graphically and can be used to interpret additional information. Characteristic length is a parameter that expresses the CSD slope as a length scale (Higgins, Reference Higgins2009), and is calculated using the following equation:

5. Crystal Size Distribution results
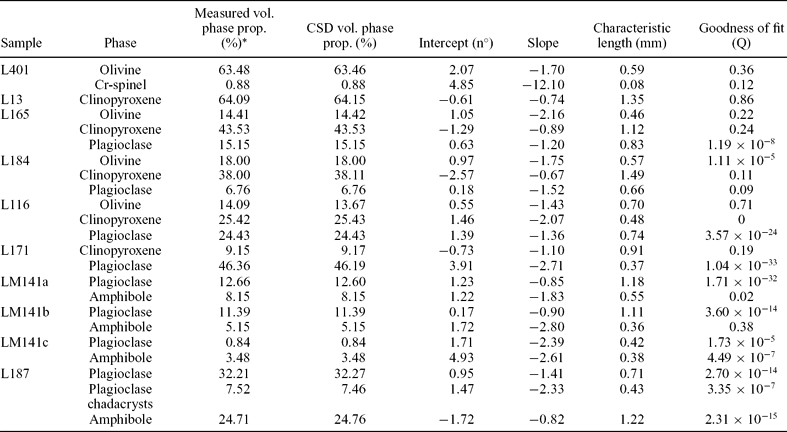
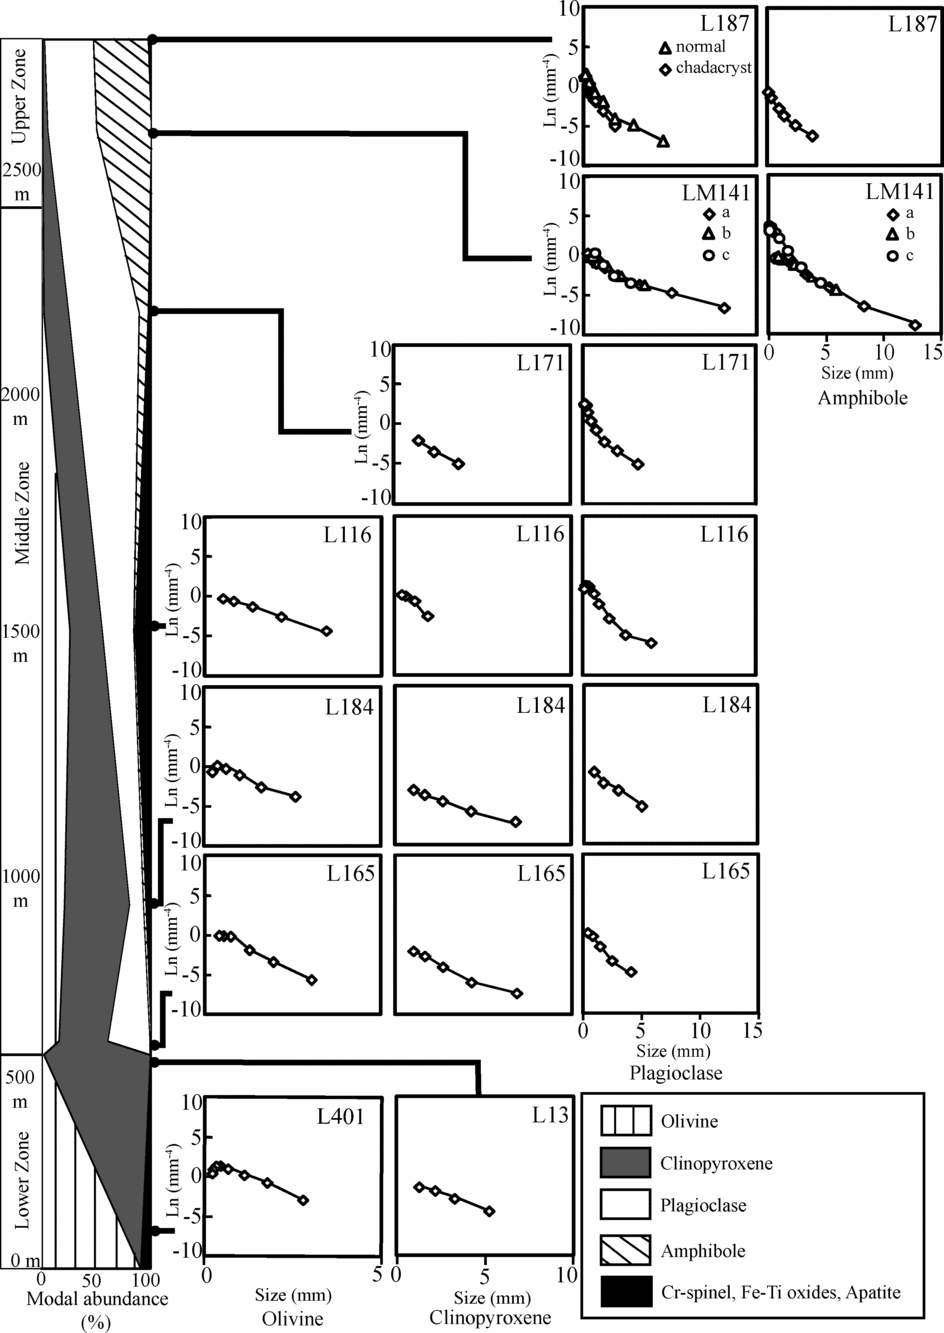
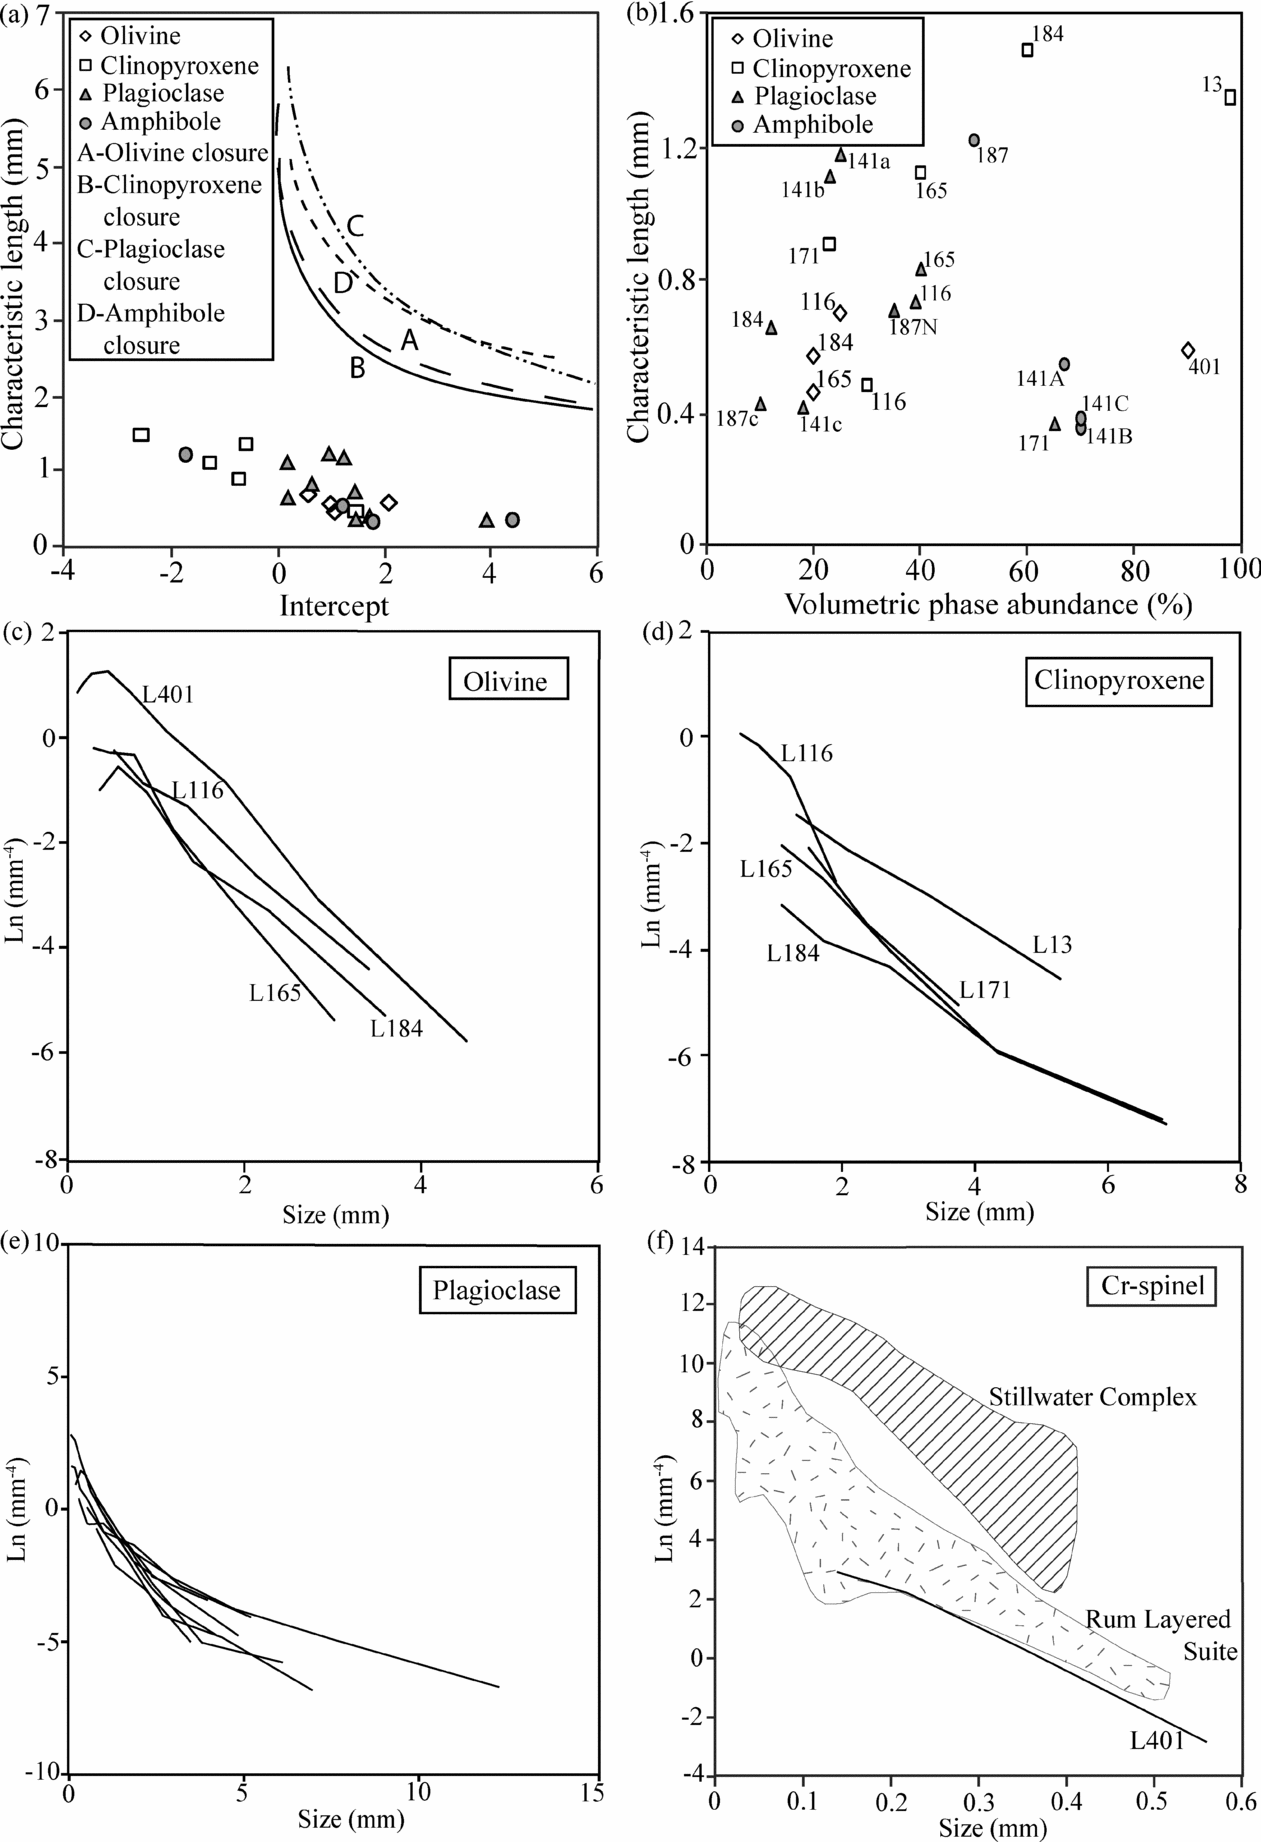
Table 3 displays the CSD results of all samples. Slope, intercept and goodness of fit (Q) data were calculated using CSDCorrections 1.37. The smallest crystals measured were 0.1 mm. Q values ≥ 0.1 describe a log-linear CSD profile, to which category most olivine and clinopyroxene curves belong (Table 3), with any Q value < 0.1 indicating curvature of the CSD profile (Higgins, Reference Higgins2006b). Most plagioclase and amphibole profiles display a curved profile, with the exception of L184 plagioclase. Figure 7 depicts CSD results for each phase in the studied samples in relation to their approximate stratigraphic height and modal abundances. The plot of characteristic lengths versus intercepts (Fig. 8a), incorporating calculated closure limits, reveals that the results fall below the closure limits imposed by the plot. A plot of characteristic lengths versus volumetric abundance of all of the data (Fig. 8b) describes a horizontal trend for olivine, a moderate positive correlation for clinopyroxene and a relatively random distribution for plagioclase. The changes in CSD results for each mineral phase, from the base to the top of the intrusion, are described in the next sections.
CSD plots for the major cumulus phases observed in Lilloise, plotted with respect to their stratigraphic height and mineral modal abundances.

(a) Plot of characteristic length v. intercept for all Lilloise samples. All mineral data fall below their respective phase closure limit, therefore validating the CSD results. (b) Plot of characteristic length v. volumetric abundance for all CSD data. Olivine shows a horizontal trend, indicating CSD slope is constant regardless of volumetric abundance, while plagioclase and amphibole display no trend. The positive correlation of clinopyroxene reveals that stratigraphically lower samples have the greatest characteristic lengths and volumetric abundances. Samples L187N and L187C represent CSD profiles for plagioclase outside of the oikocrysts and plagioclase chadacrysts, respectively. (c) CSD plot combining all calculated olivine profiles. Although L401 has a greater nucleation density and maximum crystal size, as well as a pronounced convex-upward hump at small size fractions, the slopes of all plots are relatively constant. (d) Comparative plot of all clinopyroxene CSDs revealing L13 and L184 have shallower slopes and lower nucleation densities compared to the other Middle Zone CSD profiles. (e) CSD plot describing the fanned nature and curvature of the plagioclase CSDs. (f) CSD plot for Lilloise Lower Zone Cr-spinel in Sample 401 (see text and Table 1 for details). The highlighted fields encapsulate CSDs for Cr-spinel seams from the Rum Layered Suite, Scotland (hatched – data from O'Driscoll et al. Reference O'Driscoll, Donaldson, Daly and Emeleus2009) and the Stillwater Complex, USA (diagonal lines – data from Waters & Boudreau, Reference Waters and Boudreau1996), included for comparison.

5.a. Olivine
The olivine CSDs are log-linear and display relatively constant slopes (ranging from −1.43 to −2.16) throughout the Lower and Middle zones (Figs 7, 8c.). Sample L401 (Lower Zone) exhibits a higher nucleation rate and maximum crystal size compared to stratigraphically higher samples (Fig. 7). There is a tendency towards the development of a small hump-shape in the CSD profiles at small size fractions. CSDs of the Middle zone progressively display constant slopes and proportionate increases to intercept and maximum crystal size with stratigraphic height.
5.b. Clinopyroxene
The CSD results for clinopyroxene are quite consistent in their log-linear profiles. Minor variation is observed in the dataset as follows. The slopes of CSDs from L13 and L184 are shallower compared to other clinopyroxene curves. However, the L165 CSD slope to the right of the kink developed at 4.32 mm and −5.93 mm−4 correlates well with the slope of L184 (Fig. 8d). The only Lower Zone clinopyroxene CSD, L13, describes a systematically higher nucleation rate and maximum crystal size compared to the Middle Zone samples. Nucleation density decreases with height through L165 to a minimum in L184 (Fig. 7).
5.c. Plagioclase
All of the plagioclase CSD curves show a broad concave-up morphology (Fig. 8e). The point of curvature is developed between 1.41 mm and 3.85 mm in the Middle Zone CSDs and in one of the Upper Zone CSDs (LI87). The CSD plots of LM141 display a more gradual concave-upward curve. CSD slope values are variable with stratigraphic height but generally describe a decrease (Table 3; Fig. 7). CSD curves for sections cut parallel and normal to the mineral lamination from LM141 match. A CSD curve from plagioclase chadacrysts in amphibole (L187) is very similar to that expressed by the plagioclase CSD from the same sample (excluding all chadacrysts) between crystal sizes of 0.28 mm and 0.46 mm (Fig. 7). The two curves deviate at 0.46–0.49 mm. The CSD of the plagioclase crystals outside the amphibole oikocrysts becomes shallower and has a maximum crystal size of 6.91 mm, while the chadacryst CSD is steeper and has a maximum crystal size of 2.89 mm.
5.d. Amphibole
Both amphibole CSDs are from the Upper Zone. Nucleation density decreases and slope values become shallower with height through the intrusion (Table 3; Fig. 7). The CSDs for the two LM141 sections sectioned normal to mineral lamination are similar. Good agreement is also observed between the thin-sections cut normal and parallel to the mineral lamination, as would be expected from CSDs of the same sample (Higgins, Reference Higgins2006a), although both CSDs diverge slightly at ~ 3 mm. This may be an artefact created by the difference in the number of crystals measured, though laminated plagioclase samples from the Sept Iles intrusion display similarly divergent CSDs in orthogonal sample-sets at small size fractions (Higgins, Reference Higgins2006a, fig. 3.51).
5.e. Cr-spinel
The Cr-spinel CSD plot slope for the sample from the Lower Zone is calculated from just over 200 crystals. The plot is log-linear with a small kink developed at 0.224 mm deflecting the profile downwards (Fig. 8f). The calculated slope of −12.10 (Table 3) is very shallow compared to CSD plots from other layered mafic intrusions. For example, Cr-spinel seams from the Stillwater Complex (USA) display CSD slopes of −20 to −30 and −20 to −70 in Cr-spinel seams from the Rum Layered Suite (NW Scotland) (Waters & Boudreau, Reference Waters and Boudreau1996; O'Driscoll et al. Reference O'Driscoll, Donaldson, Daly and Emeleus2009).
6. Discussion
Previous research, based on field observation and detailed mineral chemistry analysis (Fig. 2) indicates that the Lilloise intrusion behaved as a closed system magma chamber. As there was no influx of new magma during evolution, crystallization can be assumed to have been purely governed by processes relating to the solidification front regime and/or to local kinetic controls (Marsh, Reference Marsh1998). Without the need to consider strongly variable cooling regimes, typical of open systems, CSD analysis can help to elucidate how solidification of cumulates proceeds. Study of the Skaergaard magma chamber, viewed as a closed system, has pioneered advances in our understanding of crystallization dynamics and the consequences for the line of liquid descent (Wager, Reference Wager1960, Reference Wager, Fisher, Freuh, Hulbert and Tiley1963; McBirney & Noyes, Reference McBirney and Noyes1979; Irvine, Reference Irvine1982). Recent quantitative textural studies on the Skaergaard cumulates have shown that they might preserve valuable records of processes such as magma chamber convection, possible replenishment and compaction, as well as liquidus assemblage (Holness, Nielsen & Tegner, Reference Holness, Nielsen and Tegner2007; Holness et al. Reference Holness, Tegner, Nielsen, Stripp and Morse2007; Tegner et al. Reference Tegner, Thy, Holness, Jakobsen and Lesher2009). Combining geochemical studies with quantitative analyses of textural equilibration allowed Tegner et al. (Reference Tegner, Thy, Holness, Jakobsen and Lesher2009) to conclude that differentiation of Skaergaard was partially driven by compaction acting on a relatively thin (few tens of metres) crystal mush. Rocks from lower in the Skaergaard stratigraphy have an orthocumulate texture, a result of a high crystal accumulation rate (a function of the high cooling rate) in a relatively thin crystal pile and little compaction to drive off interstitial fluid. This contrasts with stratigraphically higher rocks which display near-adcumulate textures and developed within a slightly thicker crystal pile under a lower accumulation rate (as cooling rate decreases with height) where the consequent increased efficiency of compaction removed interstitial liquid (Tegner et al. Reference Tegner, Thy, Holness, Jakobsen and Lesher2009).
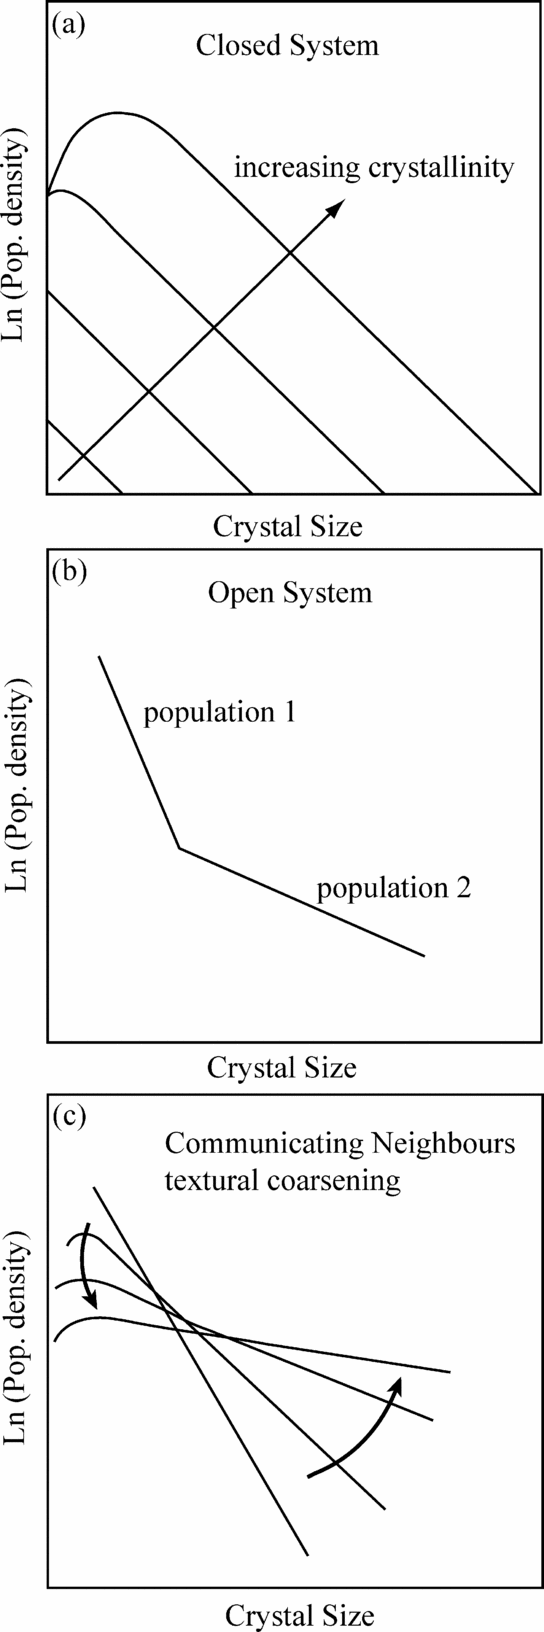
CSDs from the different sections of the Lilloise are compared to the theoretical CSDs of Marsh (Reference Marsh1998), to investigate whether the textural data preserves evidence for primary closed system magma chamber behaviour during crystallization of the Lilloise cumulates. Marsh (Reference Marsh1998) calculated theoretical CSD evolution for perfectly closed (batch) magma systems, to show what the resulting shapes of CSD plots might look like. For reference, Figure 9 displays the theoretical CSDs of Marsh (Reference Marsh1998) for closed and open systems and the effect on CSD plots of textural coarsening. Perfect closed system CSD slope values for a particular mineral phase, dependent on nucleation rate, remain constant and systematically progress through a proportionate increase to both nucleation rate and maximum crystal size, with crystallinity and time (Fig. 9a; Marsh, Reference Marsh1998). In comparison, the slope, intercepts and maximum crystal sizes for open system CSDs of a single phase are variable and often describe composite profiles (Fig. 9b; Marsh, Reference Marsh1998).
(a) Theoretical CSD plot describing the systematic increase to nucleation rate and maximum crystal size maintaining a constant slope, with increasing crystallinity, predicted by Marsh (Reference Marsh1998) for closed systems. The convex-upwards hump developed at higher crystal proportions represents the decrease in available melt. (b) Simple kinked CSD representing a mixing of multiple crystal populations, typical of open system dynamics (after Marsh, Reference Marsh1998). (c) Plot describing effect of dissolution of smaller crystal sizes and precipitation of material on larger crystals, creating growth, on CSD profiles with time (Communicating Neighbours textural coarsening; Higgins, Reference Higgins2002a).

It is important to consider the difference between a closed system, as considered by Marsh (Reference Marsh1998), a whole magma chamber with no input or output of material throughout its bulk crystallization history, and the specific environment where cumulates form, that is, the crystal mush. The final textures of solidified cumulates are determined to a large degree by cumulus and postcumulus processes which operate at and below the magma–mush interface (Holness, Nielsen & Tegner, Reference Holness, Nielsen and Tegner2007; Tegner et al. Reference Tegner, Thy, Holness, Jakobsen and Lesher2009). Thus, deciphering the degree to which postcumulus processes have modified a CSD, and the degree to which two CSDs of a mineral phase from different stratigraphic levels in the intrusion differ, is critical. In Lilloise, for example, it is shown that primary controls on crystallization of olivine and plagioclase are recorded by their CSDs, and are not completely obscured by subsequent textural coarsening, though the latter does modify the CSDs. Textural coarsening is defined by Higgins (Reference Higgins2002a) as the growth of larger crystals at the expense of smaller ones, and can proceed at periods of protracted near-liquidus temperature. Depending on the number of phases in the rock, coarsening can occur down to sub-solidus temperature, albeit at reduced rates. For mono-mineralic rocks, this can occur easily through grain boundary migration, and may be deformation-driven. Textural maturation, defined by Holness, Nielsen & Tegner (Reference Holness, Nielsen and Tegner2007), is understood to be the extent to which a rock has evolved from the initial reaction-controlled texture towards textural equilibrium, so encompasses textural coarsening especially as sub-solidus temperatures are approached.
6.a. Lower Zone
Marsh (Reference Marsh1998) predicted log-linear population density versus size profiles in closed systems might develop as a result of exponential increases in nucleation rates with time. As nucleation occurs in the melt, increased crystallinity (decreased melt proportion) results in a modification of the CSD through the development of a convex-upward hump at small size fractions (Fig. 9a; Marsh, Reference Marsh1998). The L401 CSD curve correlates well to this description by Marsh (Reference Marsh1998). However, the humped profile at small size fractions may also represent textural coarsening, which could have accompanied the extensive textural equilibration that is evidenced by the apparent dihedral angles. The mono-mineralic samples of L401 (olivine and Cr-spinel) and L13 (clinopyroxene and Cr-spinel), would be expected to be capable of more significant equilibration and grain boundary migration in the sub-solidus, compared to the Middle Zone orthocumulates (Holness, Nielsen & Tegner, Reference Holness, Nielsen and Tegner2007). Higgins (Reference Higgins2002a) analysed similar olivine CSD curves obtained from the Kiglapait intrusion and interpreted their formation as a result of Communicating Neighbours textural coarsening (Fig. 9c). Communication between crystals is a key control on postcumulus processes and the Communicating Neighbours textural coarsening model predicts that this interaction only occurs between neighbouring crystals (Higgins, Reference Higgins2002a). If the Communicating Neighbours model holds for olivine CSDs from Lilloise, it might be expected that the Middle Zone CSD curves display progressively steeper slopes and reduced humped profiles, compared to L401, as bi-mineralic or poly-mineralic orthocumulates coarsen less than adcumulates (Higgins, Reference Higgins2002a). Figures 7, 8b and 8c all emphasize the constant slope values (and consequently characteristic lengths) of the olivine CSD curves, supporting the argument that the decrease in olivine modal proportion indicated by the CSDs with stratigraphic height is primary and reflects the presence of other mineral phases on the liquidus in the Middle Zone. Thus it is proposed that textural equilibration processes is probably only represented by the humped profile at small sizes in the CSD for L401. The L13 clinopyroxene curve also displays a log-linear profile, although no humped profile is observed (Fig. 7). In contrast to olivine, the L13 clinopyroxene curve, when compared to clinopyroxene profiles of the Middle Zone (except for L184), displays a shallower slope (Fig. 8d).
The Cr-spinel CSD has a shallow slope (Fig. 8f), comparable to those observed in Stillwater and Rum Cr-spinel seams (Waters & Boudreau, Reference Waters and Boudreau1996; O'Driscoll et al. Reference O'Driscoll, Donaldson, Daly and Emeleus2009), where significant postcumulus coarsening has been invoked within the middle parts of seams to explain the coarser grainsize of Cr-spinel there. The Lilloise Cr-spinel does not occur in seams, but it is probable that the Cr-spinel represents cumulus crystals co-precipitated with olivine. It is likely the crystals have undergone significant postcumulus coarsening, given the high degree of textural equilibrium of the olivine-rich cumulate. The Cr-spinel CSD slope is very similar to those of texturally coarsened Cr-spinel in seams in layered intrusions, which suggests that the Cr-spinel CSD represents tentative evidence for coarsening in the Lilloise cumulates as well.
Symplectites observed in the olivines of the Lower Zone are mineral intergrowths which exsolve under solid state conditions (Fig. 4c; Ashworth & Chambers, Reference Ashworth and Chambers2000). Housden, O'Reilly & Day (Reference Housden, O'Reilly and Day1996) and O'Driscoll et al. (Reference O'Driscoll, Donaldson, Troll, Jerram and Emeleus2007) describe very similar, crystallographically controlled dendritic magnetite inclusions from Unit 10 cumulus olivines of the Rum Eastern Layered Intrusion. Housden, O'Reilly & Day (Reference Housden, O'Reilly and Day1996) comment that these may be a thermally controlled exsolution product. The close relationship between symplectite orientation and olivine strain lamellae suggests that deformation and exsolution were consanguineous.
6.b. Middle Zone
The beginning of the Middle Zone is marked by the onset of crystallization of cumulus plagioclase, with cumulus olivine and clinopyroxene (Fig. 5b). The rocks of the Middle Zone exhibit orthocumulate textures, with up to 10 % intercumulus oxide phases and minor (< 5 %) intercumulus amphibole. The reduced intercept (nucleation density) values of the Middle Zone olivine CSDs compared to the Lower Zone (Fig. 8c) indicate olivine nucleation and growth was more restricted, probably because of the onset of plagioclase crystallization as a cumulus phase and increased quantities of clinopyroxene crystallization.
The migration of clinopyroxene CSD profiles from the Middle Zone to the left of the CSD plot compared to L13 (Fig. 8d), can also be explained by volume restrictions imposed by the introduction of plagioclase onto the liquidus. Figure 8b shows that the greatest clinopyroxene characteristic lengths correspond to the greater modal abundances, observed in the stratigraphically lower samples. These samples are also the ones with the lowest nucleation densities. Two distinct groups of clinopyroxene CSD curves can be drawn from Figure 8d; L13 and L184 both share similar slopes while the other curves, of similar slope values to each other, are steeper. None of the clinopyroxene CSDs reveal a humped profile at smaller size fractions, suggesting that textural coarsening was limited. This might be expected in such poly-mineralic rocks as these and raises some interesting conclusions in light of the recent study by Tegner et al. (Reference Tegner, Thy, Holness, Jakobsen and Lesher2009), which suggested that the orthocumulates of the Lower Zone in the Skaergaard intrusion solidified more rapidly as a result of a higher cooling rate. Indeed, the observed two-dimensional clinopyroxene–plagioclase–plagioclase dihedral angle values for the Lilloise Middle Zone rocks of ~ 100° are very similar to those of the Skaergaard orthocumulates, suggesting a similar time-integrated thermal history with the rocks undergoing maturation but not textural coarsening. Tegner et al. (Reference Tegner, Thy, Holness, Jakobsen and Lesher2009) suggested that as the cooling rate in the Skaergaard decreased with heating of the surrounding country rocks, adcumulus processes were more favoured.
Absence of strain lamellae in Middle Zone olivine and clinopyroxene crystals may suggest that less deformation occurred here, compared to the Lower Zone cumulates. However, it is also possible that strain was preferentially accommodated in plagioclase crystals, which commonly show evidence of some solid state strain (Fig. 6a). Plagioclase crystals in the Middle Zone have an average grainsize of (~ 2 mm). Deformation intensity within Middle Zone plagioclase generally progresses from being largely absent in crystals < 0.5 mm to greatest in the coarsest crystals, supporting the hypothesis that deformation affects larger size fractions preferentially. As described earlier, postcumulus deformation in the Middle Zone is indicated by bent and kinked plagioclase twins. After observing the degree of deformation the plagioclase has undergone, it would be expected that other phases have been highly deformed as well. However, few other phases consistently show the same levels of solid-state deformation. It is suggested that the deformation of the cumulate pile during the major subsidence event in Lilloise was accommodated first by plagioclase crystals (in plagioclase-bearing lithologies). Disappearance of magnetite symplectites from olivines in the Middle Zone, coincident with a reduction in Fo content below Fo78, is probably consistent with the more Mg-rich olivines of the Lower Zone being more susceptible to oxidation than Fe-rich olivines (Ashworth & Chambers, Reference Ashworth and Chambers2000).
Chambers & Brown (Reference Chambers and Brown1995) noted examples of complete replacement of clinopyroxene by amphibole in the Middle Zone. In some cases, amphibole crystals in the Middle Zone contain ilmenite exsolution textures. Ilmenite exsolution observed in amphibole crystals differs morphologically from the ilmenite exsolution in clinopyroxene (e.g. Figs 4f, 6e). The sub-parallelism between the hexagonal outline of the ilmenite exsolution and the edge of a euhedral amphibole (Fig. 6e) crystal, both controlled by cleavage orientation, strongly implies the growth of ilmenite exsolution in a primary amphibole. Consequently, cumulus amphibole crystallization probably occurred in the Middle Zone, earlier than anticipated by Chambers & Brown (Reference Chambers and Brown1995).
6.c. Upper Zone
The strong foliation, solid-state deformation textures, plagioclase zoning and development of sub-grain plagioclase indicate a protracted and complex crystallization history in the Upper Zone rocks. This is supported by the CSDs, which are broadly curved for the Upper Zone samples (Fig. 8e). A comparative plot of Middle Zone and Upper Zone plagioclase CSDs reveals a well-developed fanning arrangement, with the Upper Zone CSDs extending to greater crystal sizes and showing greater concave-upward curvature. Sample LM141 especially exemplifies a complex curved plagioclase CSD from the Upper Zone of the Lilloise intrusion, with a slight humped profile at smaller size fractions.
Field observation from previous study suggests that syn-magmatic deformation was significant before final solidification of the Upper Zone. The presence of strong planar and linear plagioclase and amphibole fabrics in some samples (e.g. LM141) suggests that syn-magmatic deformation played a pivotal role in plagioclase and amphibole texture formation in the upper levels of the intrusion. It is proposed here that the curved plagioclase CSD profiles in LM141 reflect two distinct crystal populations mixed by slumping and syn-magmatic deformation. It is envisaged that this process was driven by subsidence of the crystal mush. Thin-section petrography reveals that the plagioclase glomerocrysts in LM141 are texturally equilibrated (with plagioclase triple junctions approaching 120°; Fig. 6c), and in addition to the hump at small size fractions, suggests that a degree of textural coarsening occurred. This may have been partly driven by solid-state deformation, for which there is pervasive evidence. Amphibole crystals have a smaller grainsize (~ 1 mm) than the large plagioclase crystals (~ 3 mm) in LM141, and also show signs of solid state deformation and textural equilibration. Although LM141 is interpreted as being the product of mixing of different crystal mushes, field evidence from past studies indicates that parts of the layered stratigraphy in the Upper Zone cumulates have remained relatively undisturbed (see Brown, Chambers & Becker, Reference Brown, Chambers, Becker and Parsons1987, their fig. 5). Therefore, it is considered likely that subsidence of the crystal mush and syn-magmatic deformation were concentrated into zones, of which LM141 is a good example. More generally, the development of rhythmic layering dominated by either plagioclase or amphibole in the Upper Zone supports the notion that adcumulus crystallization became effective in the upper levels of the intrusion (cf. Tegner et al. Reference Tegner, Thy, Holness, Jakobsen and Lesher2009).
Sample L187 is texturally significant in that it preserves an early stage in the evolution of the crystal mush, where plagioclase chadacrysts are sealed in by the growth of amphibole oikocrysts (Fig. 5c). Higgins (Reference Higgins1998) describes a CSD study of plagioclase–chadacryst bearing olivine in a plagioclase groundmass of a plutonic troctolite from the Lac-St-Jean anorthosite complex (Canada), and proposed a model involving nucleation and communicating neighbours textural coarsening to produce the observed coincident plagioclase curves and limitation of plagioclase chadacrysts to smaller maximum crystal sizes and steeper slopes. In the L187 CSD profiles, initial nucleation and growth of small plagioclase crystals in a single population explains the coincident plagioclase curves at small size fractions. Subsequent crystallization of coarse, irregular amphibole oikocrysts creates two separate plagioclase populations by trapping some nucleated crystals as chadacrysts. From this point on, the two plagioclase CSD curves deviate. Plagioclase crystals outside the oikocrysts have grown to coarser grainsizes. The shallower slope for groundness plagioclase compared to the chadacrysts indicates that the increased grainsize is a result of Communicating Neighbours textural coarsening. This is expected, as diffusion is easier between Communicating Neighbours of the same phase, whereas it becomes inhibited within amphibole oikocrysts. Plagioclase chadacrysts contain no evidence of strain (spindle and bent lamellae are absent), whereas plagioclase outside the amphibole oikocrysts in L187 does. Crystallized amphibole oikocrysts protect the plagioclase chadacrysts from postcumulus processes that alter the CSD of the plagioclase groundmass. To maintain identical CSDs at small size fractions, plagioclase crystals in the groundmass < 0.5 mm must also have been relatively unaffected by postcumulus modification, supporting the hypothesis that deformation only affects plagioclase crystals of larger size fractions.
Cumulus apatite is common in the top ~ 400 m of the intrusion. The ubiquitous growth of apatite along cumulus grain boundaries indicates that the euhedral apatite was among the last of the mineral phases to grow in the crystal mush. The lack of solid state deformation in apatite crystals might indicate that slumping of the crystal mush occurred prior to its crystallization.
7. Conclusions
This contribution provides a combined petrographic and quantitative textural study on a poorly documented closed system magma chamber, the Lilloise intrusion. Correlations are observed between the results presented here and the predicted theoretical closed system CSDs of Marsh (Reference Marsh1998), supporting the classification of Lilloise as a closed system and indicating primary crystallization processes can be elucidated using quantitative textural techniques. Any deviation of CSD shape from log-linear profiles, predicted for true closed system evolution (Marsh, Reference Marsh1998), is explained by postcumulus Communicating Neighbours textural coarsening, mixing of distinct crystal populations and modification of larger crystal size fractions instigated by widespread deformation (that is, slumping and compaction) of the Lilloise cumulate pile at a postcumulus stage.
Communicating Neighbours textural coarsening significantly affected Lilloise cumulate textures. Supporting this conclusion is the shallow slope of the Cr-spinel CSD, comparable to other layered intrusions where textural coarsening is prevalent, the development of humped profiles at small size fractions, the mixing of two differently coarsened adcumulus crystal populations, by slumping, to produce the LM141 plagioclase CSD concave-upwards profiles and the deviation of the two CSD plagioclase profiles of L187 attributable to the protection of chadacrysts within the amphibole (from textural coarsening). Development of orthocumulate textures in the Middle Zone and evidence of mixed plagioclase and amphibole adcumulates in the Upper Zone support the sequence proposed by Tegner et al. (Reference Tegner, Thy, Holness, Jakobsen and Lesher2009) relating texture formation to cooling rate, accumulation rate, compaction and a thin crystal mush. By quantitatively tracking mineral phases through Lilloise's history it is apparent that the introduction of a new phase onto the liquidus does not necessarily significantly alter the CSD slope, only the modal abundance of the other minerals. This is accompanied by systematic changes in nucleation rate and maximum crystal size, especially for all olivine and clinopyroxene profiles, whether there is only one cumulus phase on the liquidus (L401, L13) or several (L171).
Acknowledgements
The authors express their gratitude to Carl Stevenson for discussion and advice. This work was initiated as part of CM's M.Sci. undergraduate project at the University of Birmingham. M. B. Holness and M. D. Higgins are thanked for their thorough and constructive reviews.