Introduction
Bergmann’s rule is a popular ecogeographical pattern which suggests a negative body size-temperature relationship in endothermic organisms. It is derived from a biophysical law which predicts better heat retention in larger-bodied animals due to their smaller surface area to volume ratio (Meiri and Dayan Reference Meiri and Dayan2003). The direct and indirect influence of body size in many physiological, macroecological and evolutionary processes (Bartholemew et al. Reference Bartholemew, Vleck and Vleck1981; Gillooly et al. Reference Gillooly, Allen, West and Brown2005) and the simplicity of the initial explanation for this relationship are perhaps responsible for its popularity in ecological studies (Meiri and Dayan Reference Meiri and Dayan2003, Watt et al. Reference Watt, Mitchell and Salewski2010, Olalla-Tárraga Reference Olalla-Tárraga2011). However, the results till date have been mixed, spanning positive, negative and no correlation (Ashton Reference Ashton2002, Blackburn and Hawkins Reference Blackburn and Hawkins2004, Rodríguez et al. Reference Rodríguez, Olalla-Tárraga and Hawkins2008, Olson et al. Reference Olson, Davies, Orme, Thomas, Meiri, Blackburn, Gaston, Owens and Bennett2009, Shelomi Reference Shelomi2012, Gutiérrez-Pinto et al. Reference Gutiérrez-Pinto, McCracken, Alza, Tubaro, Kopuchian, Astie and Cadena2014, Gohli and Voje Reference Gohli and Voje2016, Freeman Reference Freeman2017, Nwaogu et al. Reference Nwaogu, Tieleman, Bitrus and Cresswell2018, Riemer et al. Reference Riemer, Guralnick and White2018). Meta-analyses and other such general approaches have revealed that Bergmann’s patterns may be more commonly observed in terrestrial endotherms (Meiri and Dayan Reference Meiri and Dayan2003), as compared to ectotherms (Ashton Reference Ashton2002, Ashton and Feldman 2003).
In ectotherms, a converse Bergmann’s pattern has been proposed due to the shorter seasons associated with higher latitudes and elevations, which limits developmental time and hence body size (Atkinson and Sibly Reference Atkinson and Sibly1997, Mousseau Reference Mousseau1997, Chown and Gaston Reference Chown and Gaston2010). However, even here, a variety of results have led to the development of several taxa- and life-history-specific mechanisms including heat conservation (Zamara-Camacho et al. Reference Zamora-Camacho, Reguera and Moreno-Rueda2014). Some of the commonly hypothesized mechanisms, in both ectotherms and endotherms, include (i) the starvation resistance hypothesis which attributes the positive body size-latitude relationship to an increased risk of starvation in the highly seasonal environments of higher latitudes (Cushman et al. Reference Cushman, Lawton and Manly1993), (ii) the growing season length hypothesis which suggests that the shorter growing season at higher latitudes limits adult body size, resulting in converse Bergmann’s patterns observed in many ectotherms (Bidau and Marti Reference Bidau and Martí2007), (iii) the water availability hypothesis, which predicts larger amphibians in regions of low water availability due to their greater desiccation tolerance (Ashton Reference Ashton2002), (iv) the converse water availability hypothesis which suggests a positive body size-water availability relationship in amphibians due to their increased activity levels in such areas (Zug et al. Reference Zug, Vitt and Caldwell2001), (v) the primary productivity hypothesis which predicts a positive body size-productivity relationship due to a larger resource availability in such regions (Rosenzweig Reference Rosenzweig1968) and (vi) competition and prey-predator dynamics which suggest that variation in body size of prey species can be solely attributed to the distribution of predators (McNab 1971; Manyak-Davis et al. Reference Manyak-Davis, Bell and Sotka2013).
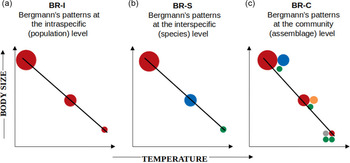
The primary focus of research on the body size–temperature relationship has been to assess the relative importance of these different processes across taxa and regions. However, establishing the generality of a process, even for the same organismal group, has been hindered by the differences in the taxonomic (intraspecific, interspecific or community) and spatial (elevational or latitudinal, regional, country-wide or continental) scales at which studies are conducted (Gaston et al. Reference Gaston, Chown and Evans2008, Olalla-Tárraga et al. Reference Olalla-Tárraga, Bini, Diniz-Filho and Rodríguez2010; Figure 1). Studies at the intraspecific scale, also known as the population approach, have documented clines along a temperature gradient (Ashton Reference Ashton2002, Yom-Tov and Geffen Reference Yom-Tov and Geffen2006, Fan et al. Reference Fan, Cai, Xiong, Song and Lei2019), whereas interspecific studies have examined the pattern across multiple species using mean values for both body size and temperature (e.g. Freeman Reference Freeman2017, Alhajeri and Steppan Reference Alhajeri and Steppan2016, Beck et al. Reference Beck, Liedtke, Widler, Altermatt, Loader, Hagmann, Lang and Fiedler2016). The less common community or assemblage approach uses mean body size across all co-occurring species observed within a pre-defined area such as an elevational belt or a latitudinal grid (e.g. Blackburn and Gaston Reference Blackburn and Gaston1996, Olalla-Tárraga et al. Reference Olalla-Tárraga, Rodríguez and Hawkins2006, Rodríguez et al. Reference Rodríguez, Olalla-Tárraga and Hawkins2008, Zeuss et al. Reference Zeuss, Brunzel and Brandl2017, Brehm et al. Reference Brehm, Zeuss and Colwell2019). Although the primary focus of this study is restricted to taxonomic scale dependency in Bergmann’s patterns, the effects of a varying spatial scale across studies cannot be undermined. For instance, intraspecific variation is expected only for wide-ranging species that span a heterogeneous environment (Gaston et al. Reference Gaston, Chown and Evans2008), and interspecific and community-level patterns are emergent properties of species turnover which is intrinsically spatial scale-dependent (Barton et al. Reference Barton, Cunningham, Manning, Gibb, Lindenmayer and Didham2013).
Three hypothetical scenarios are shown to illustrate a positive Bergmann’s pattern at three taxonomic scales: intraspecific (BR-I), interspecific (BR-S) and community (BR-C). Each circle represents an individual, colours represent different species, and the size of the circle is proportional to the body size of the individual. a). BR-I: In the intraspecific approach, individuals of the same species are measured at different points along a temperature gradient, and individuals observed at higher temperatures exhibit lower body size; b). BR-S: In the interspecific approach, multiple species are recorded along a temperature gradient, and overall smaller species are observed at higher temperatures; c). BR-C: In the community approach, all individuals within a pre-defined grid (or latitudinal/elevational belt) are measured and community mean body size is lower at higher temperature. The BR-C pattern can occur due to i). Intraspecific variation (e.g. individuals of red species are becoming smaller with increasing temperature); ii). Interspecific variation (e.g. blue species is replaced by the smaller orange species, which is further replaced by the even smaller grey species) or iii). Variation in species abundances (e.g. the green species of constant body size is found across the breadth of the gradient; however, its abundance is higher in the community at higher temperatures).

Studies of the intraspecific pattern usually focus on a single or few closely related species which exhibit large (usually regional or country-wide) environmental (temperature) ranges (Ashton Reference Ashton2002, Gutiérrez-Pinto et al. Reference Gutiérrez-Pinto, McCracken, Alza, Tubaro, Kopuchian, Astie and Cadena2014, Freeman Reference Freeman2017). Thus, although critical for understanding species-specific responses, the intraspecific approach may not be ideal for addressing the generality of an ‘eco-geographical rule’ since a majority of species do not span a sufficient range of temperature (e.g. the range-restricted tropical endemics) to exhibit marked intraspecific variation in body size (Gaston et al. Reference Gaston, Chown and Evans2008). The interspecific approach, on the other hand, uses information on multiple species, but constraints the data to species mean body size and midpoint of its elevational/latitudinal distribution. This ignores intraspecific variation, relative species abundances and range overlap between species – all three of which are shown to be strong determinants of macroecological patterns (Blackburn and Hawkins Reference Blackburn and Hawkins2004).
Several authors have highlighted the scale dependency of Bergmann’s patterns, and the community approach is often remarked as the most appropriate way to investigate body size variation along broad temperature gradients as it can account for variations at both intra- and interspecific levels (Blackburn and Hawkins Reference Blackburn and Hawkins2004, Meiri and Thomas Reference Meiri and Thomas2007, Olalla-Tárraga et al. 2007). In the context of a Bergmann’s pattern, a greater contribution of intraspecific variation or change in species abundances to the variation in community mean body size may be indicative of a stronger role of size-related competition in facilitating species coexistence within a community (MacArthur and Levins Reference MacArthur and Levins1967, Siefert et al. Reference Siefert, Violle, Chalmandrier, Albert, Taudiere, Fajardo, Aarssen, Baraloto, Carlucci, Cianciaruso and de Dantas2015). On the other hand, stronger interspecific variation, that is species turnover, is associated with strong environmental filtering on species’ body and therefore range size (Keddy Reference Keddy1992, de la Riva et al. 2015). More importantly, the variations at the intra- and interspecific scales may also occur in opposite directions, resulting in a mischaracterization of the pattern or the process when either information is lacking (Vellend et al. Reference Vellend, Lajoie, Bourret, Múrria, Kembel and Garant2014). Indeed, many studies in plant functional ecology have shown a congruence of patterns and processes across different taxa only when individual-level data were taken into consideration (Kichenin et al. Reference Kichenin, Wardle, Peltzer, Morse and Freschet2013, Siefert et al. Reference Siefert, Violle, Chalmandrier, Albert, Taudiere, Fajardo, Aarssen, Baraloto, Carlucci, Cianciaruso and de Dantas2015, Des Roches et al. Reference Des Roches, Post, Turley, Bailey, Hendry, Kinnison, Schweitzer and Palkovacs2018). Despite this, we found only two community-level investigations of Bergmann’s patterns which have incorporated both intraspecific variation and species relative abundances – one on bees (Classen et al. Reference Classen, Steffan-Dewenter, Kindeketa and Peters2017) and another on moths (Brehm et al. Reference Brehm, Zeuss and Colwell2019).
Body size is arguably the most important animal trait, and therefore, it is not surprising that its variation is determined by several different processes, usually in a case- and taxon-specific manner. However, more importantly, the observed ‘diversity of Bergmann’s patterns’ and the associated processes is also influenced by the different contexts of the many studies. They have differed not only in their taxonomic (intraspecific, interspecific or community) and spatial (latitudinal or elevational) scales, but also in the metrics used for the same scales (e.g. with and without species abundances/intraspecific variation for the community scale along elevational gradients; Beck et al. Reference Beck, Liedtke, Widler, Altermatt, Loader, Hagmann, Lang and Fiedler2016, Brehm et al. Reference Brehm, Zeuss and Colwell2019). Here, we investigate whether reducing the number of confounding factors would make for greater uniformity of body size-temperature relationships than seen in previous cross-taxa and cross-scale comparisons. We compare body size variation of endotherms (Aves) and ectotherms (Lepidoptera: Sphingidae) along the same compact elevational transect spanning 200–2770 m in the eastern Himalayas. We hypothesize that if heat conservation is the primary determinant of variation in body size, then we should observe a positive Bergmann’s pattern in both, hawkmoths and birds, and at all three taxonomic scales – intraspecific (only hawkmoths), interspecific and community, that is body size should increase with elevation at all taxonomic scales and for both organismal groups. We further assess the importance of species relative abundances and/or intraspecific variation in determining community-level variation in body mass for the two taxa.
Sphingidae, commonly known as hawkmoths, are relatively easy to identify to the species level and comprise over 1600 species globally with the highest diversity in the tropics (Beck et al. Reference Beck, Kitching and Linsenmair2006a, 2006b, 2009; Kitching Reference Kitching2020). Birds are popular targets of studies of Bergmann’s pattern due to their high and easily identifiable diversity, well-documented geographical distributions (Orme et al. 2006, Quintero and Jetz Reference Quintero and Jetz2018), morpho-trait measurements (Ali and Ripley Reference Ali and Ripley1972, Rasmussen and Anderton Reference Rasmussen and Anderton2005, Wilman et al. Reference Wilman, Belmaker, Simpson, de la Rosa, Rivadeneira and Jetz2014), evolutionary relationships (Jetz et al. Reference Jetz, Thomas, Joy, Hartmann and Mooers2012) and perhaps their role in the original study (Salewski and Watt Reference Salewski and Watt2017).
Materials and methods
Study region and the data
The study area and the hawkmoth data are described in Mungee and Athreya (Reference Mungee and Athreya2020a, 2020b). Briefly, hawkmoth individuals were sampled at 13 elevations separated by approximately 200 m between 200 and 2770 m in Eaglenest Wildlife Sanctuary in the eastern Himalayas of Arunachal Pradesh, northeast India. The region is one of the world’s 8 ‘hottest hotspots’ of biodiversity and endemism (Myers et al. Reference Myers, Mittermeier, Mittermeier, Da Fonseca and Kent2000) with a rich avifauna (Orme et al. Reference Orme, Davies, Burgess, Eigenbrod, Pickup, Olson, Webster, Ding, Rasmussen, Ridgely and Stattersfield2005, Price Reference Price2012). A novel photogrammetric method was used for morphological measurements of individuals of (unfettered) hawkmoths which settled on a UV light screen (Mungee and Athreya Reference Mungee and Athreya2020a).
We carried out transect counts of birds along the same elevational gradient, but with a higher elevational resolution of 50 m. Each elevational transect was sampled on 12 × 2 = 24 occasions during 0600–1200 hrs in April-June, 2012–2014. We minimized systematic differences in bird activity across the 6-hr sampling window by subdividing it into three periods of 2 hours each – early (0600–0800 hrs), mid (0800–1000 hrs) and late (1000–1200 hrs). The 12 replicates at each elevation were equally distributed across these 3 periods. We could not sample below 500 m inside Eaglenest due to accessibility issues. Therefore, we sampled the lowest elevation (i.e. 200 m) in the adjoining Pakke Tiger Reserve, about 20 km from the 500 m transect in Eaglenest. Species mean body mass was obtained from published resources (Ali and Ripley Reference Ali and Ripley1972, Rasmussen and Anderton Reference Rasmussen and Anderton2005, Schumm et al. Reference Schumm, White, Supriya and Price2020). Due to a strong linear relationship between mean annual temperature and elevation across our steep study site (r 2 = 0.98; p < 0.001), we use elevation as the independent variable in all analyses (Mungee and Athreya Reference Mungee and Athreya2020b).
Statistical analyses
Intraspecific Bergmann’s pattern (BR-I)
We investigated the intraspecific pattern only for hawkmoths since we did not measure traits of individual birds. We estimated the pattern for hawkmoths as a group by using normalized body mass and elevation with species mean values:
 $$B_{ij}^{norm} = {{{B_{ij}} - {\mu _{Bj}}} \over {{\mu _{Bj}}}}\,\,{\rm{and}}\,\,E_{ij}^{norm} = {E_{ij}} - {\mu _{Ej}},$$
where B is body mass, E is elevation, µ is the species mean, and the indices indicate the i-th individual of the j-th species. With this normalization, we were able to pool the data from all individuals regardless of species and elevation to derive the intraspecific relationship between body mass and elevation for the ‘community’ as a whole. We also examined the intraspecific pattern for individual species which had more than 20 individuals and spanned more than 800 m (sampled at 4 or more elevations) in elevational range.
Interspecific Bergmann’s pattern (BR-S)
For the interspecific analysis, the species’ mean body mass (mean across all individuals from all elevations for hawkmoths, published mean values for bird species) was determined as a function of the midpoint of the elevational range for the species using ordinary least squares regression. Following previous practise, we used log10(body mass) as the dependent variable at this level. However, body mass may be phylogenetically conserved across species leading to non-independence of residuals in a linear regression. To account for this, we used different approaches for hawkmoths and birds depending on the availability of information on phylogenetic relatedness among species.
In case of hawkmoths, we used the phylogenetically informed taxonomic classification assembled by Beerli et al. (Reference Beerli, Bärtschi, Ballesteros-Mejia, Kitching and Beck2019) to perform a stepwise hierarchical linear mixed effect model with subfamily, tribe and genus as random effects and elevation as the fixed effect. Response (body mass) and explanatory (elevation) variables were standardized to zero mean and unit variance to make the coefficient estimates comparable within and between the hierarchical models. In case of birds, we used the phylogenetic tree provided by Schumm et al. (Reference Schumm, White, Supriya and Price2020) for birds of eastern Himalayas. We added 13 missing species to this tree using the latest global avian phylogeny (Jetz et al. Reference Jetz, Thomas, Joy, Hartmann and Mooers2012). To do this, we scaled their branches to convert them into ultrametric trees and used the relative branch lengths and placement from the global phylogenetic tree. We ran a phylogenetic generalized least square (PGLS) regression and estimated the phylogenetic signal of body mass by maximum likelihood estimated values of Pagel’s lambda (Pagel Reference Pagel1999).
Community scale Bergmann’s pattern (BR-C)
For the community approach (BR-C), we calculated three metrics to assess the importance of species abundances and/or intraspecific variation in characterizing the community-level variation in body mass of hawkmoths and birds:
-
i. CM-S (Community mean using species data): Mean body mass across all co-occurring species at an elevation without considering their relative abundance. For hawkmoths, a single ‘regional’ mean (across all individuals from all elevations) body mass value was used for each species; this is the usual method while assessing grid-level assemblage patterns across latitudinal gradients (Olalla-Tárraga et al. Reference Olalla-Tárraga, Bini, Diniz-Filho and Rodríguez2010); it depends only on turnover in species richness, that is species occurrences.
-
ii. CM-A (Species Community mean with species abundance): Mean of species mean trait value, weighted by elevation-specific abundance. This has been usually termed community weighted mean (CWM) in previous studies (Cornwell and Ackerly Reference Cornwell and Ackerly2009) but we suggest that the terminology used here brings out the differences in the three metrics in an easier manner; this metric encapsulates turnover in species diversity, that is both species richness and abundance.
-
iii. CM-I (Community mean using individual data; only hawkmoths): Mean of all co-occurring individuals at an elevation, regardless of their species; it includes turnover in richness and abundance, and intraspecific variation.
We calculated the linear regression of the BR-C metrics with elevation, with and without weighting the communities using species richness (following Meiri and Thomas Reference Meiri and Thomas2007). Additionally, for the metric CM-A, we also compare the patterns using community-weighted median, instead of mean. For all community-level plots, we evaluated spatial autocorrelation in mean body mass by using Akaike information criterion (AIC) and the likelihood ratio (LR) tests of residuals (Diniz-Filho et al. Reference Diniz-Filho, Bini and Hawkins2003).
For hawkmoths, we also assessed the relative contributions of intra- and interspecific variability effects on community mean body mass along the elevational gradient following the variance decomposition method proposed by Lepš et al. (Reference Lepš, de Bello, Šmilauer and Doležal2011). This method is based on the decomposition of the total sum of squares (SSspecific) of the community-level trait variance along an environmental gradient (elevation) into three additive components: ‘fixed’ (SSfixed), ‘intraspecific’ (SSintraspecific) and ‘covariation’ (SScov) effects:
 $${\rm{S{S_{specific}} = S{S_{fixed}} + S{S_{intraspecific}} + S{S_{cov}}}}$$
The two community-mean metrics used for this decomposition, that is ‘fixed’ and ‘specific’ averages, correspond to our CM-A and CM-I metrics. The ‘specific’ community-average body mass is calculated using the ‘local’ species body mass, that is mean across individuals measured at that elevation (thus includes both inter- and intraspecific effects), and ‘fixed’ community-average body mass uses ‘regional’ species body mass, that is mean across all individuals from all elevations along the gradient (includes only the interspecific effects). The effect of ‘intraspecific’ community mean is then calculated as the difference between ‘specific’ and ‘fixed’ averages. Linear regressions of the ‘specific’, ‘fixed’ and ‘intraspecific’ community averages are assessed, with elevation as an explanatory variable. The sums of squares for each of the three community-average measures explained by elevation are then used to assess the relative contributions of the intra- and interspecific components (Lepš et al. Reference Lepš, de Bello, Šmilauer and Doležal2011). SScov component reflects the effect of covariation between inter- and intraspecific trait variability. We used 999 bootstraps to assess the significance of the three components.
All statistical analyses were performed in R 3.6.3 (R Core Development Team 2013), and the following packages were used: spdep 1.1.3 (Bivand et al. Reference Bivand and Wong2018), vegan 2.5.6 (Oksanen et al. Reference Oksanen, Blanchet, Friendly, Kindt, Legendre, McGlinn, Minchin, O’Hara, Simpson, Solymos, Stevens, Szoecs and Wagner2019), cati 0.99.3 (Taudiere and Violle 2015), ape 5.3 (Paradis and Schlip 2018), lmerTest 3.1.3 (Kuznetsova et al. Reference Kuznetsova, Brockhoff and Christensen2017) and caret 6.0.86 (Kuhn Reference Kuhn2020).
Results
We recorded a total of 4,731 hawkmoth individuals spanning 80 morphospecies, 30 genera and 3 subfamilies (Figure S1; Table S1). We measured traits for 3,302 individuals from 76 species; the remaining either did not sit on the gridded screen or could not be measured due to poor image quality. We have presented the patterns at all taxonomic scales using only 3,302 individuals, since we wished to compare results across taxonomic levels with the same data. For the CM-A metric, we also use the population-level abundances from the full data set (i.e. 4,731 individuals); however, this did not change the results in any significant manner (Supporting Information Figure S2). We recorded 15,746 individual birds from 245 species, 150 genera and 50 families (Table S1).
Intraspecific Bergmann’s pattern (BR-I)
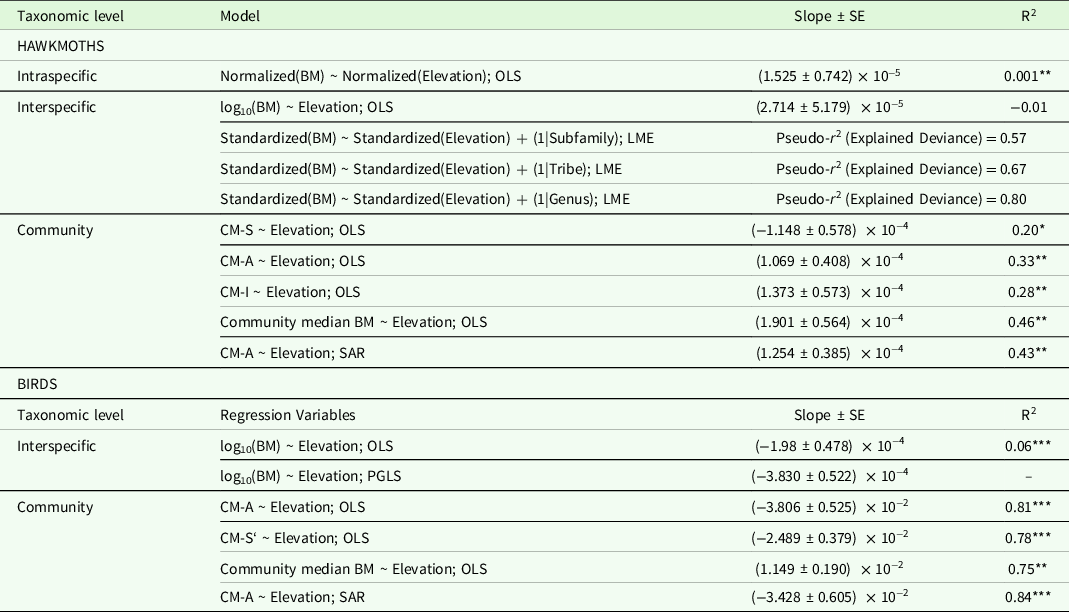
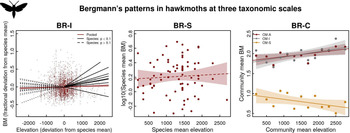
At the pooled intraspecific level, hawkmoth body mass showed a weak, but significant positive correlation with elevation (Table 1; Figure 2a; r 2 = 0.001, p < 0.05). The intraspecific patterns of the 24 species in our data which had an elevational range of 800 m or more and had more than 20 individuals were idiosyncratic (Table S2; Figure S1). Of them, the patterns of 17 (71%) species were not statistically significant, and only 6 (25%) species (Acosmeryx naga, Acosmeryx omissa, Cechetra lineosa, Callambulyx rubricosa, Eupanacra sinuata and Rhagastis lunata) exhibited weak but positive correlations and one species a negative correlation (Theretra clotho) (Table S2; Figure S1).
Linear regression between body size variation and elevation for hawkmoths and birds, at different taxonomic levels. All slopes significant at p < 0.05 are in bold

BM = Body mass; OLS = Ordinary Least Squares Regression; LME = (Hierarchical) Linear Mixed Effects Model with random intercept; SAR = Spatial Autoregressive model (Nagelkerke Pseudo R2 values are reported for SAR models); CM-S = Community mean body mass across all co-occurring species without considering their local abundance; CM-A = Community mean body mass across all co-occurring species, weighted by local abundance; CM-I = Community mean body mass of all co-occurring individuals, regardless of species; * p < 0.1; ** p < 0.05; *** p < 0.01.
Relationship between elevation and body mass (BM) for hawkmoths at different taxonomic scales. a) BR-I: average intraspecific pattern obtained by pooling data of all individuals from all species. The red line represents the regression fit for the pooled data, while the black lines represent the 24 individual species which were sufficiently numerous (also see Figure S1); b) BR-S: interspecific pattern using species mean body size and midpoint of the elevational range; c) BR-C: (i) CM-S (Community mean using species data): Mean body mass across all co-occurring species at an elevation without considering their relative abundance (orange), (ii) CM-A (Species Community mean with species abundance): Mean of species mean trait value, weighted by elevation-specific abundance (red); (iii) CM-I (Community mean using individual data): Mean of all co-occurring individuals at an elevation, regardless of their species (grey). Regression coefficients for all the linear fits are listed in Table 1. All fits significant at p < 0.1 are shown as solid lines, and the rest are as dashed lines.

Interspecific Bergmann’s pattern (BR-S)
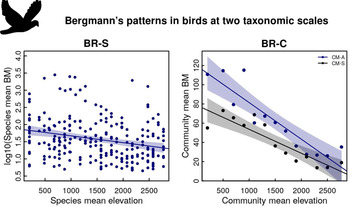
We found no support for an interspecific Bergmann’s pattern in hawkmoths using ordinary least squares regression (Table 1; Figure 2b; r 2 = −0.01, p = 0.6). Across the three hierarchical models, the explained variance (pseudo-r 2 ) was consistently high (>0.5) and increased with each nested level (subfamily = 0.57; tribe = 0.67; and genus = 0.80). Overall, integration of the phylogenetic information did not affect the significance of the BR-S pattern (p = 0.12–0.67). Contrary to hawkmoths, we found a significant converse Bergmann’s pattern for birds at the interspecific level (Table 1; Figure 3a; r 2 = 0.06, p < 0.01). Phylogenetic generalized least square (PGLS) models gave similar results (Table 1; λ = 0.88; 95% confidence interval = [0.85, 0.90]); hence, we discuss only OLS results below.
Relationship between elevation and body mass (BM) for birds at two taxonomic scales. a) BR-S: interspecific pattern using species mean body size and midpoint of elevational range; b) BR-C: (i) CM-S (Community mean using species data): Mean body mass across all co-occurring species at an elevation without considering their relative abundance, (ii) CM-A (Species Community mean with species abundance): Mean of species mean trait value, weighted by elevation-specific abundance; regression coefficients for all the linear fits are listed in Table 1. The regression lines were all significant at p < 0.1.

Community scale Bergmann’s pattern (BR-C)
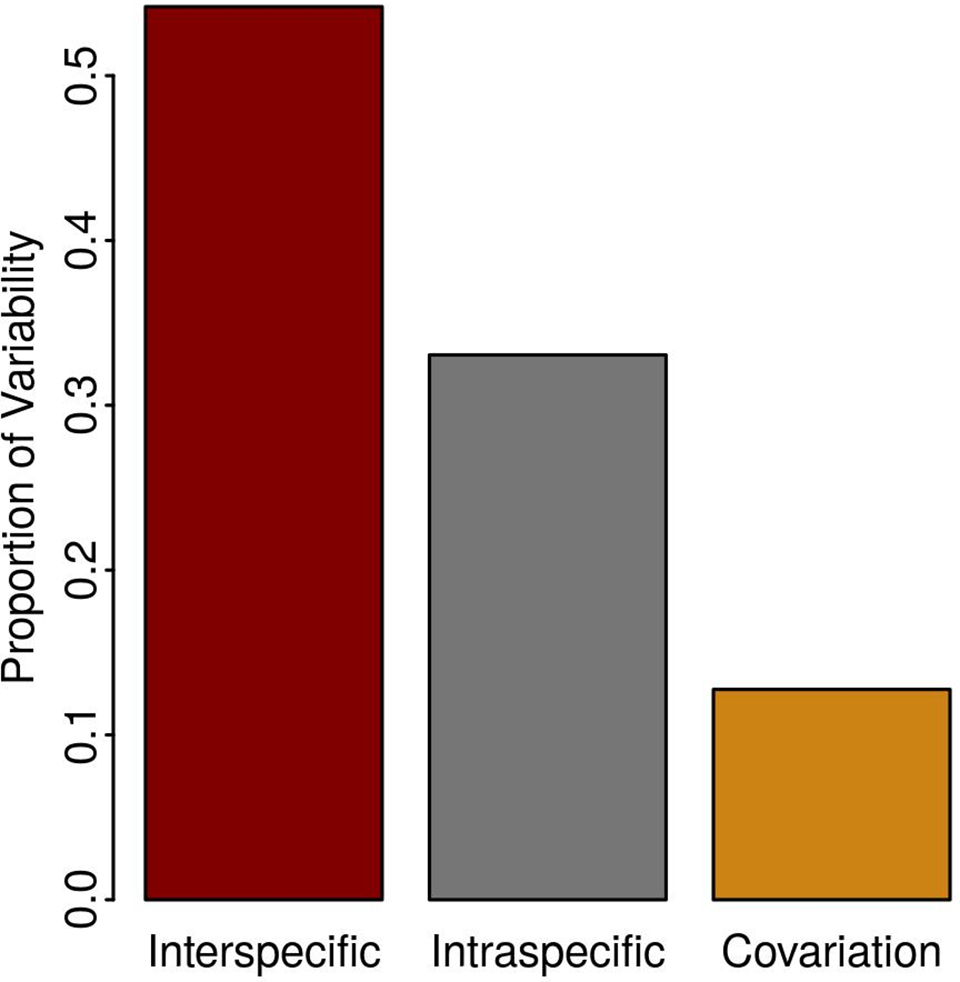
We found a significant positive Bergmann’s pattern in hawkmoths at the community level for the abundance-weighted metric without incorporating intraspecific variation, that is CM-A (Table 1; Figure 2c; r 2 = 0.33; p < 0.05) and for the abundance-weighted metric which incorporates intraspecific variation, that is CM-I (r 2 = 0.28; p < 0.05). However, surprisingly, we found a significant negative pattern using the metric CM-S which does not incorporate ‘local’ abundance or intraspecific variation (Table 1; Figure 2c; r 2 = 0.20; p < 0.1). Similar to the interspecific analysis, community mean body mass exhibited a significant converse Bergmann’s patterns in birds (Figure 3b). Unlike in hawkmoths, the pattern was consistent between CM-A (r 2 = 0.81; p < 0.01) and CM-S (r 2 = 0.78; p < 0.01). Weighting the communities by species richness (Table S3) or using median instead of mean (Table 1) did not significantly affect the parameter estimates, for both hawkmoths and birds. Variance partitioning of hawkmoth community mean body mass showed that interspecific variation (STV) and intraspecific variation (ITV) contributed 54.2 ± 8.1% and 33.0 ± 5.5% respectively, with an overall 12.8 ± 8.4% positive co-variation between the two (Figure 4).
For hawkmoths, the relative contribution of intraspecific trait variation, species turnover (richness + abundance) and their covariation was assessed using the variance partitioning approach proposed by Léps et al. (2011).

Discussion
We have shown that hawkmoths and birds exhibit contrasting body size-elevation relationships at the abundance-weighted community level along the same 2600 m elevational transect in the east Himalayas. Interestingly, endothermic birds exhibited a strong converse Bergmann’s pattern while ectothermic hawkmoths showed a positive Bergmann’s pattern. Statistically, the patterns varied across different taxonomic scales within each group, although qualitatively they were similar only in case of birds. Hawkmoths exhibited significant Bergmann’s patterns at the intraspecific (BR-I) and the community scales (CM-I and CM-A), but not when the metric did not include local trait or abundance (i.e. interspecific approach; BR-S). Interestingly, the community scale pattern which did not include local species abundances (i.e. CM-S) was contrary to that of abundance-based metrics, that is community species mean decreased with elevation. Some of the more abundant hawkmoth species for which we could test the intraspecific pattern individually showed a variety of patterns including positive, negative and no correlation. On the other hand, we detected the converse Bergmann’s pattern in birds at all investigated taxonomic scales (i.e. BR-S, BR-CM-S & BR-CM-A). However, statistically it was strongest for the abundance-weighted community mean and the least for the interspecific approach. In the absence of traits of individual birds, we could not test for the metrics which required individual trait measurements. Clearly, thermoregulation is not the only or even the primary mechanism influencing the body size-temperature relationship, even in endotherms. More importantly, overall, all metrics which incorporate local traits and/or abundance show stronger correlations of body mass with elevation, than when this information is lacking.
The variety in the observed patterns of the body size-temperature relationship has largely been attributed to life-history-related traits of different taxa (e.g. endotherms vs ectotherms; mesotherms vs exotherms). However, our study provides evidence for differing patterns for the same taxon, across different taxonomic scales (intraspecific, interspecific or community), and with different metrics (e.g. with or without abundance, with or without individual trait measurements), even when using the same data set. Clearly, the scale and the metric with which Bergmann’s pattern is tested influences the conclusion of a study; that is, each combination of metric and scale, presumably reflecting a different process, has its own body size-temperature pattern. Therefore, it may be best to treat ‘Bergmann’s Rule’ simply as a label for a pattern associated with the negative relationship between body size and temperature; identifying the underlying process necessarily requires an understanding of the metric and the scale involved, as also an appreciation of how the pattern changes with these two, even for the same data.
Along with taxonomic scales, another important consideration when comparing body size variation across studies is the difference in the spatial scales (Levins Reference Levin1992, Chase and Knight Reference Chase and Knight2013, Chase et al. Reference Chase, McGill, McGlinn, May, Blowes, Xiao, Knight, Purschke and Gotelli2018). Most studies of Bergmann’s pattern have been conducted across continental scales (i.e. latitudinal gradients; Olalla-Tárraga et al. Reference Olalla-Tárraga, Rodríguez and Hawkins2006, Rodríguez et al. 2008, Ollala-Tarraga et al. 2010, Zeuss et al. Reference Zeuss, Brunzel and Brandl2017). It has been suggested that the dominance of species turnover obviates the need to incorporate intraspecific or abundance variation at latitudinal scales, whereas intra-community dynamics, such as competition, play a stronger role in facilitating co-existence for shorter elevational transects where the environment changes substantially within a small geographic scale (Siefert et al. Reference Siefert, Violle, Chalmandrier, Albert, Taudiere, Fajardo, Aarssen, Baraloto, Carlucci, Cianciaruso and de Dantas2015). However, a large number of intraspecific analyses of Bergmann’s patterns have shown that many species can exhibit substantial phenotypic or genetic variation in body mass even across continental scales (Ashton Reference Ashton2002, Adams and Church 2007, Hassall Reference Hassall2015, Goldberg et al. Reference Goldberg, Cardozo, Brusquetti, Bueno Villafañe, Caballero Gini and Bianchi2018). To our best knowledge, no study has yet assessed the role of intraspecific/abundance variation in determining community-level Bergmann’s patterns across broad latitudinal gradients, although examples exist in the plant functional ecology literature (Siefert et al. Reference Siefert, Violle, Chalmandrier, Albert, Taudiere, Fajardo, Aarssen, Baraloto, Carlucci, Cianciaruso and de Dantas2015).
In our study, which spans a geographically compact transect, metrics which used abundance show higher significance of correlation, more so for hawkmoths than for birds. The difference in role of species abundance between hawkmoths and birds may be related to their beta diversities: 0.68 for hawkmoths and 0.93 for birds (Sørensen Indices; Supporting Information Figure S3), suggesting the presence of species with broader rangers in the former. Intraspecific variation and change in abundance may play a greater role in the change in community mean trait in taxa containing species with large geographical ranges. This also corroborates the lack of any significant correlation in the BR-S and BR-CM-S approach for hawkmoths, both of which lacked species relative abundances. On the other hand, turnover in species occurrences dominated the community-mean variation in birds, and hence, the negative body mass-elevation correlation was detected with and without abundance in both BR-S and BR-C.
Further, while latitudinal and elevational transects are most often viewed as similar through the prism of temperature, they differ in several important, but rarely considered, determinants of animal body size like oxygen availability (Körner 2007), air density (Dillon et al. Reference Dillon, Frazier and Dudley2006), UV-radiation (Mani Reference Mani1968), etc. which may have contrasting influence on organismal body size through multiple pathways (Klepsatel et al. Reference Klepsatel, Gáliková, Huber and Flatt2014). For instance, temperature seasonality is more prominent at high latitudes than at high elevations in the tropics (Rahbeck 1997, Körner Reference Körner2000). Contrasting patterns of body size variation between latitudinal and elevational gradients have been reported for both endotherms and ectotherms (Gutiérrez-Pinto et al. Reference Gutiérrez-Pinto, McCracken, Alza, Tubaro, Kopuchian, Astie and Cadena2014, Klepsatel et al. Reference Klepsatel, Gáliková, Huber and Flatt2014, Sun et al. 2017), and therefore, coherence between latitudinal and elevational Bergmann’s patterns is not always to be expected.
Bergmann’s patterns in hawkmoths
At the intraspecific scale, the co-added data from individuals of all hawkmoth species exhibited a weak but statistically significant positive Bergmann’s pattern. It should be noted that this is the average intraspecific value for the entire community. Of the 24 species tested separately, 6 (25%) exhibited a significant Bergmann’s pattern while 1 species exhibited a converse Bergmann’s pattern. Two of these (Cechetra lineosa and Acosmeryx naga) represent the most abundant species in the region (>25% in our data set) and span almost the entire sampled elevational extent. It has been previously remarked that intraspecific clines in body size are generally expected only for the ‘common’ species with large geographic ranges (sensu Chown and Gaston Reference Chown and Gaston2010). One reason for this may be the lack of statistical power for the smaller samples of the less abundant species for a given effort. Another reason for this may come from the generally smaller geographical, and hence environmental ranges associated with rare species. Therefore, the intrinsic dispersion in the trait values within such a species would be a larger fraction of the width in environmental optimum across the geographical range. Whether the intraspecific Bergmann’s clines in species of hawkmoths of our study region are due to genetic adaptation or phenotypic plasticity remains to be investigated.
At the species level, we did not find any significant correlation between body mass and elevation, which is in agreement with the three previous studies of the interspecific Bergmann’s pattern in moths: of hawkmoths across latitude (Beerli et al. Reference Beerli, Bärtschi, Ballesteros-Mejia, Kitching and Beck2019), of Geometridae across elevation (Brehm and Fiedler Reference Brehm and Fiedler2004) and of macrolepidoptera in general across elevation (Beck et al. Reference Beck, Liedtke, Widler, Altermatt, Loader, Hagmann, Lang and Fiedler2016). Beerli et al. (Reference Beerli, Bärtschi, Ballesteros-Mejia, Kitching and Beck2019) reported a support for the resource availability hypothesis for hawkmoths at a latitudinal scale which links adult body size to resource availability during the developmental phase (Rosenzweig Reference Rosenzweig1968). Our results do not support this, since productivity was strongly negatively correlated with elevation along our study transect (NDVI ∼ elevation: r 2 = 0.84; p < 0.01).
No previous work has assessed community-level variation in body size for the hawkmoth family. Brehm and Fiedler (Reference Brehm and Fiedler2004) found no significant trend for the family Geometridae at the community level, although their smaller sampled elevational range (1000–2700 m) may have made the detection more difficult. On the other hand, Zeuss et al. (Reference Zeuss, Brunzel and Brandl2017) found a converse Bergmann’s pattern for lepidopteran assemblages at a continental scale. They showed that voltinism, or the number of generations per year, may limit adult body size in macrolepidoptera by affecting the time available for development during the larval stage, although with species-specific exceptions. We note that the non-abundance-weighted community-mean metric yielded a converse Bergmann’s pattern in our study also, though we are not in a position to test for voltinism at this stage. Brehm et al. (Reference Brehm, Zeuss and Colwell2019) reported a positive Bergmann’s pattern in the ectothermic Geometridae and Arctiinae moths in Costa Rica and ruled out thermoregulation as the primary mechanism. It has been suggested that hawkmoths should be considered as (behavioural) endotherms – for the purpose of Bergmann’s pattern – because of their active ‘shivering’ of thoracic muscles to heat up the body (Heinrich Reference Heinrich1993; Beerli et al. Reference Beerli, Bärtschi, Ballesteros-Mejia, Kitching and Beck2019) which explains the positive body size-elevation relationship at the community level in our study. However, it may be noted that the only other community approach to Bergmann’s patterns in moths, which incorporates both – intraspecific variation and species relative abundances – and was conducted along a tropical elevational gradient for a direct comparison, also revealed a strong positive Bergmann’s patterns along the elevational gradient in strictly ectothermic groups, that is Geometridae and Arctiinae (Brehm et al. Reference Brehm, Zeuss and Colwell2019). This raises an important question of whether this similarity is methodological or mechanistic.
Overall, interspecific variation of species turnover accounted for an average 54%, whereas intraspecific variation accounted for 33% of the total community-level body mass variance in hawkmoths as shown through variance partitioning. This result is consistent with a growing body of literature advocating the use of both individual and species-specific traits to investigate community-level trait-environment relationships (Jung et al. Reference Jung, Albert, Violle, Kunstler, Loucougaray and Spiegelberger2014, Siefert et al. Reference Siefert, Violle, Chalmandrier, Albert, Taudiere, Fajardo, Aarssen, Baraloto, Carlucci, Cianciaruso and de Dantas2015, Enquist et al. Reference Enquist, Norberg, Bonser, Violle, Webb, Henderson, Sloat and Savage2015, Classen et al. Reference Classen, Steffan-Dewenter, Kindeketa and Peters2017). Only few studies have explored the extent of intraspecific variability in insect communities till date and obtained very contrasting values (e.g. <5% for dung beetles (Insecta: Coleoptera) by Griffiths et al. Reference Griffiths, Louzada, Bardgett and Barlow2016; <1% for stonefly assemblages (Insecta: Plecoptera) by Garcia-Raventós et al. Reference Garcia Raventós, Viza, Tierno de Figueroa, Riera and Múrria2017 and >70% for spider communities (Arachnida: Araneae) by Dahirel et al. Reference Dahirel, Dierick, De Cock and Bonte2017). Interestingly, our results are very similar to the values reported for several plant communities (reviewed in Auger and Shipley Reference Auger and Shipley2013 and global meta-analysis in Siefert et al. Reference Siefert, Violle, Chalmandrier, Albert, Taudiere, Fajardo, Aarssen, Baraloto, Carlucci, Cianciaruso and de Dantas2015). Other taxa have reported mixed results (33% for tadpoles by Xavier Jordani et al. Reference Xavier Jordani, Mouquet, Casatti, Menin, de Cerqueira Rossa-Feres and Albert2019; 70% in lichens by Asplund and Wardle Reference Asplund and Wardle2014). It is suggested that community-level trait variation, especially across broad environmental gradients, is driven primarily by species turnover, but the relative importance of intraspecific variation depends strongly on the trait, environmental factor and spatial scale considered (Araújo and Costa-Pereira Reference Araújo and Costa-Pereira2013, Siefert et al. 2014). In the context of Bergmann’s pattern, our results suggest that intraspecific variation should be an important consideration for groups with low beta diversity (i.e. large ranges of species within the study site) and at shorter spatial scales (e.g. local elevational transects). However, more studies will be needed to affirm the generality of this observation.
Converse Bergmann’s patterns in birds
We found a converse Bergmann’s pattern in birds at both community and interspecific scales. This is entirely against the expectation from the classical thermoregulatory mechanism in endothermic organisms, but matches with the previous (interspecific) pattern observed in the region (Schumm et al. Reference Schumm, White, Supriya and Price2020). Schumm et al. (Reference Schumm, White, Supriya and Price2020) reported a decreasing trend for forest species and positive relationship for open habitat species and an initial decrease followed by increase above 3500 m elevation for the entire community. We note that this transition in pattern occurred above our sampling limit. Freeman (Reference Freeman2017) found no significant relationship between species body mass and elevational range midpoint for passerines in New Guinea, Peru and Costa Rica and suggested that thermoregulation may not be the primary determinant for avian body mass along tropical elevational transects.
Birds are among the most studied of animal groups, and ecologists have a better understanding of the various life-history traits that characterize this speciose group. Not surprisingly, Bergmann’s pattern has been explored along multiple life-history dimensions to understand their impact on the basic thermoregulatory paradigm. We have already discussed the issue of beta diversity impacting Bergmann’s pattern. While thermoregulation may cause body size to increase with decreasing temperature, resource (food) availability may result in a positive correlation due to reduced primary productivity at low temperatures. In this context, it has been reported that the decrease of avian body size with elevation in the eastern Himalayas is correlated with decreasing arthropod (their prey) body size (Price et al. Reference Price, Hooper, Buchanan, Johansson, Tietze, Alström, Olsson, Ghosh-Harihar, Ishtiaq, Gupta and Martens2014, Schumm et al. Reference Schumm, White, Supriya and Price2020). But, results from Brehm et al. (Reference Brehm, Zeuss and Colwell2019) and this work show that all insect groups do not show such a decrease, especially when local abundances are incorporated.
The expected Bergmann’s pattern has been seen more regularly in birds across latitudinal gradients, but even here the results suggest the modifying influence of life-history traits: weaker pattern for species which are migratory and/or have sheltered nesting in the western Palaearctic (Mainwaring and Street Reference Mainwaring and Street2019); contrasting pattern for endemics and non-endemics in the Andes, both along latitudinal and elevational gradients; successful establishment of alien species is less dependent on thermoregulatory considerations than the location of introduction (Blackburn et al. Reference Blackburn, Redding and Dyer2019). In an important discussion, Blackburn and Ruggiero (Reference Blackburn and Ruggiero2001) showed a discrepancy between latitudinal and elevational relationships for Andean passerines suggesting important mechanistic differences depending on spatial and taxonomic scales (also see Romano et al. 2020). On the other hand, Olson et al. (Reference Olson, Davies, Orme, Thomas, Meiri, Blackburn, Gaston, Owens and Bennett2009) concluded from a global analysis of over 9000 species that the positive Bergmann’s pattern was driven by a combination of temperature and resource availability. Analysing a large data set of North American birds, Goodman et al. (Reference Goodman, Lebuhn, Seavy, Gardali and Bluso-Demers2012) found that body size was more impacted by climatic variability and primary productivity than mean ambient temperature. We re-emphasize that taxonomic and spatial scales are important considerations for comparing mechanistic processes; however, we did not find any previous study that has assessed body size variation in birds along elevational transects using abundance-weighted community mean, for a direct comparison.
Conclusion
Despite a large body of literature on characterizing Bergmann’s patterns, no study has yet empirically demonstrated geographic gradients in body size at the population, species and community level using the same data. Our cross-taxon and cross-scale comparison using hawkmoths and birds along the same 2600 m elevational gradient revealed discrepant patterns for the two taxa and at different taxonomic scales. We suggest that drawing taxon-specific generalization of processes, on the basis of results from across taxonomic scales, is premature. We further highlight the importance of species abundances and intraspecific variation for characterizing geographic gradients in body size at the level of communities and suggest that the validity of the current approach of using assemblage means based on species occurrences and mean body sizes needs to be empirically verified, especially along elevational gradients that may span the entire geographic ranges of several species within taxa. Methodologically, we argue for a community-oriented approach in future studies for addressing the generality of Bergmann’s pattern because of its potential in resolving the relative importance of individual and species-level processes. Our study, though not conducted to explicitly test any particular mechanism, provides strong support against the classical thermoregulatory mechanism in endotherms and warrants further investigations into the likely mechanism (including heat conservation) governing body size patterns for ectotherms. More in-depth analysis across different taxonomic scales, especially in a comparative framework across different taxa along the same transect, is required for an accurate characterization of Bergmann’s pattern. We conclude by reiterating the key lesson from this study that every study should consider, and address, the taxonomic- and spatial scale dependency of Bergmann’s patterns, and species relative abundance and intraspecific trait variation may be essential ingredients for doing so.
Supplementary material
For supplementary material accompanying this paper visit https://doi.org/10.1017/S0266467421000432
Acknowledgments
We thank Trevor Price for valuable comments on the draft that has improved this work. We are grateful for the enormous support from the Singchung Bugun community, especially Mr. Indi Glow, Nima Tsering and Puspalal Sharma.
Financial support
This work was funded by the Department of Science and Technology, Government of India (Grant No. SR/SO/AS66/2011), the Nadathur Trust, Bengaluru and IISER, Pune.
Conflict of interest
The authors declare that they have no conflict of interest.
Author contributions
MM and RA conceived the ideas, designed the methodology and shared the field work and data curation for the hawkmoth data. RP conducted the field work for the bird data, under the supervision of RA. MM compiled traits and phylogeny for birds. MM and RA contributed equally to manuscript writing.
Data accessibility statement
All data used for analysis will be made available via the DRYAD repository.
Ethics statement
We thank the Forest Department of Arunachal Pradesh for their assistance and research permits (CWL/G/13(95)/2011-12/Pt.II/660-62 during 2011-2015).