



1. Introduction
The interaction of fluids and electric fields is at the heart of natural phenomena such as the disintegration of raindrops in thunderstorms and many practical applications such as electrosprays (Ganan-Calvo et al. Reference Ganan-Calvo, Lopez-Herrera, Herrada, Ramos and Montanero2018), microfluidics (Stone, Stroock & Ajdari Reference Stone, Stroock and Ajdari2005) and crude oil demulsification (Eow & Ghadiri Reference Eow and Ghadiri2002). Many of these processes involve drops and there has been growing interest in understanding drop–drop interactions in the presence of electric fields.
A drop placed in an electric field polarizes if its permittivity and/or conductivity are different than the suspending fluid. The polarization leads to a jump in the electric stresses across the drop interface. In the case of fluids that are perfect dielectrics, only the normal electric stress is discontinuous at the interface. If the electric pressure can be balanced by surface tension, the drop adopts a steady prolate ellipsoidal shape and the fluids are quiescent. The physical picture changes dramatically if the fluids are conducting materials. Finite conductivity, even if very low, enables the passage of electric current and electrical charge accumulates at the drop interface. The electric field acting on this induced surface charge creates tangential electric stress, which shears the fluids into motion. The complicated interplay between the electrostatic and viscous fluid stresses results in either oblate or prolate drop deformation in weak fields (Taylor Reference Taylor1966), and a complex dynamics in strong fields, such as break-up (Torza, Cox & Mason Reference Torza, Cox and Mason1971; Sherwood Reference Sherwood1988; Lac & Homsy Reference Lac and Homsy2007; Karyappa, Deshmukh & Thaokar Reference Karyappa, Deshmukh and Thaokar2014; Lanauze, Walker & Khair Reference Lanauze, Walker and Khair2015; Pillai et al. Reference Pillai, Berry, Harvie and Davidson2016; Wang, Ma & Siegel Reference Wang, Ma and Siegel2019), streaming either from the drop poles (Taylor Reference Taylor1964; de la Mora Reference de la Mora2007; Collins et al. Reference Collins, Jones, Harris and Basaran2008, Reference Collins, Sambath, Harris and Basaran2013; Herrada et al. Reference Herrada, López-Herrera, Gañán Calvo, Vega, Montanero and Popinet2012; Sengupta, Walker & Khair Reference Sengupta, Walker and Khair2017) or equator (Brosseau & Vlahovska Reference Brosseau and Vlahovska2017; Wagoner et al. Reference Wagoner, Vlahovska, Harris and Basaran2020) and electrorotation (Ha & Yang Reference Ha and Yang2000; Salipante & Vlahovska Reference Salipante and Vlahovska2010, Reference Salipante and Vlahovska2013; Das & Saintillan Reference Das and Saintillan2017).
While the prototypical problem of an isolated drop in a uniform electric field has been extensively studied (see for a recent review (Vlahovska Reference Vlahovska2019)), investigations of the collective dynamics of many drops are scarce (Fernandez Reference Fernandez2008a,Reference Fernandezb; Casas et al. Reference Casas, Garzon, Gray and Sethian2019) and mainly focused on the near-contact interaction preceding electrocoalescence (Anand et al. Reference Anand, Roy, Naik, Juvekar and Thaokar2019; Roy, Anand & Thaokar Reference Roy, Anand and Thaokar2019). The dynamics of drop approach and interactions at arbitrary separations has been considered mainly in the case of droplet pairs aligned with the electric field (Sozou Reference Sozou1975; Baygents, Rivette & Stone Reference Baygents, Rivette and Stone1998; Lin, Skjetne & Carlson Reference Lin, Skjetne and Carlson2012; Mhatre, Deshmukh & Thaokar Reference Mhatre, Deshmukh and Thaokar2015; Zabarankin Reference Zabarankin2020), because the axial symmetry greatly simplifies the calculations. These studies revealed that in weakly conducting fluid systems, which can be modelled using the leaky dielectric model (Melcher & Taylor Reference Melcher and Taylor1969), the hydrodynamic interactions due to the electric-shear-driven flow can play a significant role. For example, in the case of a drop with drop–medium ratios of conductivities  $R$ and permittivities
 $S$ such that
 $R/S>1$, the electrohydrodynamic flow generates repulsion which opposes the electrostatic attraction due to the drop dipoles and the drops move apart.
The general case of an electric field applied at an angle to the line joining the centres of the two drops is studied only to a limited extent experimentally (Mhatre et al. Reference Mhatre, Deshmukh and Thaokar2015) and via numerical simulations in two dimensions (Dong & Sau Reference Dong and Sau2018). This configuration has been systematically analysed only for a pair of non-deformable, ideally polarizable spheres (Saintillan Reference Saintillan2008). In this case, the flow about the spheres has the same stresslet-quadrupole structure as the electrohydrodynamic flow about a drop with  $R/S<1$ even though the flow is due to induced charge electroosmosis, unlike the leaky dielectric drops where Debye charge clouds are absent. The study showed that the pair dynamics is not a simple attraction or repulsion; depending on the angle between the centre-to-centre line and the undisturbed electric field, the relative motion of the two spheres can be quite complex: they attract in the direction of the field and move towards each other, pair up and then separate in the transverse direction. To the best of our knowledge, such a dynamics in the case of drops has not been reported. Motivated by the observed intricate trajectories of ideally polarizable spheres and the potential similarities to the electrohydrodynamic interactions of drops with
 $R/S<1$, we set out to investigate the effects of drop electric properties (conductivity ratio
 $R$ and permittivity ratio
 $S$) and deformability on the relative motion of a drop pair initially misaligned with the applied field. The paper is organized as follows: § 2 sets up the problem, § 3 outlines the numerical method, § 4 describes an analytical theory for drop pair interaction and relative motion in an applied uniform DC electric field, § 5 presents results from drop pair dynamics at different initial configurations and drop electrical properties and § 6 summarizes the main results.
2. Problem formulation
Let us consider two identical neutrally buoyant and charge-free drops with radius  $a$, viscosity
 $\eta _{{{d}}}$, conductivity
 $\sigma _{{{d}}}$ and permittivity
 ${\varepsilon }_{{{d}}}$ suspended in a fluid with viscosity
 $\eta _{{{s}}}$, conductivity
 $\sigma _{{{s}}}$ and permittivity
 ${\varepsilon }_{{{s}}}$. The mismatch in drop and suspending fluid properties is characterized by the conductivity, permittivity, and viscosity ratios
 \begin{equation} R=\frac{\sigma_{{{d}}}}{\sigma_{{{s}}}},\quad S=\frac{{\varepsilon}_{{{d}}}}{{\varepsilon}_{{{s}}}},\quad \lambda=\frac{\eta_{{{d}}}}{\eta_{{{s}}}}. \end{equation}
The distance between the drops’ centroids is  $d$ and the angle made with the drops’ line of centres and the applied field direction is
 $\varTheta$. The unit separation vector between the drops is defined by the difference between the position vectors of the drops’ centres of mass
 $\boldsymbol {\hat {d}}=(\boldsymbol {x}_2^c-\boldsymbol {x}^c_1)/d$. The unit vector normal to the drops' line of centres and orthogonal to
 $\boldsymbol {\hat {d}}$ is
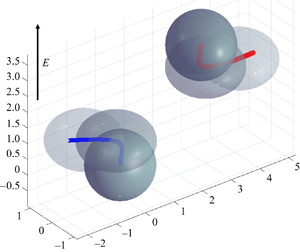
 ${\boldsymbol {\hat {t}}}$. The problem geometry is sketched in figure 1.
Two initially spherical identical drops with radius  $a$, permittivity
 ${\varepsilon }_{{{d}}}$ and conductivity
 $\sigma _{{{d}}}$ suspended in a fluid with permittivity
 ${\varepsilon }_{{{s}}}$ and conductivity
 $\sigma _{{{s}}}$ and subjected to a uniform DC electric field
 $\boldsymbol {E}^\infty =E_0\boldsymbol {\hat{\boldsymbol{z}}}$. The angle between the line-of-centres vector and the field direction is
 $\varTheta =\arccos (\boldsymbol {\hat {z}}\boldsymbol {\cdot }\boldsymbol {\hat {d}})$.

We adopt the leaky dielectric model (Melcher & Taylor Reference Melcher and Taylor1969), which assumes creeping flow and charge-free bulk fluids acting as ohmic conductors. Albeit an approximation of the actual electrokinetic problem (Saville Reference Saville1997; Schnitzer & Yariv Reference Schnitzer and Yariv2015; Ganan-Calvo et al. Reference Ganan-Calvo, Lopez-Herrera, Rebollo-Munoz and Montanero2016, Reference Ganan-Calvo, Lopez-Herrera, Herrada, Ramos and Montanero2018; Mori & Young Reference Mori and Young2018), the leaky dielectric model has been successful in modelling many phenomena not only in poorly conducting fluids such as oils, but also aqueous electrolyte solutions such as in cell-mimicking vesicle systems (Vlahovska et al. Reference Vlahovska, Gracia, Aranda-Espinoza and Dimova2009; Vlahovska Reference Vlahovska2019). The assumption of charge-free fluids decouples the electric and hydrodynamic fields in the bulk. Accordingly,
 \begin{equation} \boldsymbol{\nabla} \boldsymbol{\cdot} \boldsymbol{T}^{{{hd}}}=\eta \nabla^2\boldsymbol{u}-\boldsymbol{\nabla} p=0,\quad \boldsymbol{\nabla}\boldsymbol{\cdot} \boldsymbol{T}^{{{el}}}=0, \end{equation}
where  $T^{{{hd}}}_{ij}=-p\delta _{ij}+\eta (\partial _j u_i+\partial _i u_j)$ is the hydrodynamic stress and
 $\delta _{ij}$ is the Kronecker delta function;
 $\boldsymbol {u}$ and
 $p$ are the fluid velocity and pressure. The electric stress is given by the Maxwell stress tensor
 $T^{{{el}}}_{ij}={\varepsilon } (E_iE_j-E_kE_k\delta _{ij}/2)$. The coupling of the electric field and the fluid flow occurs at the drop interfaces
 $\mathcal {D}$, where the charges brought by conduction accumulate. Gauss’ law dictates that the electric field
 $\boldsymbol {E}$ in the electroneutral bulk fluids is solenoidal,
 $\boldsymbol {\nabla }\boldsymbol {\cdot } \boldsymbol {E}=0$, however, at the drop interface, the electric displacement field,
 ${\varepsilon } \boldsymbol {E}$, is discontinuous and its jump corresponds to the surface charge density
 \begin{equation} {\varepsilon}(E_n^{{s}}-S E_n^{{{d}}})=q, \quad \boldsymbol{x}\in \mathcal{D}, \end{equation}
where  $E_n=\boldsymbol {E}\boldsymbol {\cdot }\boldsymbol {n}$, and
 $\boldsymbol {n}$ is the outward pointing normal vector to the drop interface. The surface charge density adjusts to satisfy the current balance
 \begin{equation} \frac{\partial q}{\partial t}+\boldsymbol{\nabla}_s\boldsymbol{\cdot}(\boldsymbol{u} q) =\sigma_{{{s}}} (E_n^{{s}}-R E_n^{{{d}}}), \quad \boldsymbol{x}\in \mathcal{D}. \end{equation}
In this study, we neglect charge relaxation and convection, thereby reducing the charge conservation equation to continuity of the electrical current across the interface as originally proposed by Taylor (Reference Taylor1966)
 \begin{equation} E_n^{{s}}=R E_n^{{{d}}}. \end{equation}
The electric field acting on the induced surface charge gives rise to an electric shear stress at the interface. The tangential stress balance yields
 \begin{equation} \left(\boldsymbol{I}-\boldsymbol{n}\boldsymbol{n}\right)\boldsymbol{\cdot} (\boldsymbol{T}^{{s}}- \boldsymbol{T}^{{{d}}})\boldsymbol{\cdot}\boldsymbol{n}+q\boldsymbol{E}_t=0, \quad \boldsymbol{x}\in \mathcal{D}, \end{equation}
where  $\boldsymbol {E}_t=\boldsymbol {E}-E_n\boldsymbol {n}$ is the tangential component of the electric field, which is continuous across the interface, and
 $\boldsymbol {I}$ is the idemfactor. The normal stress balance is
 \begin{equation} \boldsymbol{n} \boldsymbol{\cdot}(\boldsymbol{T}^{{s}}- \boldsymbol{T}^{{{d}}})+\tfrac{1}{2}((E_n^{{{s}}})^2-S (E_n^{{{d}}})^2-(1-S)E_t^2)=\gamma(\boldsymbol{\nabla}_s\boldsymbol{\cdot} \boldsymbol{n})\boldsymbol{n}, \quad \boldsymbol{x}\in \mathcal{D}, \end{equation}
where  $\gamma$ is the interfacial tension.
Henceforth, all variables are non-dimensionalized using the radius of the undeformed drops  $a$, the undisturbed field strength
 $E_0$, a characteristic applied stress
 $\tau _c={\varepsilon }_{{{s}}} E_0^2$ and the properties of the suspending fluid. Accordingly, the time scale is
 $t_c=\eta _{{{s}}}/\tau _c$ and the velocity scale is
 $u_c=a \tau _c/\eta _{{{s}}}$. The ratio of the magnitude of the electric stresses and surface tension defines the electric capillary number
 \begin{equation} Ca=\frac{{\varepsilon}_{{{s}}} E_0^2 a}{\gamma}. \end{equation}
The simplification of the charge conservation equations (2.4) and (2.5) implies  ${\varepsilon }^2_{{{s}}} E_0^2/(\eta _{{{s}}}\sigma _{{{s}}})\ll 1$. This condition is satisfied for the typical fluids used in experiments such as castor oil (conductivity is
 ${\sim }10^{-11}\ \textrm {S}\,\textrm {m}^{-1}$, viscosity is
 ${\sim }1\ \textrm {Pa}\,\textrm {s}$) and low field strengths
 $E_0\sim 10^4\ {\rm V}\ {\rm m}^{-1}$. Furthermore, the momentum diffusion time scale,
 $a^2\rho /\eta _{{{s}}}$, for drops of typical size
 $a\sim 1\ \textrm {mm}$ is much shorter than the electrohydrodynamic flow time scale
 $\eta _{{{s}}}/({\varepsilon }_{{{s}}} E_0^2)$, which justifies the use of the steady Stokes equation to describe the fluid flow (2.2).
3. Numerical method
We utilize the boundary integral method to solve for the flow and electric fields. Details of our three-dimensional formulation can be found in Sorgentone, Tornberg & Vlahovska (Reference Sorgentone, Tornberg and Vlahovska2019). In brief, the electric field is computed following (Baygents et al. Reference Baygents, Rivette and Stone1998; Lac & Homsy Reference Lac and Homsy2007)
 \begin{equation} \boldsymbol{E}^\infty+\sum_{j=1}^2 \int_{{\mathcal{D}}_j} \frac{\hat{\boldsymbol{x}}}{4{\rm \pi} r^3} {(\boldsymbol{E}^{{s}}-\boldsymbol{E}^{{{d}}})\boldsymbol{\cdot}\boldsymbol{n}}\,\textrm{d}S(\,\boldsymbol{y})= \begin{cases} \boldsymbol{E}^{{{d}}}(\boldsymbol{x}) & \text{if } \boldsymbol{x} \text{ inside } \mathcal{D}, \\ \tfrac{1}{2} (\boldsymbol{E}^{{{d}}}(\boldsymbol{x})+\boldsymbol{E}^{{s}}(\boldsymbol{x})) & \text{if } \boldsymbol{x} \in\mathcal{D}, \\ \boldsymbol{E}^{{s}}(\boldsymbol{x}) & \text{if } \boldsymbol{x} \text{ outside } \mathcal{D}, \end{cases} \end{equation}
where  $\boldsymbol {\hat {x}}=\boldsymbol {x}-\boldsymbol {y}$ and
 $r=|\boldsymbol {\hat {x}}|$. The normal and tangential components of the electric field are calculated from the above equation
 \begin{equation} \left. \begin{gathered} E_n(\boldsymbol{x})=\frac{2R}{R+1}\boldsymbol{E}^\infty \boldsymbol{\cdot} \boldsymbol{n}+\frac{R-1}{R+1} \sum_{j=1}^2 \boldsymbol{n}(\boldsymbol{x})\boldsymbol{\cdot}\int_{{\mathcal{D}}_j} \frac{\boldsymbol{\hat{x}} }{2{\rm \pi} r^3} E_n(\,\boldsymbol{y})\,\textrm{d}S(\,\boldsymbol{y}),\\ \boldsymbol{E}_t(\boldsymbol{x})=\frac{\boldsymbol{E}^{{s}}+\boldsymbol{E}^{{{d}}}}{2}-\frac{1+R}{2R}E_n \boldsymbol{n}. \end{gathered} \right\} \end{equation}
For the flow field, we have developed the method for fluids of arbitrary viscosity, but for the sake of brevity here we list the equation in the case of equiviscous drops and suspending fluids. The velocity is given by
 \begin{equation} 2\boldsymbol{u}(\boldsymbol{x})=-\sum_{j=1}^2 \left( \frac{1}{4{\rm \pi}}\int_{{\mathcal{D}}_j} \left(\frac{\boldsymbol{f}(\,\boldsymbol{y})}{Ca}-\boldsymbol{f}^E(\,\boldsymbol{y})\right)\boldsymbol{\cdot} \left(\frac{\boldsymbol{I}}{r}+\frac{\boldsymbol{\hat{x}}\boldsymbol{\hat{x}}}{r^3} \right)\,\textrm{d}S(\,\boldsymbol{y})\right), \end{equation}
where  $\boldsymbol {f}$ and
 $\boldsymbol {f}^E$ are the interfacial stresses due to surface tension and electric field
 \begin{align} \boldsymbol{f}=\boldsymbol{n}\boldsymbol{\nabla}_s \boldsymbol{\cdot} \boldsymbol{n},\quad \boldsymbol{f}^E=(\boldsymbol{E}^{{s}}\boldsymbol{\cdot} \boldsymbol{n})\boldsymbol{E}^{{s}}-\tfrac{1}{2} (\boldsymbol{E}^{{s}}\boldsymbol{\cdot}\boldsymbol{E}^{{s}})\boldsymbol{n}-S((\boldsymbol{E}^{{{d}}}\boldsymbol{\cdot} \boldsymbol{n})\boldsymbol{E}^{{{d}}}-\tfrac{1}{2} (\boldsymbol{E}^{{{d}}}\boldsymbol{\cdot}\boldsymbol{E}^{{{d}}})\boldsymbol{n}). \end{align}
Drop velocity and centroid are computed from the volume averages
 \begin{align} \boldsymbol{U}_j=\frac{1}{V}\int_{V_j}\boldsymbol{u}\,\textrm{d}V=\frac{1}{V}\int_{{\mathcal{D}}_j}\boldsymbol{n}\boldsymbol{\cdot}\left(\boldsymbol{u}\boldsymbol{x}\right) \,\textrm{d}S,\quad \boldsymbol{x}^c_j=\frac{1}{V}\int_{V_j}\boldsymbol{x}\, \textrm{d}V=\frac{1}{2V}\int_{{\mathcal{D}}_j}\boldsymbol{n}\left(\boldsymbol{x}\boldsymbol{\cdot} \boldsymbol{x}\right) \,\textrm{d}S. \end{align}
To solve the system of (3.2) and (3.3) we utilize the boundary integral method presented in Sorgentone et al. (Reference Sorgentone, Tornberg and Vlahovska2019). In the current study, however, we modify the time-stepper scheme to the adaptive fourth-order Runge–Kutta introduced in Kennedy & Carpenter (Reference Kennedy and Carpenter2003). All variables are expanded in spherical harmonics, which provides an accurate representation even for relatively low expansion order. In this respect, to make sure that all the geometrical quantities of interest (e.g. mean curvature) are computed with high accuracy as well, we adopt an adaptive upsampling procedure introduced by Rahimian et al. (Reference Rahimian, Veerapaneni, Zorin and Biros2015) which is based on the decay of the mean curvature spectrum and seems to work very well for this kind of simulation. When the drops are well separated from each other, the regular quadrature based on the trapezoidal rule in the longitudinal direction and on the Gauss–Legendre quadrature rule in the non-periodic direction works well. As they get closer, regular quadrature on a finer grid can still be used. Here, the density is interpolated to the finer (upsampled) grid, where the nearly singular kernel is better resolved. But at some point, a special quadrature method is needed since the quadrature error grows exponentially as we approach the surface and it is not possible to resolve the problem by grid refinement, i.e. upsampling. In Sorgentone & Tornberg (Reference Sorgentone and Tornberg2018) a numerical procedure based on interpolation first introduced by Ying, Biros & Zorin (Reference Ying, Biros and Zorin2006) is discussed and optimized to handle these complicated situations. The idea introduced in Ying et al. (Reference Ying, Biros and Zorin2006) for the nearly singular integration was to find the point  $x_*$ on the surface that is closest to the target point
 $x_0$. Then, continuing along a line that passes through
 $x_*$ and
 $x_0$, the integral is evaluated at a number of points
 $x_1 ,\ldots , x_n$ further away from the surface. This can be done by regular quadrature on the standard grid or on the upsampled grid, depending on how far the target point is from the surface. The value of the integral on the surface (at
 $x_*$) needs to be computed by a specialized quadrature rule for singular integrals. At this point a one-dimensional Lagrangian interpolation is used to compute the value at
 $x_0$ by interpolating the values at
 $x_*$ and
 $x_i$,
 $i = 1,\ldots , N$. In Sorgentone & Tornberg (Reference Sorgentone and Tornberg2018) it has been shown how to optimize this procedure, implementing a cell list algorithm to hierarchically find the closest point on the surface and using the spherical harmonic expansion to interpolate the on-surface integral value previously obtained on the whole surface (at the grid points only) by the special quadrature for singular integrals introduced in Veerapaneni et al. (Reference Veerapaneni, Rahimian, Biros and Zorin2011) and Rahimian et al. (Reference Rahimian, Veerapaneni, Zorin and Biros2015). The accuracy of the method depends on the numerical parameters involved: the maximum distance before we need to upsample the grid for the regular quadrature (that of course will depend on the grid resolution), the upsampling rate used in the intermediate region, the number of points used for interpolation for target points in the nearest region, the distance and the distribution of these points (Sorgentone & Tornberg Reference Sorgentone and Tornberg2018). We also use the spectral reparameterization technique presented in the same paper, designed to keep the representation optimal even under strong deformations. In our work, in order to be able to run long simulations and well resolve the close interactions, we set the spherical harmonic expansion order to
 $p=9$, and for the nearly singular quadrature, we set the upsampling rate in the intermediate region to 4 and the number of interpolating points to 8. The viscosity contrast is
 $\lambda =1$. Unless otherwise explicitly stated, the electric capillary number is
 $Ca=0.1$.
Our numerical method was validated against the simulation results of Baygents et al. (Reference Baygents, Rivette and Stone1998) and an analytical theory for spherical drops developed by us and presented in the next section. Figure 2 shows the results for the drop steady velocity as a function of the drop centroid separation for drops aligned with the field. Figure 3 illustrates the more general case of drops initially misaligned with the field. The simulations agree very well with the theory and show a complex dynamics such as the drops line-of-centres rotating away from the applied field direction and interaction switching from attraction to repulsion. This dynamics will be explored in more detail in § 5.
Comparison between our fully three-dimensional simulations and the axisymmetric simulations of a drop pair aligned with the field by Baygents et al. (Reference Baygents, Rivette and Stone1998). (a) Absolute value of the radial component of the steady drop velocity as a function of separation for  $Ca= 0.1$ (red dots) and 1 (blue dots) for a drop with
 $R=5$,
 $S=4$. Black dots are the data from figure 9 in Baygents et al. (Reference Baygents, Rivette and Stone1998) with
 $Ca=1$. Solid line is the theoretical
 $\boldsymbol {U}_2\boldsymbol {\cdot }\boldsymbol {\hat {d}}$ for a drop of low
 $Ca$ given by (4.7). The drop velocity at large separations shows the
 $1/d^2$ behaviour of a stresslet flow. (b) Absolute value of the steady velocity of a drop undergoing only a dielectrophoretic force,
 $R=S=5$, corresponding to figure 4(a) in Baygents et al. (Reference Baygents, Rivette and Stone1998). The black dots are from our fully three-dimensional code, the solid line is the dielectrophoretic velocity, (4.2), showing
 $1/d^4$ dependence.

Comparison between the simulations (black) and the analytical theory (red) for a drop pair with  $R=1$,
 $S=3$, initial separation 3.5, initial angle between the line of centres and the applied field direction
 $50^{\circ }$ and
 $Ca=0.1$. The trajectory was computed from the relative drop velocity (4.7). Time evolution of the (a) separation, (b) angle between the line of centres and applied field direction, (c) radial component of the relative velocity
 $\boldsymbol {U}\boldsymbol {\cdot }\boldsymbol {\hat {d}}$ and (d) tangential component of the relative velocity
 $\boldsymbol {U}\boldsymbol {\cdot }{\boldsymbol {\hat {t}}}$.

4. Theory: far-field interactions
To gain more physical insight, it is instructive to analyse the interaction of two widely separated spherical drops. In this case, the drops can be approximated as point dipoles. The disturbance field  $\boldsymbol {E}_1$ of the drop dipole
 $\boldsymbol {P}_1$ induces a dielectrophoretic (DEP) force on the dipole
 $\boldsymbol {P}_2$ located at
 $\boldsymbol {x}^c_2=d\boldsymbol {\hat {d}}$, given by
 $\boldsymbol {F}(d)=(\boldsymbol {P}_2\boldsymbol {\cdot } \boldsymbol {\nabla } \boldsymbol {E}_1)|_{r=d}$
 \begin{equation} \boldsymbol{F}(d)=\boldsymbol{P}_1\boldsymbol{P}_2:\boldsymbol{\nabla} \left.\left(\frac{\boldsymbol{I}}{r^3}-3\frac{\boldsymbol{x}\boldsymbol{x}}{r^5}\right)\right|_{r=d},\quad \boldsymbol{P}_1=\boldsymbol{P}_2=\frac{R-1}{R+2}\boldsymbol{E}^\infty. \end{equation}
The drop velocity under the action of this force can be estimated from Stokes’ law,  $\boldsymbol {U}^{{{dep}}}_2=-\boldsymbol {U}^{{{dep}}}_1=\boldsymbol {F} /\zeta$, where
 $\zeta$ is the friction coefficient,
 $\zeta =2{\rm \pi} (3\lambda +2)/(\lambda +1)$
 \begin{equation} \boldsymbol{U}_2^{{{dep}}}=\frac{\beta_D}{r^4}\frac{3(1+{\lambda})}{2+3{\lambda}}[(1-3\cos^2\varTheta)\boldsymbol{\hat{d}}-\sin\left(2\varTheta\right){\boldsymbol{\hat{t}}}],\quad \beta_D= \left(\frac{R-1}{R+2}\right)^2. \end{equation}
The relative DEP velocity,  $\boldsymbol {U}^{{{dep}}}=\boldsymbol {U}^{{{dep}}}_2-\boldsymbol {U}^{{{dep}}}_1$, depends on the angle
 $\varTheta =\arccos (\boldsymbol {\hat {d}}\boldsymbol {\cdot }\boldsymbol {\hat {z}} )$ between the direction of the external field and the line joining the centres of the two drops. Drops attract, i.e.
 $\boldsymbol {U}^{{{dep}}}\boldsymbol {\cdot }\boldsymbol {\hat {d}}<0$, if
 $\varTheta <\varTheta _c=\arccos ({1}/{\sqrt {3}})\approx 54.7^{\circ }$, e.g. when the drops are lined up with the field, and repulse if
 $\varTheta >\varTheta _c$, e.g. if the line of centres of the two drops is perpendicular to the field. The DEP interaction also causes drops to align with the field, since the tangential component of the relative velocity is always negative.
The electrohydrodynamic (EHD) flow about an isolated, spherical drop in an applied uniform electric field is a combination of a stresslet and a quadrupole (see appendix A for the flow evolution upon application of the electric field). At steady state,
 \begin{equation} \boldsymbol{u} = \frac{9}{10}\frac{S-R}{(2+R)^2(\lambda+1)}\boldsymbol{E^\infty E^\infty} : \left[\left(\frac{\boldsymbol{I}}{r^3}-3\frac{\boldsymbol{xx}}{r^5}\right)\boldsymbol{x} + \frac{1}{3}\boldsymbol{\nabla}\left(\frac{\boldsymbol{I}}{r^3}-3\frac{\boldsymbol{xx}}{r^5}\right) \right]. \end{equation}
At the surface of the drop,
 \begin{equation} \boldsymbol{u}\left(r=1\right)=\beta_T\sin(2\theta){\boldsymbol{\hat{\theta}}},\quad \beta_T=\frac{9}{10}\frac{R-S}{\left(1+\lambda\right)\left(R+2\right)^2}. \end{equation}
If  $R/S<1$, the surface flow is from pole to equator, i.e. fluid is drawn in at the poles and pushed away from the drop at the equator. The flow direction is reversed for
 ${R/S>1}$. A second drop moves in response to the EHD flow (4.3). The drop translational velocity is found from Faxen's law (Kim & Karrila Reference Kim and Karrila1991)
 \begin{equation} {\boldsymbol{U}}^{{{ehd}}}_{2} = \left(1 + \frac{\lambda}{2(3\lambda+2)}\nabla^2\right)\boldsymbol{u}|_{\boldsymbol{x}=d\boldsymbol{\hat{d}}}. \end{equation}
Inserting (4.3) in the above equation leads to
 \begin{align} {\boldsymbol{U}}^{{{ehd}}}_{2} &= \beta_T\left(\frac{1}{ d^2}-\frac{2}{d^4}\left(\frac{1+3{\lambda}}{2+3{\lambda}}\right)\right)(-1+3 \cos^2\varTheta)\boldsymbol{\hat{d}}\nonumber\\ &\quad -\frac{2\beta_T}{d^4}\left(\frac{1+3{\lambda}}{2+3{\lambda}}\right)\sin(2\varTheta){\boldsymbol{\hat{t}}}+O(d^{-5}). \end{align}
The radial component of the EHD velocity, and thus the sign of the EHD interaction (attraction or repulsion), changes sign at the same angle as the DEP interaction,  $\varTheta _c=54.7$. If
 $R/S<1$, the EHD flow is attractive when drops are aligned with the applied field and repulsive when the line of centres is perpendicular to the field direction. The interaction is reversed for
 $R/S>1$. Notably, unlike the DEP interaction which always drives the drops to align with the applied field direction, the EHD can cause the drops’ line of centres to rotate away from the direction of the applied field if
 $\beta _T<0$, i.e.
 $R/S<1$.
Combining the EHD and the DEP velocities yields the relative drop velocity. Since the drops studied here are identical, drop motions are reciprocal. Therefore, the relative drop velocity  $\boldsymbol {U}=\boldsymbol {U}_2-\boldsymbol {U}_1=2\boldsymbol {U}_2$
 \begin{align} \boldsymbol{U}=\frac{2\beta_T}{ d^2}(-1+3 \cos^2\varTheta)\boldsymbol{\hat{d}}-\varPhi(R, S, {\lambda})\frac{4}{d^4}((-1+3 \cos^2\varTheta)\boldsymbol{\hat{d}}+\sin(2\varTheta){\boldsymbol{\hat{t}}})+O(d^{-5}), \end{align}
where
 \begin{equation} \varPhi=\frac{1+3{\lambda}}{2+3{\lambda}}\left(\beta_T+3\beta_D\frac{1+\lambda}{1+3\lambda}\right). \end{equation}
The discriminant  ${\varPhi }$ quantifies the drop pair alignment with the field and the interplay of EHD and DEP interactions in drop attraction or repulsion. The line of centres between two drops with
 $\varPhi >0$ rotates towards a parallel orientation with respect to the applied electric field, since
 $\dot \varTheta =\boldsymbol {U}\boldsymbol {\cdot } {\boldsymbol {\hat {t}}}\sim -\varPhi$. However, in the case of
 $\varPhi < 0$ (which occurs only for
 $R/S<1$ drops), the line of centres between the drops rotates towards a perpendicular orientation with respect to the applied electric field. Figure 4(a) summarizes the regimes of alignment and deformation.
(a) Phase diagram of drop deformations and alignment with the field for different viscosity ratios. The solid lines correspond to  $\varPhi ({\lambda }, R, S)=0$ given by (4.8). In the shaded regions, the line of centres of the two drops rotates away from the applied field direction
 $\varPhi <0$. The dashed line corresponds to the Taylor discriminating function (A3); in the parameter space above it, drop deformation is oblate. (b) Critical separation above which EHD dominates the interactions for
 ${\lambda }=1$ and
 $S=0.1$ (blue),
 $S=1$ (black) and
 $S=10$ (red).

The relative radial motion of the two drops at a given configuration depends on  $\varPhi$ and
 $\beta _T$, where
 $\beta _T \boldsymbol {\hat {z}}\boldsymbol {\hat {z}}$ is the strength of the far-field EHD stresslet flow
 \begin{equation} \boldsymbol{u}_s\left(\boldsymbol{x}\right)=\beta_T(-1+3 \cos^2 \theta)\frac{\boldsymbol{x}}{r^3}. \end{equation}
There is a critical separation  $d_c$ corresponding to
 $\boldsymbol {U}_2(d_c)\boldsymbol {\cdot }\boldsymbol {\hat {d}}=0$, which yields
 $d_c^2=2\varPhi /\beta _T$. For
 $\varPhi > 0$ and
 $R/S<1$ (
 $\beta _T<0)$,
 $d_c$ does not exist and EHD and DEP interactions are cooperative and act radially in the same direction (note that a system with
 $\varPhi <0$ and
 $R/S>1$ cannot exist). For
 $\varPhi > 0$ and
 $R/S>1$ or
 $\varPhi <0$ and
 $R/S<1$, there is competition between EHD and DEP, with the quadrupolar DEP winning out closer to the drops and the EHD taking over via the stresslet flow in the far field. The fact that depending on separation drops may attract or repel in the case of antagonistic EHD and DEP interactions has been discussed previously by Baygents et al. (Reference Baygents, Rivette and Stone1998) and Zabarankin (Reference Zabarankin2020). Note that for drops with
 $R/S<1$, EHD effectively dominates DEP at all separations since
 $d_c$ is smaller than 2, which is the minimum separation of spherical drops. Figure 4(b) illustrates the dependence of the critical separation
 $d_c$ for three typical cases. If
 $S=10$,
 $d_c$ is always less than 2, the minimum separation between two spheres, and accordingly the interactions are dominated by the EHD flow. For
 $S=1$,
 $d_c$ does not exist below
 $R=0.7$. In the case
 $S=0.1$,
 $\varPhi >0$ for all values of
 $R$ and thus
 $R/S<1$ is always dominated by EHD, while in the case
 $R/S>1$ the DEP attraction could be stronger than the EHD for quite large separations, e.g. for
 $R/S=1.1$ or
 $R/S\gg 1$
 $d_c > 10$. The DEP dominates in these cases because the EHD is very weak, in the first case because
 $(R-S)\sim 0$ and in the second case because the EHD flow decreases with conductivity ratio as
 ${\sim }1/R$.
5. Results and discussion
An isolated charge-neutral drop in a uniform DC electric field experiences no net force. However, a drop pair can move in response to mutual electrostatic (due to polarization) and hydrodynamic (due to the flow driven by surface electric stresses) interactions. While the theory in § 4 describes steady drop velocities (drop shape is assumed to be spherical and unaffected by drop motions), our simulations consider deformable drops whose shape can change during the interaction. We have extended the quasi-steady theory to account for the contribution of transient small deformations in the EHD drop velocity, see appendix A for details. Here, we explore the pair dynamics at different initial configurations using the simulations, the quasi-steady and the transient-deformation theories.
5.1. Initial drop interactions
The initial interaction of two drops at different misalignment with the applied field is illustrated in figures 5 and 6 by the dependence on  $\varTheta$ of the initial (
 $t=0$) relative velocity of the two drops. Figure 5 shows that the radial component of the velocity changes sign around
 $\varTheta \sim \varTheta _c$. The critical angle at which the total interaction changes sign at different separations between the drops is shown in figure 6(b). The deviation from the far-field result
 $\varTheta _c=54.7^{\circ }$ is due to the DEP interaction, since the dipole approximation becomes inaccurate at small separations. The value
 $R=1$ turns off the DEP interaction and in this case the angle is exactly given by
 $\varTheta _c=54.7^{\circ }$ at all separations. This is because the EHD solution (4.5) is exact for a sphere, which is the drop shape at
 $t=0$.
Radial component  $\boldsymbol {U}\boldsymbol {\cdot }\boldsymbol {\hat {d}}$ of the relative velocity of the two drops
 $\boldsymbol {U}$ at
 $t=0$ as a function of the angle made between the applied field and the line of centres of the two spheres
 $\boldsymbol {E}^\infty \boldsymbol {\cdot }\boldsymbol {\hat {d}}=\cos \varTheta$. Initial separation is
 $d=4$. (a) Case
 $R/S<1$:
 $R=0.1,\,S=1$ (black),
 $R=1, S=10$ (blue). At
 $\varTheta =0$, both electrostatic (DEP) and EHD interactions are attractive. At
 $\varTheta ={{\rm \pi} }/{2}$, both DEP and EHD are repulsive. (b) Case
 $R/S>1$:
 $R=1, S=0.1$ (red),
 $R=100,\,S=1$ (green). Solid line corresponds to the velocity computed from the theory accounting for transient drop deformation (A9), while the dashed line corresponds to the theory assuming spherical drops (4.7). Points are the numerical simulations.

(a) Tangential component  $\boldsymbol {U}\boldsymbol {\cdot }{\boldsymbol {\hat {t}}}$ of the relative velocity of the two drops
 $\boldsymbol {U}$ at
 $t=0$ as a function of the angle made between the applied field and the line of centres of the two drops
 $\boldsymbol {E}^\infty \boldsymbol {\cdot }\boldsymbol {\hat {d}}=\cos \varTheta$. Initial separation is
 $d=4$.
 $R=1$,
 $S=10$ (blue),
 $R=0.1$,
 $S=1$ (black),
 $R=1$,
 $S=0.1$ (red),
 $R=100$,
 $S=1$ (green). Solid line corresponds to the velocity computed from the theory accounting for transient drop deformation (A9), while the dashed line corresponds to the theory assuming spherical drops (4.7). Points are the numerical simulations. (b) Critical value of the angle
 $\varTheta$ for which the initial radial velocity between two spheres is zero, plotted as a function of the separation distance between the drops. This critical angle separates configurations for which drops attract (
 $\boldsymbol {U}\boldsymbol {\cdot }\boldsymbol {\hat {d}} <0$) and repel (
 $\boldsymbol {U}\boldsymbol {\cdot }\boldsymbol {\hat {d}}>0$). Points are the numerical simulations and the lines are added to guide the eye.

In the case  $R/S<1$, the centre-to-centre electrostatic (DEP) and EHD interactions work in the same direction. Figure 5(a) shows that when the drop pair is aligned with the field (
 $\varTheta =0$), the drops attract. As
 $\varTheta$ increases, the attraction decreases and changes to repulsion around
 $\varTheta \sim \varTheta _c$. The repulsion is strongest in the configuration with
 $\varTheta ={\rm \pi} /2$, i.e. line of drop centres perpendicular to the applied field. The initial velocity is higher than predicted by the theory assuming spherical drops, because at
 $t=0$, the drop shape begins to evolve and thus the fluid around the drop moves not only because of the tangential electric shearing of the interface, but also because the interface deforms. As a result, the strength of the EHD contribution to the relative velocity at early times is enhanced.
The case  $R/S>1$ is more complicated because the electrostatic and EHD interactions are antagonistic. The EHD interactions are predicted to change from repulsive to attractive as
 $\varTheta$ increases, while the DEP follows the opposite trend. Figure 5(b) shows that the interaction at
 $t=0$ for the considered separation
 $d=4$ is dominated by the EHD contribution. The theory assuming spherical drops predicts that DEP dominates the interaction of the drops with
 $R=100, S=1$, since for this system the critical separation
 $d_c=\sqrt {2\varPhi /\beta _T}\sim 23$ is much larger than the initial separation. However, at
 $t=0$ the flow associated with the elongating drops overcomes the DEP. The solution of the transient EHD problem, which accounts for the drop shape evolution (see appendix A), does highlight that the relative velocity can reverse sign before deformation reaches steady state on a typical time scale
 ${\sim }Ca$.
The tangential component of the relative velocity is  $\boldsymbol {U}\boldsymbol {\cdot }{\boldsymbol {\hat {t}}}=-4\varPhi \sin (2\varTheta )/d^4$. Accordingly, it is maximal at
 $\varTheta ={\rm \pi} /4$ as confirmed by figure 6(a). In all cases except
 $R=1, S=10$ the tangential velocity is negative, indicating that the drops' line of centres will move towards the applied field direction.
The question arises as to what happens after the initial attraction or repulsion? How do drop deformation, hydrodynamic and electrostatic interactions affect the drop trajectory? Here we show that their interplay gives rise to intricate trajectories.
5.2. Drop pair trajectories: evolution of separation and alignment with the field
Figures 7 and 8 illustrate the evolution of the centre-to-centre distance, the radial component of the relative velocity and the deformation parameter of drop 1 in the case of drops initially placed in the two extreme configurations, aligned and perpendicular to the field,  $\varTheta =0$ and
 $\varTheta ={\rm \pi} /2$, respectively. The simulations are compared to the quasi-steady theory, where the separation is computed from the radial velocity,
 $\dot {d}=\boldsymbol {U}\boldsymbol {\cdot } \boldsymbol {\hat {d}}$ with
 $\boldsymbol {U}$ given by (4.7). The tangential component of the relative velocity,
 $\boldsymbol {U}\boldsymbol {\cdot } {\boldsymbol {\hat {t}}}$, is zero during the interaction and accordingly the drop pair orientation with the field remains unchanged, i.e. the angle between the line of centres (and the field direction) remains in the initial configuration. In both cases,
 $R/S<1$ and
 $R/S>1$, the drops attract in the
 $\varTheta =0$ configuration, and repel if aligned perpendicularly with the applied field,
 $\varTheta ={\rm \pi} /2$. However, the interaction in the
 $R/S<1$ case is controlled by EHD, while in the
 $R/S>1$ case – by DEP, since the critical distance
 $d_c$ in the considered system
 $R=100$,
 $S=1$ is approximately 23, much larger than the initial separation. The radial velocity,
 $\boldsymbol {U}\boldsymbol {\cdot }\boldsymbol {\hat {d}}$, varies in time and in the case
 $R/S<1$ (figure 7) does not change sign (it remains either negative, indicating attraction, or positive, indicating repulsion). In the
 $\varTheta =0$ case, drops attract and the distance between the drops decreases; if
 $\varTheta ={\rm \pi} /2$, the drops repel and the separation increases. In the case
 $R/S>1$ (figure 8), the radial velocity reverses sign on a short time scale
 $\sim Ca$. If
 $\varTheta =0$, drops attract after a short transient repulsion and separation decreases in time. The opposite occurs in the
 $\varTheta ={\rm \pi} /2$ configuration. The theoretical trajectory computed from the steady state velocity and the simulations are in good agreement since drop shape remains close to a sphere and drop translation is slow compared to the deformation time scale.
The EHDs of a pair of deforming drops with  $R=0.1$ and
 $S=1$ with initial separation
 $d=4$ and inclinations
 $\varTheta =0$ (a–c) and
 $\varTheta ={\rm \pi} /2$ (d–f). Evolution of the centre-to-centre distance (a,d), the radial component of the relative velocity (b,e) and the deformation parameter (c,f). Black dots correspond to the numerical simulations. Red line corresponds to the radial velocity and separation predicted by (4.7) and the blue line is the deformation of an isolated drop calculated from (5.2).

The EHDs of a pair of deforming drops with  $R=100$ and
 $S=1$ with initial separation
 $d=4$ and inclinations
 $\varTheta =0$ (a–c) and
 $\varTheta ={\rm \pi} /2$ (d–f). Evolution of the centre-to-centre distance (a,d), the radial component of the relative velocity (b,e) and the deformation parameter (c,f). Black dots correspond to the numerical simulations. Red line corresponds to the radial velocity and separation predicted by (4.7) and the blue line is the deformation of an isolated drop calculated from (5.2).The insets show the sign reversal of the radial velocity.

The deformation parameter is defined as  $D_T=({a_{\|}-a_{\perp }})/({a_{\|}+a_{\perp }})$, where
 $a_{\|}$ and
 $a_{\perp }$ are the drop lengths in directions parallel and perpendicular to the applied field. For an isolated drop, in weak fields (
 $Ca\ll 1$) the equilibrium shape is given by
 \begin{equation} D_T= \frac{9Ca }{16 (2+R)^2}\left[R^2+1-2S+3(R -S)\frac{2+3{\lambda}}{5(1+{\lambda})}\right]. \end{equation}
Upon application of the field, the drop approaches the steady state monotonically (Esmaeeli & Sharifi Reference Esmaeeli and Sharifi2011)
 \begin{equation} D(t)=D_T (1-e^{-t/t_r})\quad\text{where}\ t_r=\frac{\eta_{{{s}}} a}{\gamma}\left(\frac{(3+2{\lambda})(16+19{\lambda})}{40(1+{\lambda})}\right). \end{equation}
Figures 7 and 8 show that upon application of the field the drops deform into an oblate or prolate ellipsoid depending on the Taylor discriminating function. The deformation parameter increases monotonically, similarly to the isolated drop case, and approaches a nearly steady value, which is close to that for an isolated drop given by (5.1). Due to the axial symmetry, the deformation parameters of both drops are identical. The difference between the two drop and the isolated drop results is greater in the  $\varTheta =0$ case because as the drops are moving closer their interaction is getting stronger; in the
 $\varTheta ={\rm \pi} /2$ configuration, the drops move away from each other and become more isolated. The strengthening interaction as separation decreases in the
 $\varTheta =0$ case leads to an unsteady increase in the deformation parameter because the drop shapes lose fore–aft symmetry and deform greatly before contact.
The effect of the initial misalignment of the drop pair and the applied field direction is illustrated in figure 9 with the three-dimensional trajectory of drops in the two canonical cases  $R/S<1$ and
 $R/S>1$. While in most cases drops display monotonic separation or attraction, figure 9 highlights some more intriguing dynamics: repulsion followed by attraction with centreline rotating towards the applied field direction (a,d), attraction followed by repulsion with centreline rotating towards the applied field direction (c) and attraction followed by repulsion with centreline rotating away from the applied field direction (b). The drops remain in the plane defined by the initial separation vector and the applied field direction, in this case the
 $xz$ plane. The transient pair dynamics is clearly seen in the trajectories in the
 $xz$ plane.The unsteady drop interactions are illustrated in more detail in figure 10. In the systems
 $R=0.1$ and
 $S=1$ (
 $\varPhi >0$),
 $R=1$ and
 $S=10$ (
 $\varPhi <0$),
 $R=1$ and
 $S=0.1$ (
 $\varPhi >0$), the EHD interactions are dominant; in particular, for a sphere,
 $R=1$ completely switches off the DEP interaction. In the
 $R=1$ and
 $S=10$ (
 $\varPhi <0$) case (figure 10c,d), the initial drop centreline angle is below
 $\varTheta _c$ and the EHD interaction is attractive. The drops initially attract along the direction of the electric field, but the rotation of the centreline away from the field axis increases the tilt angle above
 $\varTheta _c$ leading to repulsion and separation in direction perpendicular to the field. The angle between the separation vector and the applied field continuously increases and around
 $65^{\circ }$ the interaction changes from attractive to repulsive. At this point the drops attain minimum separation, and after that the drops move away from each other with a velocity that overshoots. At long times the drop pair approaches a nearly perpendicular orientation relative to the field direction, where the repulsive DEP and EHD interactions push the drops apart. This ‘kiss-and-run’ dynamics is similar to the those observed with ideally polarizable spheres (Saintillan Reference Saintillan2008) and has implications for electrocoalescence since the switching from attraction to repulsion prevents drops from reaching proximity sufficient to initiate merger. In all other cases, for which
 $\varPhi >0$, drops move to align with the field. Figures 10(a,b) and 10(e,f) illustrate the repulsion/attraction and attraction/repulsion dynamics. In both cases, the drop is released at an initial angle above the critical, but the
 $R=0.1$ and
 $S=1$ EHD stresslet flow is repulsive, while the
 $R=1$ and
 $S=0.1$ EHD flow is attractive. Since
 $\varPhi >0$, the drop centreline rotates towards the field direction bringing the drops into the range of angles where the EHD flow causes the drop interaction to reverse sign.
Trajectories of two identical drops with (a,e)  $R=0.1$,
 $S=1$, (b,f)
 $R=1$,
 $S=10$, (c,g)
 $R=1$,
 $S=0.1$ and (d,h)
 $R=100$,
 $S=1$. Initially, the separation in all cases is
 $d=4$ and the angle with the applied field direction is (a,e)
 $\varTheta =60^{\circ }$, (b,f)
 $\varTheta =45^{\circ }$, (c,g)
 $\varTheta =65^{\circ }$ and (d,h)
 $\varTheta =80^{\circ }$. (e,f,g,h) Trajectories in the
 $xz$ planes.

Dynamics of a pair of identical drops with initial separation  $d=4$ and different angles with the applied field; (a,b)
 $R=0.1$,
 $S=1$ (repulsion–attraction, alignment with the field), (c,d)
 $R=1$,
 $S=10$ (attraction–repulsion, misalignment with the field), (e,f)
 $R=1$,
 $S=0.1$ (attraction–repulsion, alignment perpendicular to the field) and (g,h)
 $R=100$,
 $S=1$ (repulsion–attraction, alignment with the field).

The DEP interactions become very important for large conductivity ratios  $R\gg 1$. As
 $R$ increases the EHD flow weakens (see (4.3)), while the DEP force plateaus as the dipole strength
 $(R-1)/(R+2)$ approaches 1 (see (4.2)). As a result, the cross-over separation beyond which the EHD flow becomes important increases. The
 $R=100$,
 $S=1$ case (figure 10g,h) illustrates the dynamics in this DEP dominated regime. Choosing an initial angle larger than
 $\varTheta _c$ causes the drops to repel, but
 $\varPhi >0$ means that
 $\varTheta$ will decrease with time below
 $\varTheta _c$ and the drops will then attract.
6. Conclusions and outlook
The three-dimensional interactions of a drop pair in an applied electric field are studied using numerical simulations and a small-deformation theory based on the leaky dielectric model. We present results for the case of a uniform electric field and arbitrary angle between the drops’ line of centres and the applied field direction, where the non-axisymmetric geometry necessitates three-dimensional simulations.
The pair dynamics depends on the interplay between the EHD and DEP interactions, which are cooperative in the case of  $R/S<1$, and antagonistic for
 $R/S>1$. DEP interaction favours drop pair alignment with the field and is attractive for small angles and repulsive otherwise. The critical angle where centre-to-centre motion changes sign can be estimated from the point-dipole approximation,
 $\varTheta _c=\arccos ({1}/{\sqrt {3}})\approx 54.7^{\circ }$. The EHD interaction depends on the sign of the induced free-charge dipole, which is dictated by the difference
 $\sim (R-S)$. If
 $R/S<1$, the pole to equator flow pulls the drops together when aligned parallel to the applied field direction and pushes them apart when the centre-to-centre line is perpendicular to the field; this scenario reverses for
 $R/S>1$. The critical angle which separates attraction from repulsion can be estimated from the stresslet approximation of the EHD flow and is the same as the DEP force. Hence, to leading order in separation and drop deformation, both the DEP and EHD change sign at
 $\varTheta _c$. Unlike DEP, the EHD interaction can cause the drops’ line of centres to rotate toward or away from the applied field direction. The theory highlights the importance of the function
 $\varPhi ({\lambda }, R, S)$, given by (4.8), which discriminates between the drop pair moving to align with the field or in a direction transverse to the field.
Our study finds that if the drop pair angle with the field initially is close to the critical angle for reversal of the interaction sign, the drops do not experience monotonic attraction or repulsion; instead their trajectories follow three scenarios: motion in the direction of the field accompanied by either attraction followed by separation or vice versa (repulsion followed by attraction), and attraction followed by separation in a direction transverse to the field. The dynamics of drops with  $R/S<1$ and
 $\varPhi <0$ is similar to ideally polarizable spheres (Saintillan Reference Saintillan2008) due to the similarities of the flow pattern (despite different flow origins): the drops attract and move in the direction of the field and then separate in the transverse direction. Hence, coalescence will be prevented in such cases. Drops with
 $R/S>1$ tend to align with the field but the sign of the interaction depends on drop separation. The DEP dominates when drops are close, while EHD controls the far-field interaction.
The comparison of the analytical theory and the simulations shows that the theory performs quite well in a wide range of drop separations and angles with the applied field direction for  $Ca<1$, and thus can serve as an efficient means to estimate drop pair dynamics and trajectories in an applied electric field. However, the simulations are indispensable in modelling the near-contact motions of the drops and the drop dynamics in stronger fields. Our three-dimensional boundary integral method is also capable of simulating the dynamics of dissimilar drops (different size, viscosities,
 $R$ and
 $S$), and many drops, which we plan to explore in the future. Charge convection can also be included in order to study symmetry-breaking three-dimensional instabilities such as the Quincke electrorotation (Salipante & Vlahovska Reference Salipante and Vlahovska2010, Reference Salipante and Vlahovska2013; Vlahovska Reference Vlahovska2016b).
Supplementary movies
Supplementary movies are available at https://doi.org/10.1017/jfm.2020.1007.
Acknowledgements
We thank the anonymous referees for critical reading and suggestions.
Funding
C.S. gratefully acknowledges support by Comsol Inc. P.V. has been supported in part by NSF award CBET-1704996. J.K., A.K. and L.W. have been supported by NSF award CBET-1804548.
Declaration of interests
The authors report no conflict of interest.
Appendix A. Evolution of the drops velocity upon application of an uniform electric field
Let us consider the transient drop dynamics after the electric field is applied in the limit of small deformations  $Ca\ll 1$. At leading order in
 $Ca$, the shape is described by
 $r_s=1+ f_2(t)(-1+3\cos ^2\theta )$, and the velocity field outside the drop at distance
 $r$ from the drop centre and an angle
 $\theta$ with the applied field direction is given by Vlahovska (Reference Vlahovska2011, Reference Vlahovska2016a)
 \begin{equation} \boldsymbol{u}=\left(\frac{\alpha+\beta}{ r^2}-\frac{\beta}{r^4}\right)(-1+3 \cos^2\theta)\boldsymbol{\hat{r}}-\frac{\beta}{r^4}\sin (2\theta){\boldsymbol{\hat{\theta}}}. \end{equation}
The coefficients  $\alpha$ and
 $\beta$ are time dependent because the drop deforms
 \begin{equation} \left. \begin{gathered} \alpha(t)=\frac{15({\lambda}+1)}{(3+2{\lambda})(16+19{\lambda})}\left(F_T\left(R,S, {\lambda}\right)-Ca^{-1}\frac{8}{3}f_{2}(t)\right),\\ \beta(t)=\frac{1}{(3+2{\lambda})(16+19{\lambda})}(B_T(R,S, {\lambda})-Ca^{-1}f_2(t)(12(2+3{\lambda}))), \end{gathered} \right\} \end{equation}
where  $F_T$ is the Taylor discriminating function
 \begin{equation} F_T\left(R,S, {\lambda}\right)=\frac{1}{\left(2+R\right)^2}\left(R^2+1-2S+3\left(R-S\right)\frac{2+3{\lambda}}{5({\lambda}+1)}\right), \end{equation}
and
 \begin{equation} B_T(R,S, {\lambda})=\frac{9 ({\lambda} (3 R^2+13 R-19 S+3)+2 (R^2+6 R-8 S+1))}{2 (R+2)^2}. \end{equation}
The shape evolution equation is obtained from the kinematic condition  $\dot {r}_s=u_r(r=1)$
 \begin{equation} \dot{f}_2=\frac{15({\lambda}+1)}{(3+2{\lambda})(16+19{\lambda})}\left(F_T\left(R,S, {\lambda}\right)-Ca^{-1}\frac{8}{3}f_{2}(t)\right). \end{equation}
Note that the Taylor deformation parameter is related to  $f_2$,
 $D=({3}/{2})f_2$, which leads to (5.2) describing the transient shape of an isolated drop.
If a second drop is present at location  $\boldsymbol {x}_2^c = d\boldsymbol {\hat {d}}$, its migration velocity due to the EHD flow of the first drop can be obtained using Faxen's law (Kim & Karrila Reference Kim and Karrila1991)
 \begin{equation} {\boldsymbol{U}}_2^{{{ehd}}} = \left(1 + \frac{{\lambda}}{2(3{\lambda}+2)}\nabla^2\right)\boldsymbol{u}({r=d}). \end{equation}
Inserting (A1) in the above equation yields
 \begin{equation} \left. \begin{gathered} U_{2,r}^{{{ehd}}}=\left(\frac{\alpha+\beta}{d^2}-\frac{1}{d^4}\left(\beta+\frac{3{\lambda}}{2+3{\lambda}}\left(\alpha+\beta\right)\right)\right)(-1+3 \cos^2\varTheta),\\ U_{2,t}^{{{ehd}}}=-\frac{1}{d^4}\left(\beta+\frac{3{\lambda}}{2+3{\lambda}}\left(\alpha+\beta\right)\right)\sin(2\varTheta), \end{gathered} \right\} \end{equation}
where  $\varTheta =\arccos (\boldsymbol {\hat {d}}\boldsymbol {\cdot }\boldsymbol {\hat {z}})$. At steady state
 $f_2=({3}/{8})Ca F_T$,
 $\alpha =0$ and
 $\beta$ reduces to Taylor's result
 \begin{equation} \beta_T=\frac{9(R-S)}{10\left(1+{\lambda}\right)\left(2+R\right)^2}, \end{equation}
which leads to the steady EHD contribution to the migration velocity calculated assuming a spherical drop (4.6). Recall that, for a perturbation solution in  $Ca$, the leading-order steady flow about the deformed drop is identical to the solution for a spherical drop (Rallison Reference Rallison1980).
The relative drop velocity is obtained by adding the contribution from the DEP force, (4.2), which is time-independent
 \begin{equation} \boldsymbol{U}(t)=2(\boldsymbol{U}_2^{{{ehd}}}(t)+\boldsymbol{U}_2^{{{dep}}}). \end{equation}
Figure 11 compares trajectories computed from a velocity that is transient (in the case of a deforming drop) and steady (in the case of a spherical drop). Decreasing  $Ca$ shortens the transient period and the trajectory approaches the steady result. However, a long transient results in an offset.
Comparison between the transient and steady migration theories with the numerical simulations. Centroid distance (a) and relative radial velocity (b) as a function of time for a pair of identical drops with  $R=1$,
 $S=10$, aligned with the field (
 $\varTheta =0$) and initial separation
 $d=4$,
 $Ca=0.1$. The red line corresponds to the trajectory computed using the steady state velocity (4.7). The transient solution using (A9) with
 $Ca=0.05$ is given in black and
 $Ca=0.1$ in blue.



