I. INTRODUCTION
Surface degradation of materials by erosion and corrosion has serious economic implications. In particular, fluid machinery such as turbines, pumps, valves, and propellers are subject to extensive surface damage due to the repetitive impact of liquid jets over long periods of time. These impacts result in material loss in the form of cavitation or liquid impingement erosion. In addition, shock waves produced from the dynamic interaction during cavitation also contribute toward surface damage.Reference Franc and Michel1 Significant research efforts have been directed toward finding sustainable solutions to address the deleterious effects of surface degradation. Majority of these studies have focused on the utilization of appropriate coatings. However, coatings have serious limitations including porosity, low adhesion, and nonhomogenous microstructure.Reference Lathabai, Ottmüller and Fernandez2,Reference Wood, Mellor and Binfield3 Therefore, discovery and development of new materials that are resistant to cavitation erosion damage can have a sizable economic impact.
Bulk metallic glasses (BMGs) have received considerable attention in structural applications due to their high strength, high elastic strain limit, and thermoplastic forming ability.Reference Johnson4–Reference Greer7 Despite these desirable properties, only limited work has been done in evaluating erosion behavior of metallic glasses. The erosion–corrosion behavior of Zr55Cu30Ni10Al5 metallic glass has been studied in saline-sand slurry using a pot-type erosion tester.Reference Ji, Zhao, Zhang and Zhou8 The metallic glass showed higher resistance to erosion–corrosion compared with 304 stainless steel. Cavitation erosion performance of several Zr-based BMGs was evaluated in a previous study using an ultrasonic vibration device.Reference Drozdz, Wunderlich and Fecht9 The influence of chemical composition and mechanical behavior of the different alloys on erosion performance was investigated.Reference Drozdz, Wunderlich and Fecht9 However, there is limited understanding of the factors affecting cavitation resistance of amorphous metals.
In this paper, we report on the cavitation erosion behavior of a Zr-based BMG, Zr44Ti11Cu10Ni10Be25. A large number of Zr-based BMGs have been developed over the years for structural applications. The alloy used in the current study is the best glass former (with a supercooled liquid region of ∼120 °C) developed so far in the Zr-based system, making it useful for a wide range of applications due to its thermal stability.Reference Johnson4,Reference Schroers10 Thus, superior mechanical properties and good glass forming ability makes this alloy system suitable for the current study. Cavitation testing was done using a liquid droplet impingement system, where progressive loss of material results from the impact of collapsing bubbles. For comparison, erosion behavior of commonly used hydroturbine steel, CA6NM (13Cr4Ni), was also evaluated under the same test conditions. Through detailed microstructure evaluation, we demonstrate that lack of grain boundaries in the metallic glass results in high resistance to damage initiation. Furthermore, we explain the longer incubation period and low erosion rate for the BMG by its higher hardness and localized plasticity.
II. EXPERIMENTAL PROCEDURE
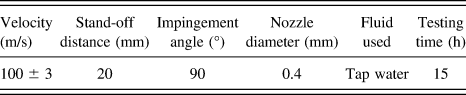
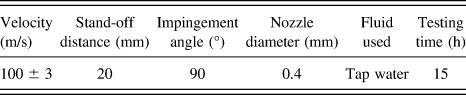
For liquid impingement testing, a high-pressure plunger pump driven by 3-kW electric motor was utilized for pumping the water through 0.4-mm diameter diverging nozzle. A spray type nozzle made of SS316 stainless steel was used, capable of transforming the jet of water into small droplets. Various testing parameters used for the experimentation are given in Table I. Testing was conducted for a total time of 15 h. The exposed samples were washed with acetone prior to the weight measurement. Weight change measurements were made with an accuracy of 0.01 mg. Microstructural studies of the eroded specimens were done using a scanning electron microscope (SEM) (JEOL 6610 LV, Akishima-shi, Tokyo, Japan) equipped with energy dispersive spectroscopy. Hardness and modulus values of both the materials were determined by nanoindentation (Make: MTS) using a Berkovich tip.
Testing parameters used for the liquid impingement erosion test in the current investigation.
III. RESULTS
Volume loss for both the materials during cavitation testing is shown in Fig. 1(a). Each material shows an incubation period during which there is almost negligible material loss. The incubation period for CA6NM is nearly 5 h, whereas for the BMG, it is 9 h. Thus, BMG demonstrated nearly two times improvement in the time for damage initiation compared with CA6NM. After the incubation period, there is steep rise in volume loss for both the materials. Fitting of the data using a model based on pit multiplication/annihilationReference Hattori and Maeda11 is shown in Fig. 1(a). This model help in estimating the volume loss–time erosion curve for the materials. The erosion rate for both materials is indicated in Fig. 1(b). The BMG demonstrated more than four times higher resistance to cavitation erosion compared with CA6NM at steady state.
(a) Volume loss obtained experimentally as well as the fitted model for cavitation erosion; (b) erosion rate for hydroturbine steel (CA6NM) and Zr-based BMG (Zr44Ti11Cu10Ni10Be25). Both the materials showed the incubation period during which there was almost negligible mass loss. The Zr-based metallic glass showed nearly two times higher incubation period compared with CA6NM. After the incubation period, there is an abrupt rise in volume loss for both the materials. Inset at t 1 shows the SEM image for a flank that remains attached to the specimen during the incubation period. Inset at t 2 shows the SEM image for a deep crater at the end of erosion test. The Zr-based metallic glass demonstrated four times higher resistance against cavitation erosion compared with CA6NM.

A SEM image for the surface of BMG after 4 h of cavitation test (incubation stage) is shown in the inset “t 1” of Fig. 1(b). The impact of high-pressure droplets results in formation of flanks and craters as seen in the figure. However, the flank remains attached to the specimen surface that explains the negligible material loss during incubation. In contrast, the SEM image after 15 h of cavitation (acceleration stage) shows deep craters and extensive surface damage [inset “t 2” of Fig. 1(b)].
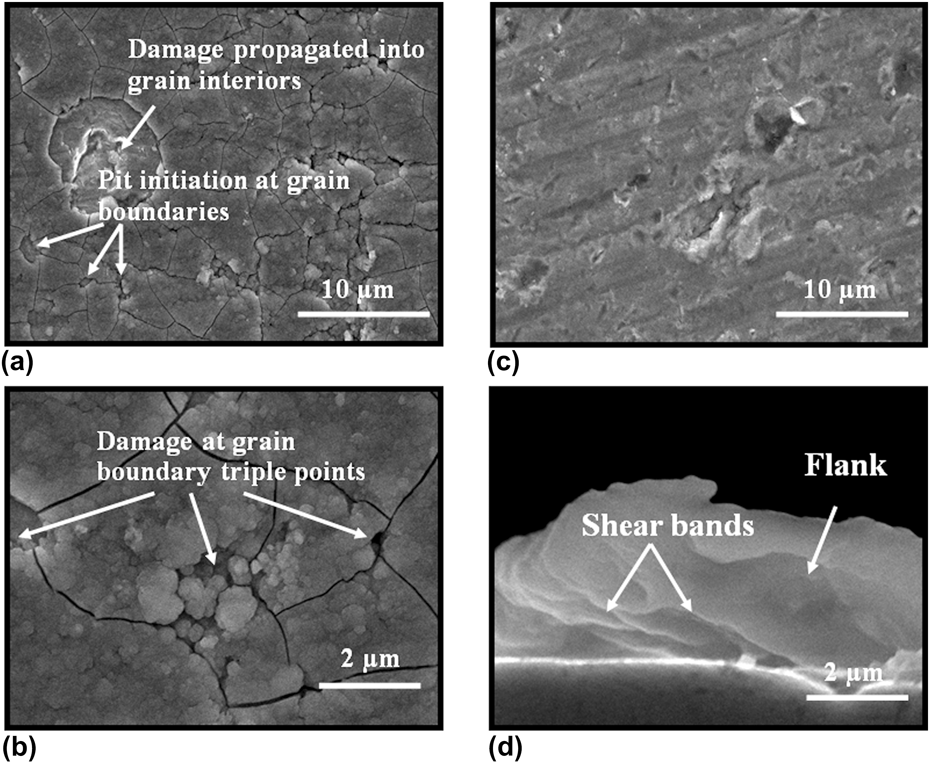
The SEM images for BMG and CA6NM, shown in Figs. 2(a)–2(d), depict the surface damage at the end of cavitation test. CA6NM was subjected to extensive damage in the form of deep craters and pits [Figs. 2(a) and 2(b)]. Further, it can be seen that the damage initiation for CA6NM occurred at the grain boundaries and triple junctions, which propagated to the grain interior with successive impacts. In comparison, BMG specimen shows significantly less surface damage [Fig. 2(c)]. The material loss for BMG occurred mainly in the form of fine pits. Cross-sectional image of the BMG specimen at the end of cavitation test is shown in Fig. 2(d). Deformation marks in the form of shear bands can be seen on the surface of the flank. These shear bands form due to localized plastic deformation of the metallic glass during droplet implosion. Formation of shear bands in metallic glasses during deformation has been extensively investigated.Reference Conner, Johnson, Paton and Nix12–Reference Nieh, Schuh, Wadsworth and Li15
(a) Low magnification SEM image for CA6NM showing damage initiation and propagation, (b) high magnification SEM image for CA6NM, (c) low magnification SEM image for Zr-based BMG, and (d) high magnification SEM cross-section image showing a flank of Zr-based BMG after 15 h of erosion test. The surface of CA6NM showed extensive damage in the form of pits and craters, whereas Zr-based BMG showed considerably lesser surface damage. The material loss for metallic glass mainly occurred in the form of fine pits. Grain boundaries and triple point act as damage initiation sites for CA6NM.
X-ray diffraction (XRD) analysis of both materials before and after erosion is shown in Figs. 3(a) and 3(b). CA6NM showed some strain-induced transformation, evident from slight shift in XRD peaks [inset of Fig. 3(a)]. However, there is no indication of deformation-induced crystallization in case of the BMG [Fig. 3(b)]. Hardness and modulus values for both materials were obtained from nanoindentation and are given in Table II. The BMG has higher hardness and lower modulus compared with CA6NM. Further, the load–displacement curve [Fig. 3(c)] for metallic glass showed serrations that characterize localized (inhomogeneous) plastic deformation process in the form of shear band nucleation and propagation.Reference Conner, Johnson, Paton and Nix12–Reference Nieh, Schuh, Wadsworth and Li15 Inset of Fig. 3(c) shows serrations in the load–displacement curve on a larger scale.
XRD analysis of (a) CA6NM, (b) Zr-based metallic glass before and after liquid impingement erosion, and (c) load–displacement curve for the metallic glass obtained using nanoindentation. The enlarged view of a section of the loading curve is shown in the inset of (c). CA6NM showed some erosion induced transformation evident in the form of peak shift (insets at θ1 and θ2). The metallic glass did not show any evidence of deformation induced crystallization or shift in peak positions. The load–displacement curve shows serrations in the form of pop-in events. These events characterize a localized (inhomogeneous) plastic deformation process in the form of shear band nucleation and propagation.
Hardness and modulus values of the Zr-based BMG and hydroturbine steel (CA6NM). Values of the parameters obtained for the fitted model is also shown for both the materials.

α is the pit multiplication factor and β is the annihilation factor.
IV. DISCUSSION
During cavitation test, liquid droplets implode on the specimen surface with a very short time interval between successive impacts. Repetitive implosion causes fatigue loading of the material during which it is subjected to high-pressure shock waves. Contact stresses produced on the surface of a specimen during bubble implosion is typically on the order of several 100 MPa,Reference Franc and Michel1 sufficient to plastically deform the material. When a polycrystalline material is plastically deformed, one grain tends to deform differently from a neighboring grain owing to different crystallographic orientations. Grains with favorable crystal orientation (lower critical resolved shear stress) deform more compared with others. Differential deformation leads to strain incompatibility between the neighboring grains. The strain incompatibility is likely to be even higher for grain boundary triple junctions, which can initiate cracks. Damage initiation at the grain boundaries for CA6NM is shown in Figs. 2(a) and 2(b). During successive impacts of droplets, damage propagates toward the grain interiors resulting in larger material loss [Fig. 2(a)]. In contrast, metallic glasses have a uniform amorphous structure with no grains and grain boundaries. Absence of grain boundaries results in stochastic damage initiation and greater erosion resistance for the metallic glass. Molecular dynamic simulation of cavitation supports this stochastic behavior in the case of metallic glasses.Reference An, Garrett, Samwer, Liu, Zybin, Luo, Demetriou, Johnson and Goddard16 Both materials were polished the same way prior to the start of cavitation test. Thus, the observed surface damage is attributed solely to cavitation erosion.
The Zr-based BMG has more than twice the hardness of CA6NM (Table II). Higher hardness provides more resistance against damage initiation and delays the onset of material deformation. This explains the longer incubation period for BMG compared with CA6NM during cavitation. Cavitation erosion of hard materials typically results in surface cracking due to their inability in deforming plastically.Reference Tomlinson and Matthews17,Reference Lu, Zumgahr and Schneider18 However, this was not seen for the investigated BMG. The ability of a metallic glass to accommodate localized deformation in the form of shear bands likely prevented surface cracking during cavitation [Fig. 2(d)]. The volume loss during the incubation period is considerably smaller for BMG compared with CA6NM [Fig. 1(a)]. In addition, lower density of damage initiation sites in the BMG resulted in smaller volume loss during the acceleration period compared with CA6NM.
To predict the extent of erosion damage, a mechanistic understanding of the underlying phenomena is necessary. Various approaches have been utilized to model the correlation between mechanical properties and erosion resistance of a material. However, due to the complexity of interacting parameters, the developed models have been largely inadequate. Since cavitation proceeds through fatigue damage, a logistic curve model has been previously proposed for the estimation of erosion damage.Reference Hattori and Maeda11 In this model, the variation in volume loss per unit time was expressed in terms of pit multiplication and pit annihilation, du/dt = αu − βu 2/A, where u is the volume loss rate (mm3/h), α is the pit multiplication factor, β is the pit annihilation factor, and A is the surface area. Integration of the above equation can be used to determine the volume loss over a period of time. The mean depth of erosion (d) can be expressed as,Reference Hattori and Maeda11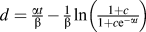 $d = {\textstyle{{{\rm{\alpha }}t} \over {\rm{\beta }}}} - {\textstyle{1 \over {\rm{\beta }}}}\ln \left( {{\textstyle{{1 + c} \over {1 + c{\rm{e}}^{ - {\rm{\alpha }}t} }}}} \right)$, where c is a constant whose value depends on the initial volume loss rate. The ratio α/β represents the slope of volume loss rate curve. Using an incubation period (t i), α/β was calculated using α/β = 33.5 t iReference Hattori and Maeda11 for both the materials. Similarly, parameters c and β were calculated using
 $c = {2^{B/{t_{\rm{i}}}{d_{\rm{i}}}}}$ and β = t iln(1 + c)/33.5, respectively,Reference Hattori and Maeda11 where d i is the mean erosion depth during the incubation period. It was determined using d i = V i/A i, where V i is the volume loss during incubation and A i is the area subjected to cavitation. Thus, the mean depth of erosion as a function of time can be expressed as follow:
 $${d_{{\rm{BMG}}}} = 0.41t - \,\,[\ln (1 + 240.5)/\,\,(1 + 240.5{{\rm{e}}^{ - 0.60t}})]/1.47\quad ,$$
 $${d_{{\rm{CA6NM}}}} = 1.34t - \,\,[\ln (1 + 68.11)/\,\,(1 + 68.11{{\rm{e}}^{ - 0.85t}})]/0.63\quad .$$
Using the above equations, the mean depth of erosion was modeled for both materials and is shown in Fig. 1(a). The model predicts an exponential rise in the erosion rate after an incubation period for both the materials. The model also captures lower volume loss for metallic glass as compared with CA6NM. The model parameters for both the materials are given in Table II. The pit multiplication factor is smaller for the metallic glass compared with CA6NM, which is related to its uniform amorphous structure and higher hardness. Furthermore, the smaller rate of volume loss after incubation is attributed to the reduced number of damage initiation sites on the metallic glass surface.
V. CONCLUSION
Cavitation erosion behavior of a metallic glass was evaluated and compared with commonly used hydroturbine steel. Metallic glass demonstrated significantly higher erosion resistance. Higher resistance against cavitation erosion for metallic glass is attributed to its uniform amorphous structure and higher hardness. In contrast, grain boundaries served as damage initiation sites for hydroturbine steel, CA6NM, resulting in its higher erosion rate.