Introduction
Breast cancer is one of the most common cancers worldwide. Statistics from 185 countries in 2018 reported there were ~2.1 million newly diagnosed female breast cancer cases, accounting for almost 1 in 4 cancer cases among women. The disease is also the leading cause of cancer death in over 100 countries (Bray et al., Reference Bray, Ferlay, Soerjomataram, Siegel, Torre and Jemal2018). It is generally diagnosed and evaluated with mammography, in which calcification is a significant diagnostic feature (Obenauer et al., Reference Obenauer, Hermann and Grabbe2005). Clinically, calcifications are classified according to the categories described in the Breast Imaging Reporting and Data System lexicon by the American College of Radiology (Gülsün et al., Reference Gülsün, Demirkazık and Arıyürek2003). Benign calcifications (generally recognised by their size, shape and distribution) are usually pathognomonic signs that allow malignancy to be excluded with high probability (Liberman et al., Reference Liberman, Abramson, Squires, Glassman, Morris and Dershaw1998; Kaltenbach et al., Reference Kaltenbach, Brandenbusch, Möbus, Mall, Falk, van den Bergh, Chevalier and Müller-Schimpfle2017). In the absence of recognisably benign calcifications, follow-up biopsies and pathological examination are required to examine the cellular morphology and detect smaller micro-calcifications (Obenauer et al., Reference Obenauer, Hermann and Grabbe2005; Kaltenbach et al., Reference Kaltenbach, Brandenbusch, Möbus, Mall, Falk, van den Bergh, Chevalier and Müller-Schimpfle2017).
The introduction of the methods of mineralogy or materials science to the study of breast cancer calcifications has contributed substantially to their identification (Kaltenbach et al., Reference Kaltenbach, Brandenbusch, Möbus, Mall, Falk, van den Bergh, Chevalier and Müller-Schimpfle2017; Kunitake et al., Reference Kunitake, Choi, Nguyen, Lee, He, Sudilovsky, Morris, Jochelson, Hudis and Muller2018). Researchers in histopathology have found that breast cancer calcifications mainly consist of hydroxylapatite with the general formula Ca5(PO4)3(OH) (Morgan et al., Reference Morgan, Cooke, Christopherson, Westfall and McCarthy2001; Gosling et al., Reference Gosling, Scott, Greenwood, Bouzy, Nallala, Lyburn, Stone and Rogers2019), except for some exceptional examples where calcium oxalate or weddellite (Ca(C2O4)⋅(2.5–x)H2O; Mills and Christy, Reference Mills and Christy2016) have been found in carcinoma in situ (Frappart et al., Reference Frappart, Remy, Lin, Bremond, Raudrant, Grousson and Vauzelle1987; Haka et al., Reference Haka, Shafer-Peltier, Fitzmaurice, Crowe, Dasari and Feld2002), a type of non-invasive or precancerous growth. Recent studies have described and linked the carbonate content of breast cancer calcifications in pathological breast disease to the invasive cancer grades (grades 1, 2 and 3) and stages of ductal carcinoma in situ (low, intermediate and high grade) (Baker et al., Reference Baker, Rogers, Shepherd and Stone2010; Sathyavathi et al., Reference Sathyavathi, Saha, Soares, Spegazzini, McGee, Dasari, Fitzmaurice and Barman2015), heightening interest in the detailed mineralogical characteristics of calcifications in breast cancer.
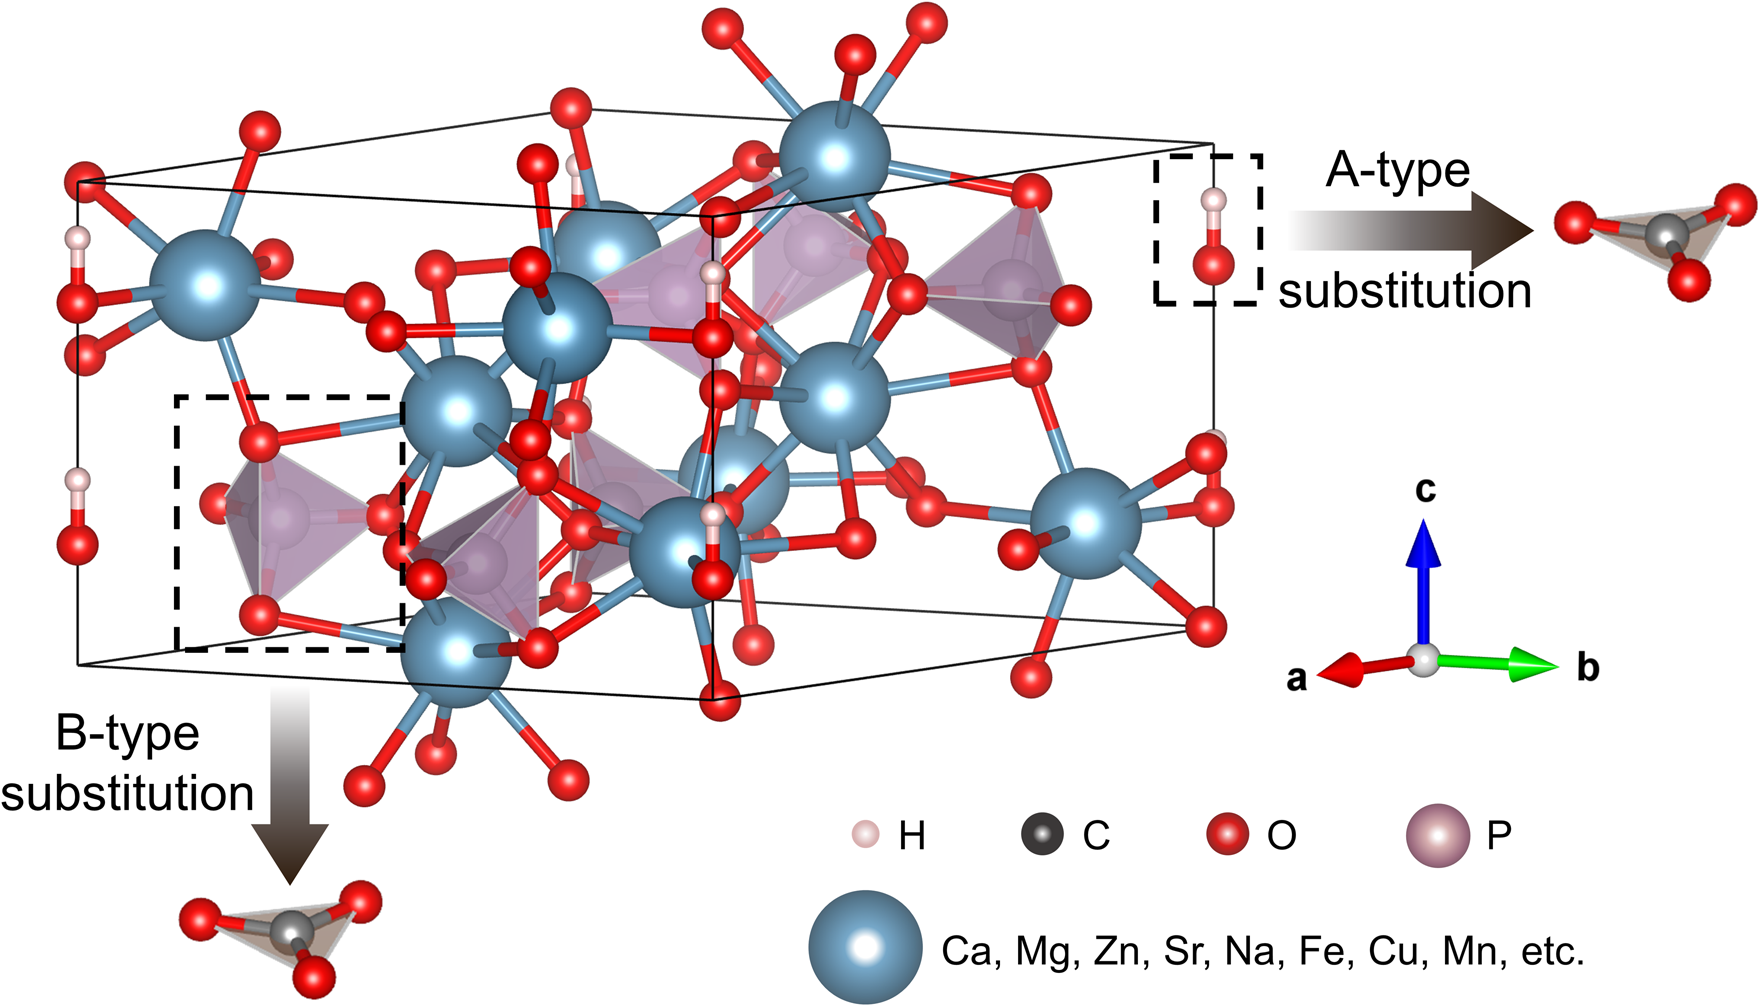
Hydroxylapatite is a typical product of biomineralisation (Weiner and Dove, Reference Weiner, Dove, Dove, Weiner and De Yoreo2003; Achal et al., Reference Achal, Mukherjee, Kumari and Zhang2015). It belongs to the apatite supergroup with a hexagonal structure, and its chemical formula is usually written as Ca10(PO4)6(OH)2 (Pasero et al., Reference Pasero, Kampf, Ferraris, Pekov, Rakovan and White2010). In practice, however, the Ca:P ratio is seldom equal to the ideal 1.67, and Ca:P ratios in the range from 1.33 to 1.95 have been reported after accounting for instrument and resolution error (McConnell, Reference McConnell1960; Baikie et al., Reference Baikie, Ng, Madhavi, Pramana, Blake, Elcombe and White2009). This wide variation is caused by structural defects, such as calcium vacancies (Ivanova et al., Reference Ivanova, Frank-Kamenetskaya, Kol'tsov and Ugolkov2001) or isomorphic substitutions at Ca sites (Get'man et al., Reference Get'man, Loboda, Tkachenko, Yablochkova and Chebyshev2010), tetrahedral sites (Pan and Fleet, Reference Pan, Fleet, Kohn, Rakovan and Hughes2002), or in the hexagonal channel (Ito et al., Reference Ito, Maekawa, Tsutsumi, Ikazaki and Tateishi1997) of hydroxylapatite. Accordingly, some differences in the crystal-lattice parameters, micromorphology, microstructure and biological effects have been documented in hydroxylapatite with different defects or defect densities (Legeros et al., Reference Legeros, Trautz, Legeros, Klein and Shirra1967; Barralet et al., Reference Barralet, Best and Bonfield1998; Webster et al., Reference Webster, Ergun, Doremus and Bizios2002; Obadia et al., Reference Obadia, Amador, Daculsi and Bouler2003; Li et al., Reference Li, Lam, Yang, Xu, Ni, Abbah, Cheung, Luk and Lu2007). Notably, the effects of anion substitution on the structure and physicochemical properties of hydroxylapatite are also significant, particularly the substitution of carbonate ions (CO32–). Two substitution sites for CO32– in apatite classify the apatite into A, B, and A–B type substitutions with OH–, PO43– and both substituted (LeGeros et al., Reference LeGeros, Trautz, Klein and LeGeros1969; Vignoles et al., Reference Vignoles, Bonel, Holcomb and Young1988; Fleet and Liu, Reference Fleet and Liu2003), respectively (see Fig. 1). Further details on ion substitution in hydroxylapatite in breast cancer calcifications are needed to elucidate the links between the occurrence and development of the calcifications, to improve the diagnosis of breast cancer, and even to enable the treatment of breast cancer using targeted medicine or approaches to decomposing hydroxylapatite-related calcifications or inhibiting their growth (Morgan et al., Reference Morgan, Cooke, Christopherson, Westfall and McCarthy2001; Cook et al., Reference Cooke, McCarthy, Sallis and Morgan2003; Peroos et al., Reference Peroos, Du and de Leeuw2006; Awonusi et al., Reference Awonusi, Morris and Tecklenburg2007; Fleet, Reference Fleet2009; Fleet et al., Reference Fleet, Liu and Liu2011; Madupalli et al., Reference Madupalli, Pavan and Tecklenburg2017).
The crystal structure diagram of hydroxylapatite with cation substitution and carbonate group substitution as A or B type.
Various techniques have been used to study the mineralogical characteristics of hydroxylapatite and its substitutions. Hydroxylapatite with Ca:P ratios as low as 1.51 and as high as 1.71 may produce almost indistinguishable patterns in powder X-ray diffraction (XRD) (Raynaud et al., Reference Raynaud, Champion, Bernache-Assollant and Thomas2002). Although the structure of hydroxylapatite with isomorphic substitutions showed certain distinctions after refinement by the Rietveld method (LeGeros et al., Reference LeGeros, Miravite, Quirolgico and Curzon1976; El Feki et al., Reference El Feki, Savariault and Salah1999; El Feki et al., Reference El Feki, Savariault, Salah and Jemal2000; White and Dong, Reference White and Dong2003; Get'man et al., Reference Get'man, Loboda, Tkachenko, Yablochkova and Chebyshev2010; Lala et al., Reference Lala, Ghosh, Das, Das, Kar and Pradhan2016; Cheng et al., Reference Cheng, Zhang, Yin, Ruan, Sun and Lin2019; Baldassarre et al., Reference Baldassarre, Altomare, Corriero, Mesto, Lacalamita, Bruno, Sacchetti, Dida, Karaj and Ventura2020), identification of the exact substituting ions (groups) in apatite samples remain difficult using XRD analyses alone. Fourier-transform infrared spectroscopy (FTIR), Raman spectroscopy, and thermogravimetric analyses (TGA) coupled with differential thermal analysis (DTA) are often employed to study CO32– in hydroxylapatite (Raynaud et al., Reference Raynaud, Champion, Bernache-Assollant and Thomas2002). Cations can be detected directly by energy-dispersive X-ray analysis (EDAX), electron-probe microanalyses (EPMA), laser-ablation inductively coupled plasma mass spectrometry (LA-ICP-MS) and X-ray fluorescence (XRF) (Belousova et al., Reference Belousova, Griffin, O'Reilly and Fisher2002; Shen et al., Reference Shen, Liu, Lin and Zhang2012). However, bulk methods such as traditional XRD, TGA-DTA, ICP-MS, FTIR pellet methods, and traditional XRF are not appropriate for doing analyses of breast cancer calcifications due to their micro- or nano-particle size and extremely limited quantities. Furthermore, the spot sizes used in EPMA and LA-ICP-MS are not small enough. Analyses of calcifications using conventional X-ray absorption spectroscopy are also difficult due to small sample sizes and their uneven compositions. As a result of these limitations on sample size, quantity, and uniformity, mineralogical studies on breast cancer calcifications have not yet been extensively and thoroughly conducted. In this study, we established a comprehensive range of micro-regional research methods to characterise these calcifications, focusing mainly on isomorphic substitutions to hydroxylapatite in the calcifications, and comparing the characteristics of breast cancer calcifications with samples of synthetic and natural hydroxylapatite.
Materials and methods
An optical microscope was used to select 30 cases of breast carcinoma with calcification by observing thin sections stained with hematoxylin and eosin (H&E). The paraffin-embedded samples were obtained from the Department of Pathology, Peking University Health Science Center (PUHSC). The samples were collected with the permission of the patients, and the study as a whole was approved by PUHSC. Pathological diagnosis was performed using at least two experienced pathologists at PUHSC.
Preparation of section samples
Thin sections of 4 or 10 μm in thickness and ~15 mm ×15 mm in area were obtained using a Leica ultramicrotome. Ordinary 4 μm H&E sections were prepared for observation under optical microscopy, and 10 μm sections were loaded on clean 20 mm × 20 mm silicon wafers for environmental scanning-electron microscopy and EDAX (with exposure times of 10 or 30 s). The samples were soaked in xylene to remove the paraffin, and absolute ethanol was used to remove the xylene. Details of the procedures can be found in Wang et al. (Reference Wang, Yang, Li, Xiong, Zhao, Liu, Zhang and Lu2011).
Separation of powder samples
To avoid interference by organics, dozens of slices were processed to separate the calcifications from the surrounding tissues. Minerals were separated from organic tissues following the method described in Wang et al. (Reference Wang, Yang, Li, Xiong, Zhao, Liu, Zhang and Lu2011). Briefly, slices of the serial sections were put into a 1.5 mL centrifuge tube and soaked with xylene for 24 h, 12 h and then 5 h. Ethanol in graded concentrations of 100%, 95%, 90%, 85%, 70%, 50% and 30% was separately and sequentially added to remove the xylene for 10 min in each grade. Subsequently, the samples were washed with distilled water three times and twice digested in 5% sodium hypochlorite solution in a 37°C water bath for 30 min. Finally, the remaining powders were washed with distilled water four times and dehydrated in graded ethanol of 50%, 65%, 75%, 85%, 95%, 100%, and 100% for 15 min, 25 min, 35 min, 15 min, 25 min, 30 min and 40 min, respectively. The powder samples were stored in ethanol under room temperature.
Methods for mineralogical characterisation
Transmission electron microscopy (TEM) was performed using a TECNAIF 30 with an operating voltage of 300 kV and a JEM-2100F with an operating voltage of 200 kV. The samples were prepared for analyses by dripping ~0.1 mL suspension with powder samples and absolute ethanol onto carbon-coated copper grids. The data were processed and analysed with Digital Micrograph version 3.6.5 (Gantan Ltd.). Micro Fourier-transform infrared spectroscopy (FTIR) was conducted using a NICOLET iN10 MX Micro-FTIR spectrometer. The spectra were collected in transmission mode with a resolution of 4 cm–1 over the 600–4000 cm–1 spectral range.
The Raman measurements were carried out using a Renishaw InVia system attached to a Leica microscope (50× objective) with a two-dimensional CCD camera. A 532 nm laser-excitation wavelength and high-resolution gratings (2400 gr/mm) were employed. Raman scattering maps were collected using the Renishaw StreamLine accessory with a step size of 1.3 μm. The exposure time for each spot was 10 s. The data processing was conducted with WiRE 4.1 (Renishaw).
Synchrotron radiation XRD (SR-XRD) and XRF (SR-XRF) were performed at the BL15U beamline of the Shanghai Synchrotron Radiation Facility (SSRF) in Shanghai, China. Powder samples were mounted between two pieces of 3M film after ethanol volatilisation and then attached to the sample holder. Angle-dispersive SR-XRD experiments were performed using a wavelength of 0.6884 Å, a focused beam size of ~5 μm ×10 μm, and a Mar CCD detector. CeO2 was used to calibrate the wavelength of the X-rays and to determine the distance from the sample to the detector, as well as other parameters. The collection time for each SR-XRD pattern was 20–100 s. All collected images were integrated with Fit2D V12.077 (Hammersley A.P., Reference Hammersley1997) to obtain conventional one-dimensional diffraction spectra. XRD data processing and phase identification were achieved by Highscore Plus software (version 4.6.1) (Malvern Panalytical, the Netherlands). SR-XRF was conducted under fluorescence mode with a 50 mm2 silicon-drift detector (Vortex, USA) with air in the ion chamber. The energy for the SR-XRF test was 18 keV, and the focused beam size was 4 μm × 4.5 μm. The collection time for each SR-XRF pattern was 100 s, and all collected data were analysed with the software PyMca (Version 4.4.0, Solé et al., Reference Solé, Papillon, Cotte, Walter and Susini2007). Samples for SR-XRF mapping were transferred from the aforementioned silicon wafers to Kapton films, and the collection time for each point in the element mapping was 8 s. The detection limit of SR-XRF in the BL15U beamline can reach the level of μg/g with an energy resolution of 0.2 eV.
Results
Mineral phase and crystal structure
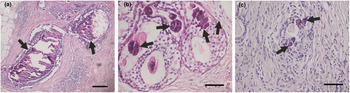
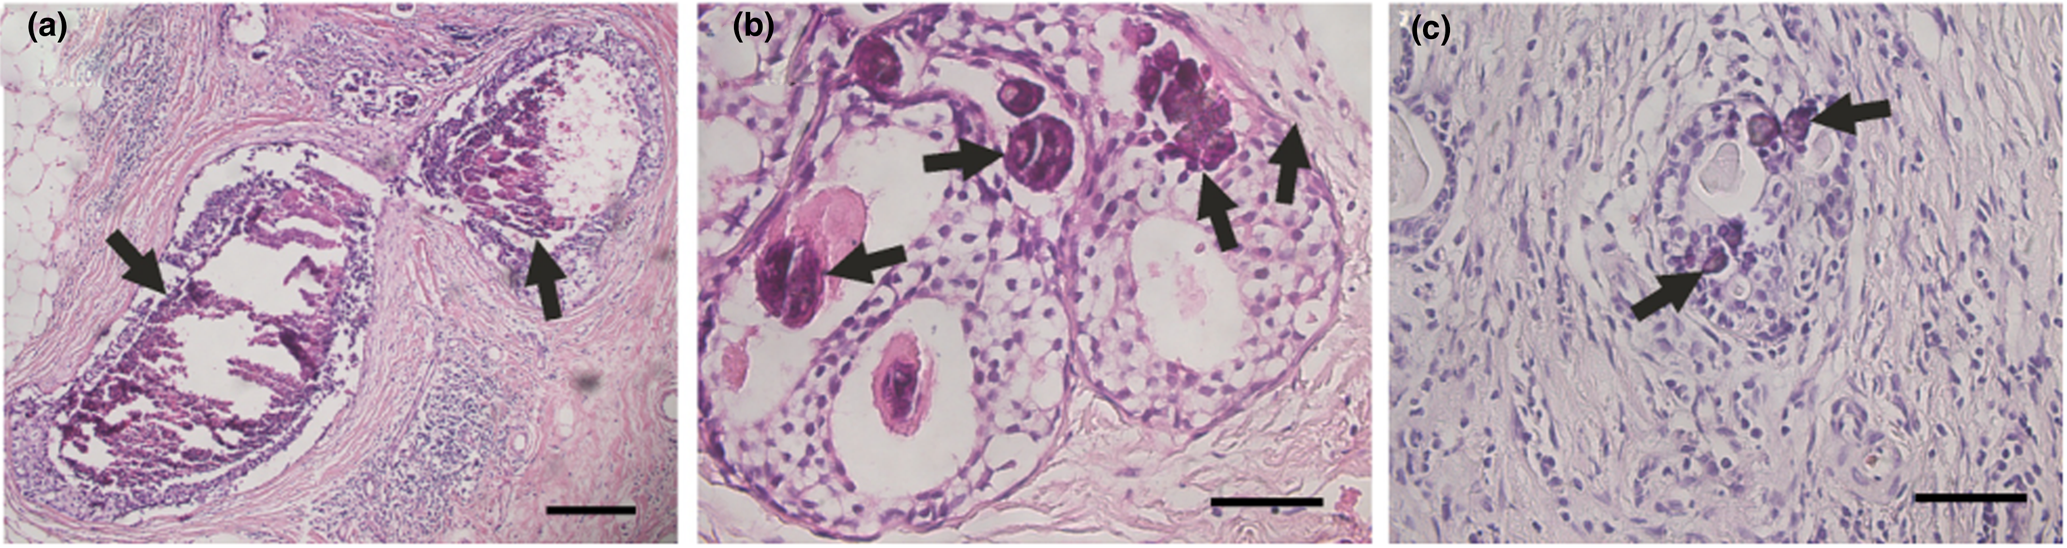
Breast cancer calcifications appeared dark purple in H&E-stained sections under optical microscopy (Fig. 2). Their profiles were either irregular (Fig. 2a) or spherical (Fig. 2b, c). The irregular calcifications were always greater than 200 μm across and they were usually associated with necrosis; the spherical calcifications were similar to psammoma bodies and had an average size of 30 μm. Both irregular and spherical calcifications appeared to be generally present in breast cancer for stages T1, T2 and T3. The stages were judged according to the size of the tumour, following World Health Organization (2017) protocols.
Calcifications (indicated by arrows) in optical microscopy images of breast carcinoma. (a) Irregular calcifications in a stage T1 breast carcinoma. (b) Spherical calcifications in a stage T2 breast carcinoma. (c) Spherical calcifications in a stage T3 breast carcinoma. Scale bars: (a) 200 μm; (b, c) 50 μm.
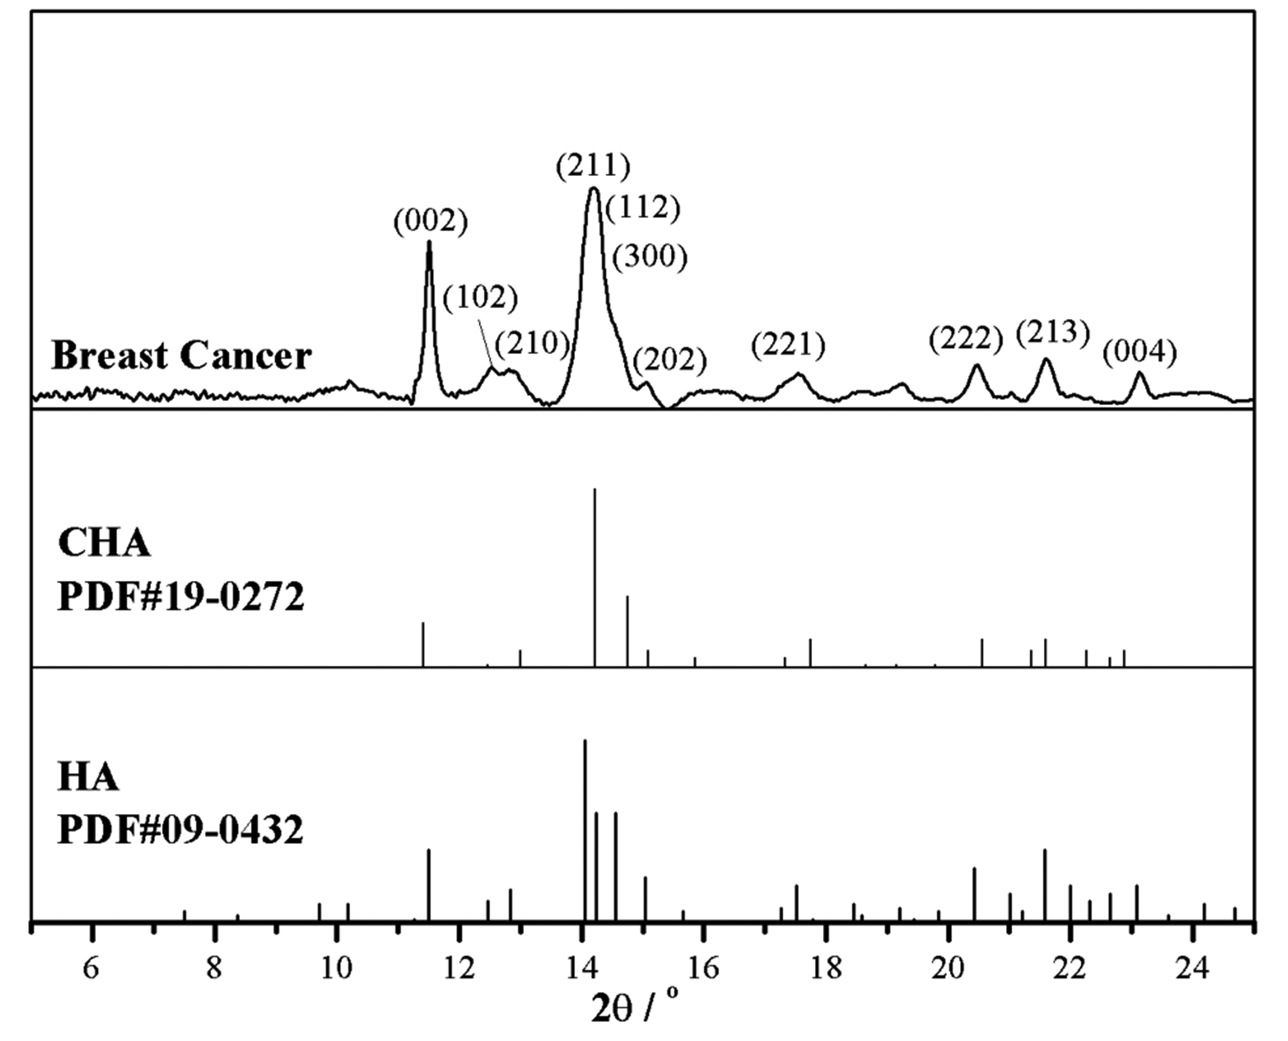
The mineral phases of the calcifications were identified using SR-XRD. As shown in Fig. 3, the diffraction pattern for the calcifications were indexed as hydroxylapatite (Ca5(PO4)3(OH), using PDF#09-0432 (powder diffraction file from the International Centre for Diffraction Data, http://www.icdd.com/). Compared to the standards for hydroxylapatite and carbonated hydroxylapatite (‘CHA’, Ca5[PO4,CO3]3(OH), PDF#19-0272), slight shifts and widening of the peaks corresponding to the (002), (211) and (202) faces were evident, suggesting poor crystallinity, or interference from organic residues. These factors made it difficult to determine whether the sample best matched hydroxylapatite or CHA.
SR-XRD pattern of a breast cancer calcification and comparison with standards: CHA – carbonated hydroxylapatite (PDF#19-0272) and HA – hydroxylapatite, Ca5(PO4)3(OH), (PDF#09-0432).
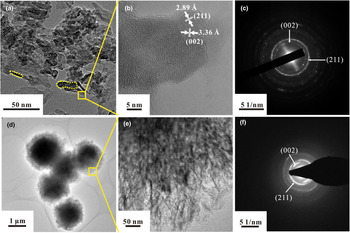
The fine structure of separated calcifications was examined using TEM. In all cases, the dominant morphology of the aggregates was short columnar or dumbbell-shaped crystals with widths of 10–15 nm and lengths of 20–50 nm (Fig. 4a, dotted line). Both lattice fringe images (Fig. 4b) and diffraction patterns (Fig. 4c) showed the two dominant interplanar distances as 3.36 and 2.89 Å, which are matched well to the (002) and (211) planes of hydroxylapatite (PDF#09-0432), respectively. Notably, compared with lattice parameters of hydroxylapatite, standard CHA (PDF#19-0272) has slightly larger c and smaller a, resulting in its larger (002) spacing (3.46 Å) and smaller (211) spacing (2.79 Å). Therefore, the main phase of most aggregates observed in TEM should be hydroxylapatite; some minor CHA might co-exist and cannot be ruled out. The multiple domains in the lattice photograph and the rings in the diffraction pattern show that these short columnar or dumbbell-like crystals are polycrystalline aggregates.
TEM morphologies (a, d, e), lattice photographs (b), and diffraction patterns (c f) of calcifications in breast cancer. (a) Short columnar (dotted line, left) or dumbbell-like crystals (dotted line, right) with width of 10–15 nm and length of 20–50 nm. (b) Lattice photograph of the area selected in (a). (c) Diffraction pattern from the area in (b). (d) Spherical calcifications, ~1 μm in diameter. (e) Enlarged view of area selected in (d). (f) Diffraction pattern from the area of (e).
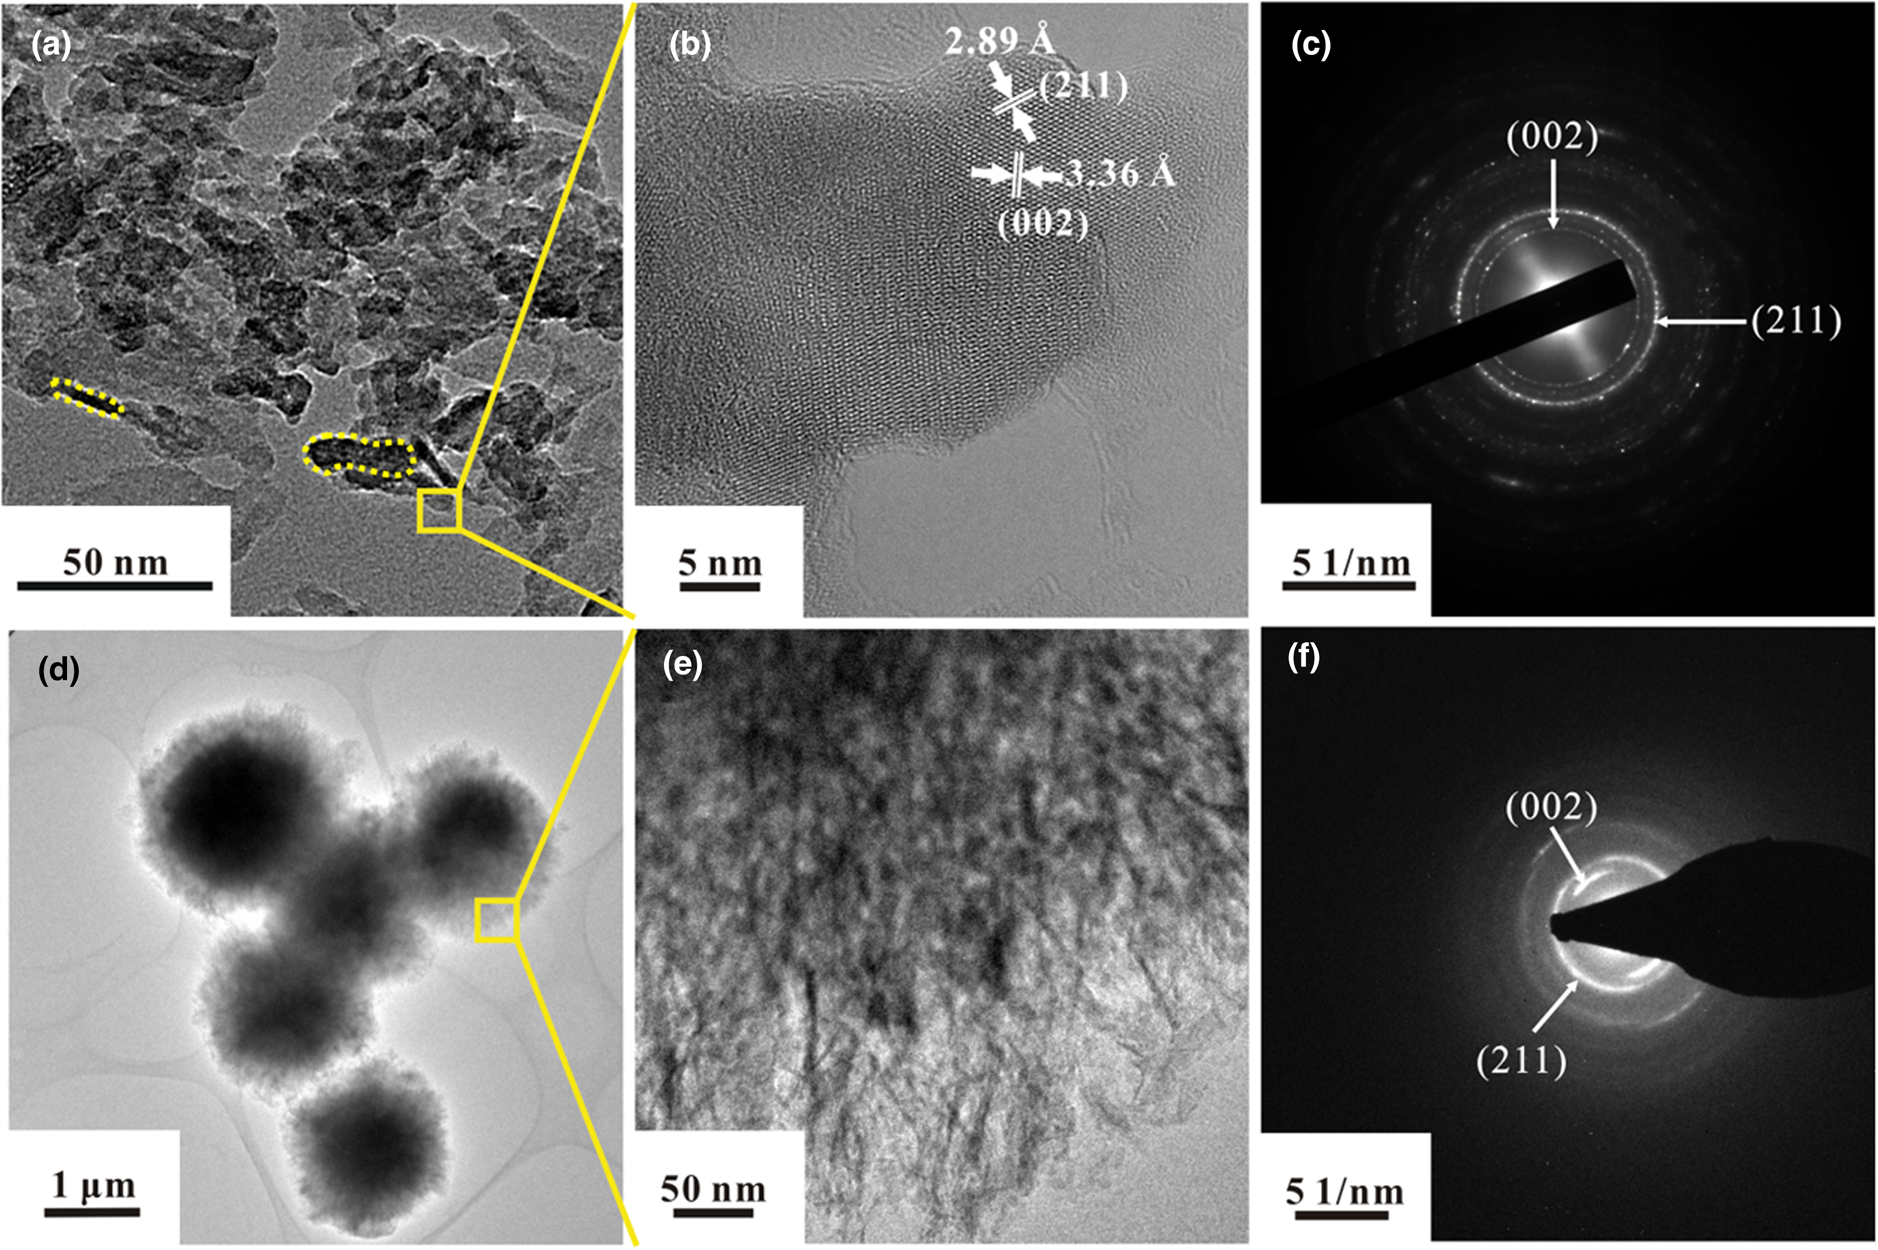
Spherical aggregates (Fig. 4d) in a sample from an 86-year-old woman were larger than 1 μm in diameter, similar to the psammoma bodies. The outer part of the particles was amorphous and was thinner than the centre. An enlarged view showed that the surface of the spherical aggregates consisted of fibrous nanocrystals whose longitudinal axis was oriented towards the centre of the sphere (Fig. 4e). Two dominating diffraction patterns for fibrous nanocrystals, belonging to (002) and (211) planes, also confirmed the presence of hydroxylapatite as the main crystallised phase (Fig. 4f). Notably, the degree of crystallinity for the fibrous nanocrystal aggregates was poor relative to the crystallinity of the columnar and dumbbell-shaped crystals.
Carbonate substitution
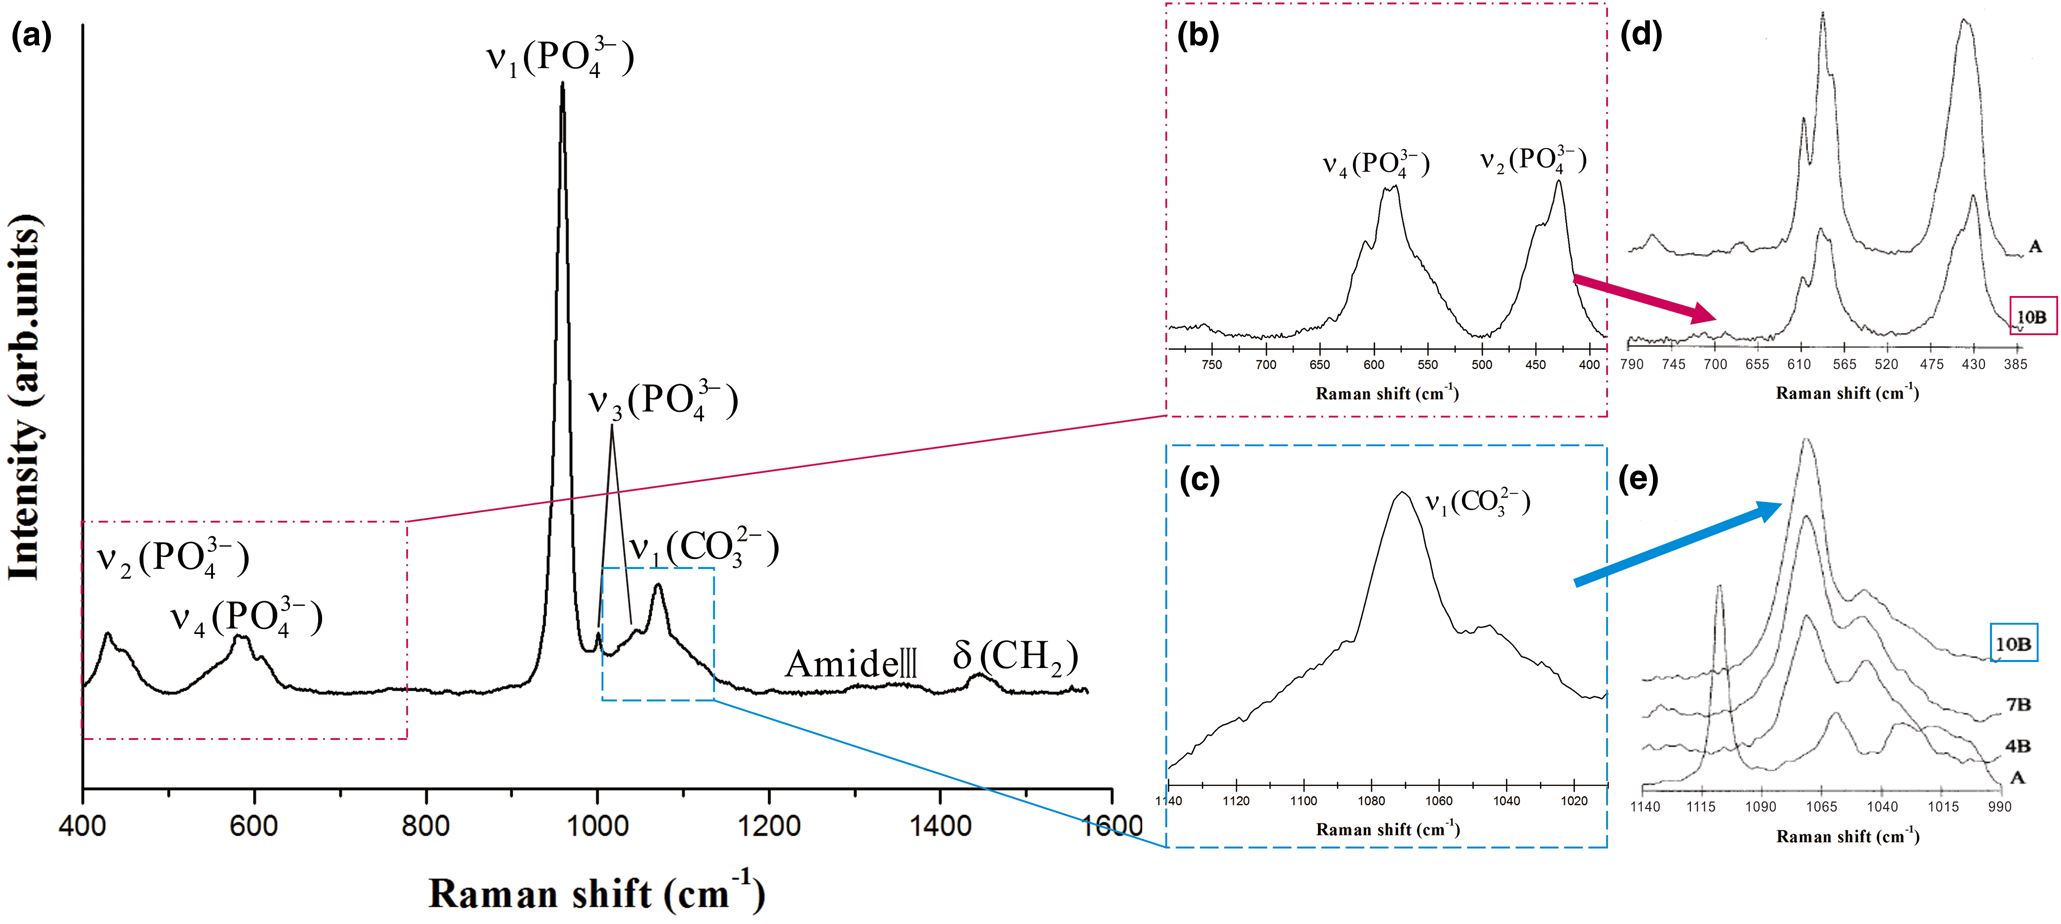
According to the EDAX results (Table 1) for section samples on silicon wafers, the major elements present in the calcifications were carbon (C), oxygen (O), calcium (Ca) and phosphorus (P). The Ca:P ratio (atomic percentage) varied from 1.13 to 2.35. Raman spectra, Raman mappings, and FTIR spectra of the calcifications, are shown in Figs 5–7, respectively. According to previous research (Penel et al., Reference Penel, Leroy, Rey and Bres1998; Awonusi et al., Reference Awonusi, Morris and Tecklenburg2007; Antonakos et al., Reference Antonakos, Liarokapis and Leventouri2007; Wang et al., Reference Wang, Qian, Bao, Gu and Zhu2018), the single Raman band for ν1(PO43–) near 960 cm–1, the two bands near 432 and 445 cm–1 for ν2(PO43–), and the ν1(CO32–) band near 1071 cm–1 are specific to B-type CO32– substitution (PO43– substituted by CO32–) (Fig. 5a). A comparison of the 432 and 445 cm–1 bands for the breast cancer calcifications (Fig. 5b) with those of reference spectra (Fig. 5d) showed that the CO32– substitution was mainly of the B type, and a comparison of the band near 1071 cm–1 in the experimental (Fig. 5c) and reference (Fig. 5e) spectra confirmed that B-type CO32– substitution was present in the hydroxylapatite of the calcification.
Raman spectra for breast cancer calcifications. (a) 400–1600 cm–1 range. (b) ν2 and ν4 modes of PO43– (c) ν1 mode of CO32–. (d, e) Reference spectra from Penel et al. (Reference Penel, Leroy, Rey and Bres1998), where A indicates 5.8 wt.% A-type CO32– substitution, and 10B indicates 10 wt.% B-type CO32– substitution.
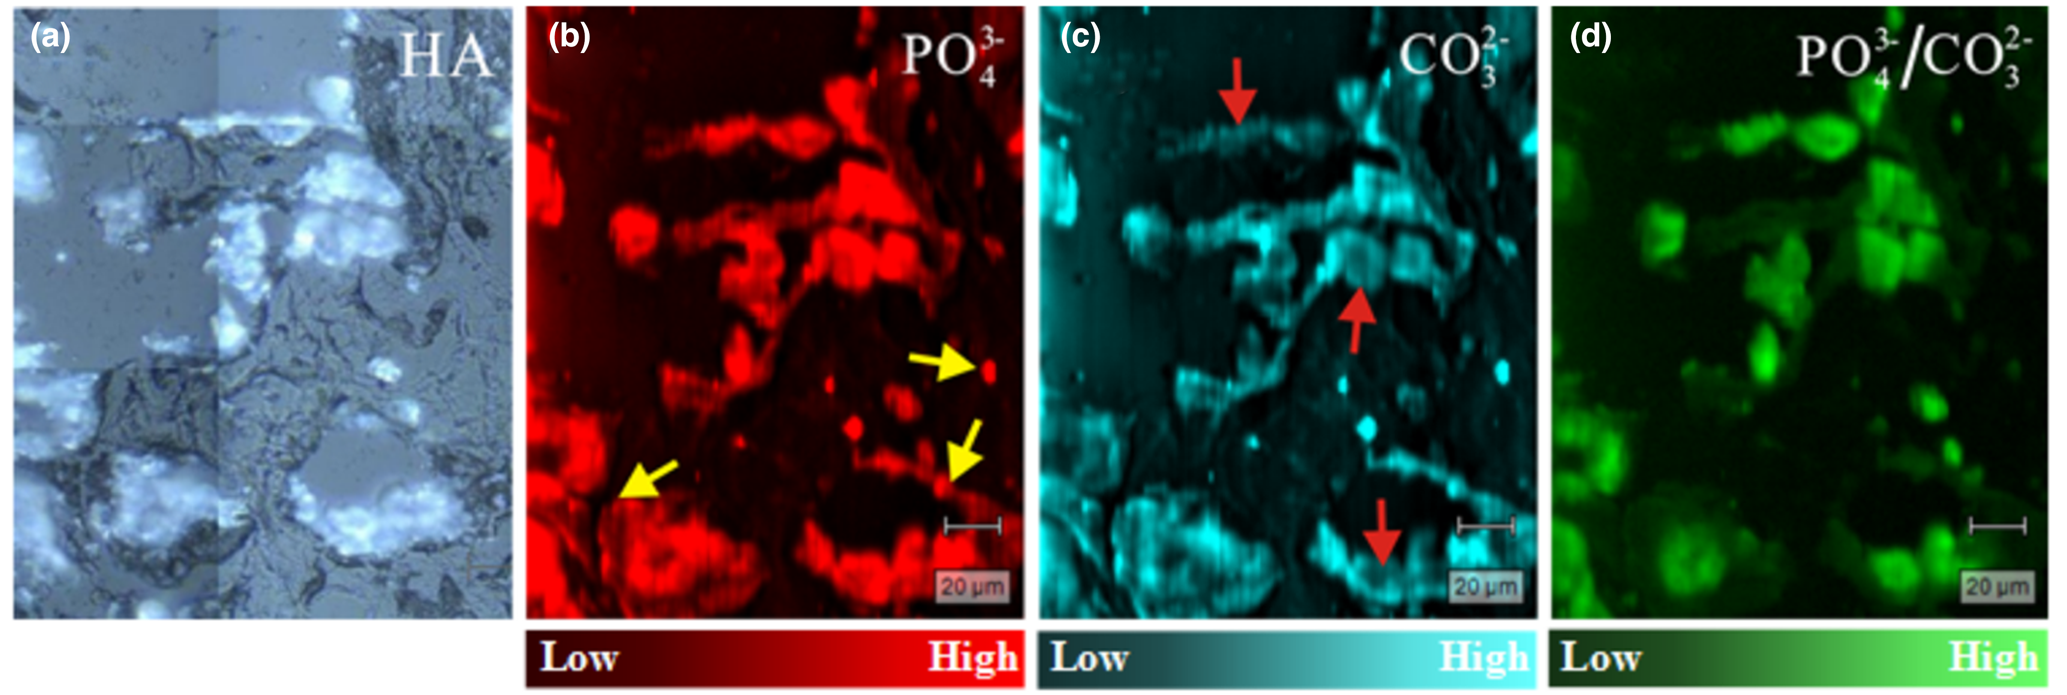
Raman scattering maps of a breast cancer tissue section. (a) Light-microscope image (50×); (b) distribution of PO43– (I 958); (c) distribution of CO32– (I 1074); and (d) PO43–:CO32– ratio (I 958/I 1074). Intensities from low to high are represented by colour brightness; arrowed sites discussed in text.
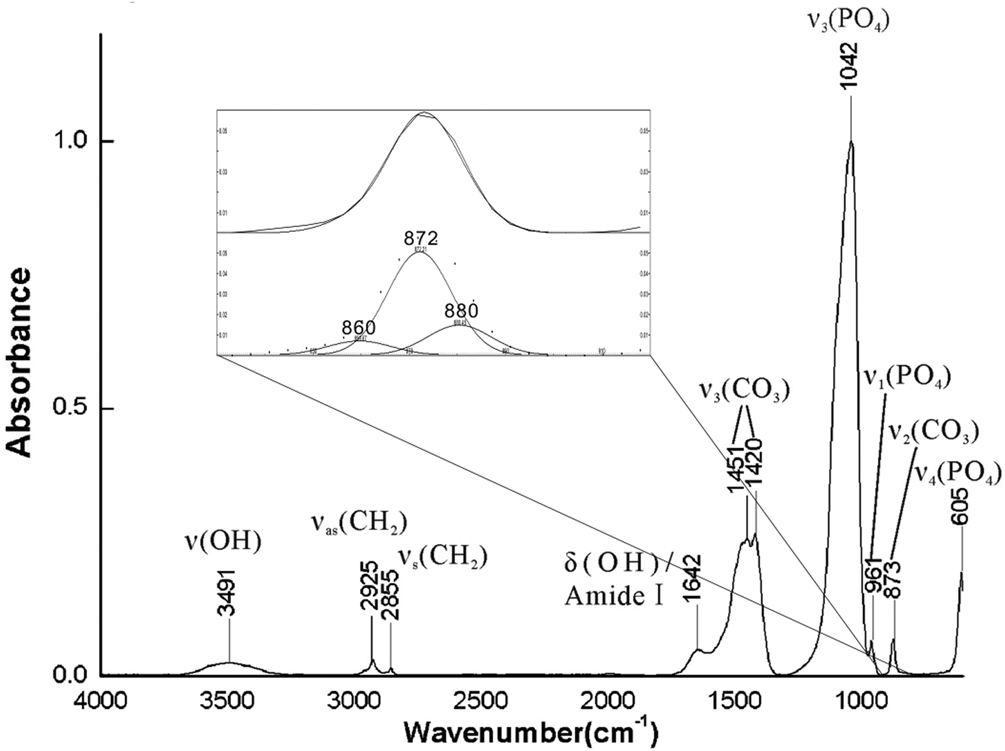
FTIR spectra of breast cancer calcifications and fitted results in the 900–800 cm–1 range.
EDAX results for breast cancer calcifications.

The distributions of CO32– and PO43– were obtained from Raman scattering mappings of tissue sections. Calcifications appeared as bright white regions in optical microscopy images (Fig. 6a), and organic tissues appeared dark in the images. According to the spectral characteristics of the Raman imaging test, the substitution amount of PO43– was examined at its peak intensity at 958 cm–1 (denoted as I 958), and the substitution amount of CO32– was examined at its peak intensity at 1074 cm–1 (denoted as I 1074). The amounts of PO43– (I 958, Fig. 6b) and CO32– (I 1074, Fig. 6c) indicated are generally consistent with the distribution of mineralisation in Fig. 6a, and some areas (indicated by the arrow in Fig. 6b) are outside of the mineralised areas visible in the ordinary microscopy image (Fig. 6a), illustrating an inter-relationship between organic tissues and minerals through PO43– and CO32–. Because the CO32– intensity in some areas is low (arrows in Fig. 6c), the I 958/I 1074 ratio was calculated to ascertain the uniformity of PO43–/CO32– in the sample. The results (Fig. 6d) show that the distribution of this ratio is not significantly different from the distribution of calcification itself (Fig. 6a), indicating that the distribution of CO32– in mineralisation is broad and uniform.
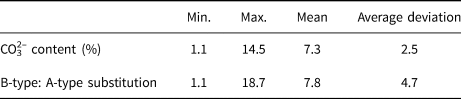
The strongest peak in the FTIR spectra (Fig. 7) was near 1042 cm–1, and it was assigned as ν3 (PO43–). The ν1 (PO43–) peak at 961 cm–1 was very weak, as is common in ‘bioapatite’, and the ν4 (PO43–) peak at 605 cm–1 indicates that the main group of calcifications was PO43– (Krajewski et al., Reference Krajewski, Mazzocchi, Buldini, Ravaglioli, Tinti, Taddei and Fagnano2005; Antonakos et al., Reference Antonakos, Liarokapis and Leventouri2007). The peaks between 1409 and 1457 cm–1 were typical for substitution of PO43– by CO32–. After fitting, three peaks at approximately 860, 872, and 880 cm–1 were observed in the 900–800 cm–1 range. The peaks at 872 and 880 cm–1 were assigned to B-type hydroxylapatite (substitution of PO43– by CO32–) and A-type hydroxylapatite (replacement of OH– by CO32–), respectively. The results demonstrate that CO32– substituted into both PO43– and OH– sites of hydroxylapatite, as in the A–B type substitution (Fleet and Liu, Reference Fleet and Liu2003; Antonakos et al., Reference Antonakos, Liarokapis and Leventouri2007). Ou-Yang et al. (Reference Ou-Yang, Paschalis, Mayo, Boskey and Mendelsohn2001) reported that the intensity ratio of ν3 (CO32–) to ν3 (PO43–) was linear with percentage of CO32–. The percentage ratio of B- to A-type substitution has been estimated based on the intensity ratio of I 872/I 880 (Mangialardo et al., Reference Mangialardo, Cottignoli, Cavarretta, Salvador, Postorino and Maras2012). Table 2 summarises the results of such calculations for 27 cases (the IR spectra of another three cases were of poor quality) examined herein. The CO32– content varied from 1.1% to 14.5% with a mean value of 7.3%, which was consistent with typical values for ‘bioapatite’ (Antonakos et al., Reference Antonakos, Liarokapis and Leventouri2007; Wang et al., Reference Wang, Qian, Bao, Gu and Zhu2018). In all cases, B-type substitution was the dominant type of substitution, and the ratio of B-type to A-type substitution was as high as 18.
CO32– content and ratio of B- to A-type substitution in breast cancer calcifications.
Cation substitution
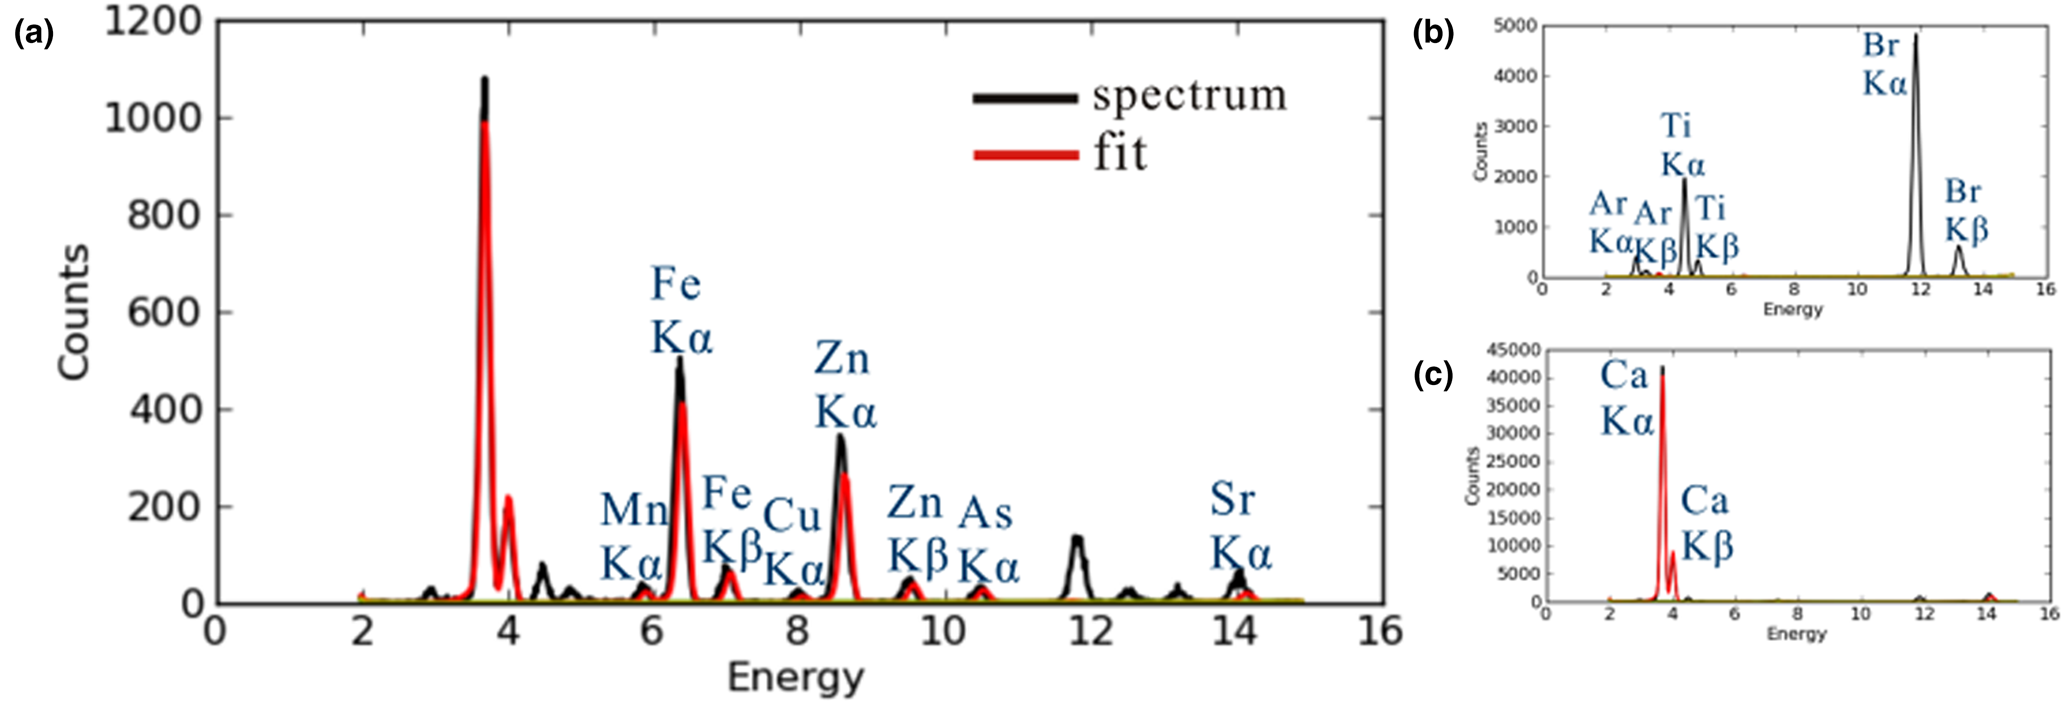
Results from the SR-XRF of the calcifications are compared with a blank 3M film and a hydroxylapatite standard in Fig. 8. Compared to major Ca, the proportions of Zn, Fe and Sr were < 1%. After data fitting for Kα peak areas, the presence of trace amounts of Cu, Mn and As were verified. In addition, EDAX also indicated the presence of Na and Mg in the calcifications, although neither Na nor Mg was found in amounts greater than 1 wt.% (Table 1).
Fitting curves of SR-XRF results. (a) Breast cancer calcifications; (b) blank 3M film; (c) hydroxylapatite standard. Black line: experimental results; red line: fitting curve.
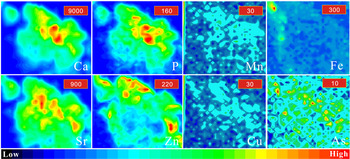
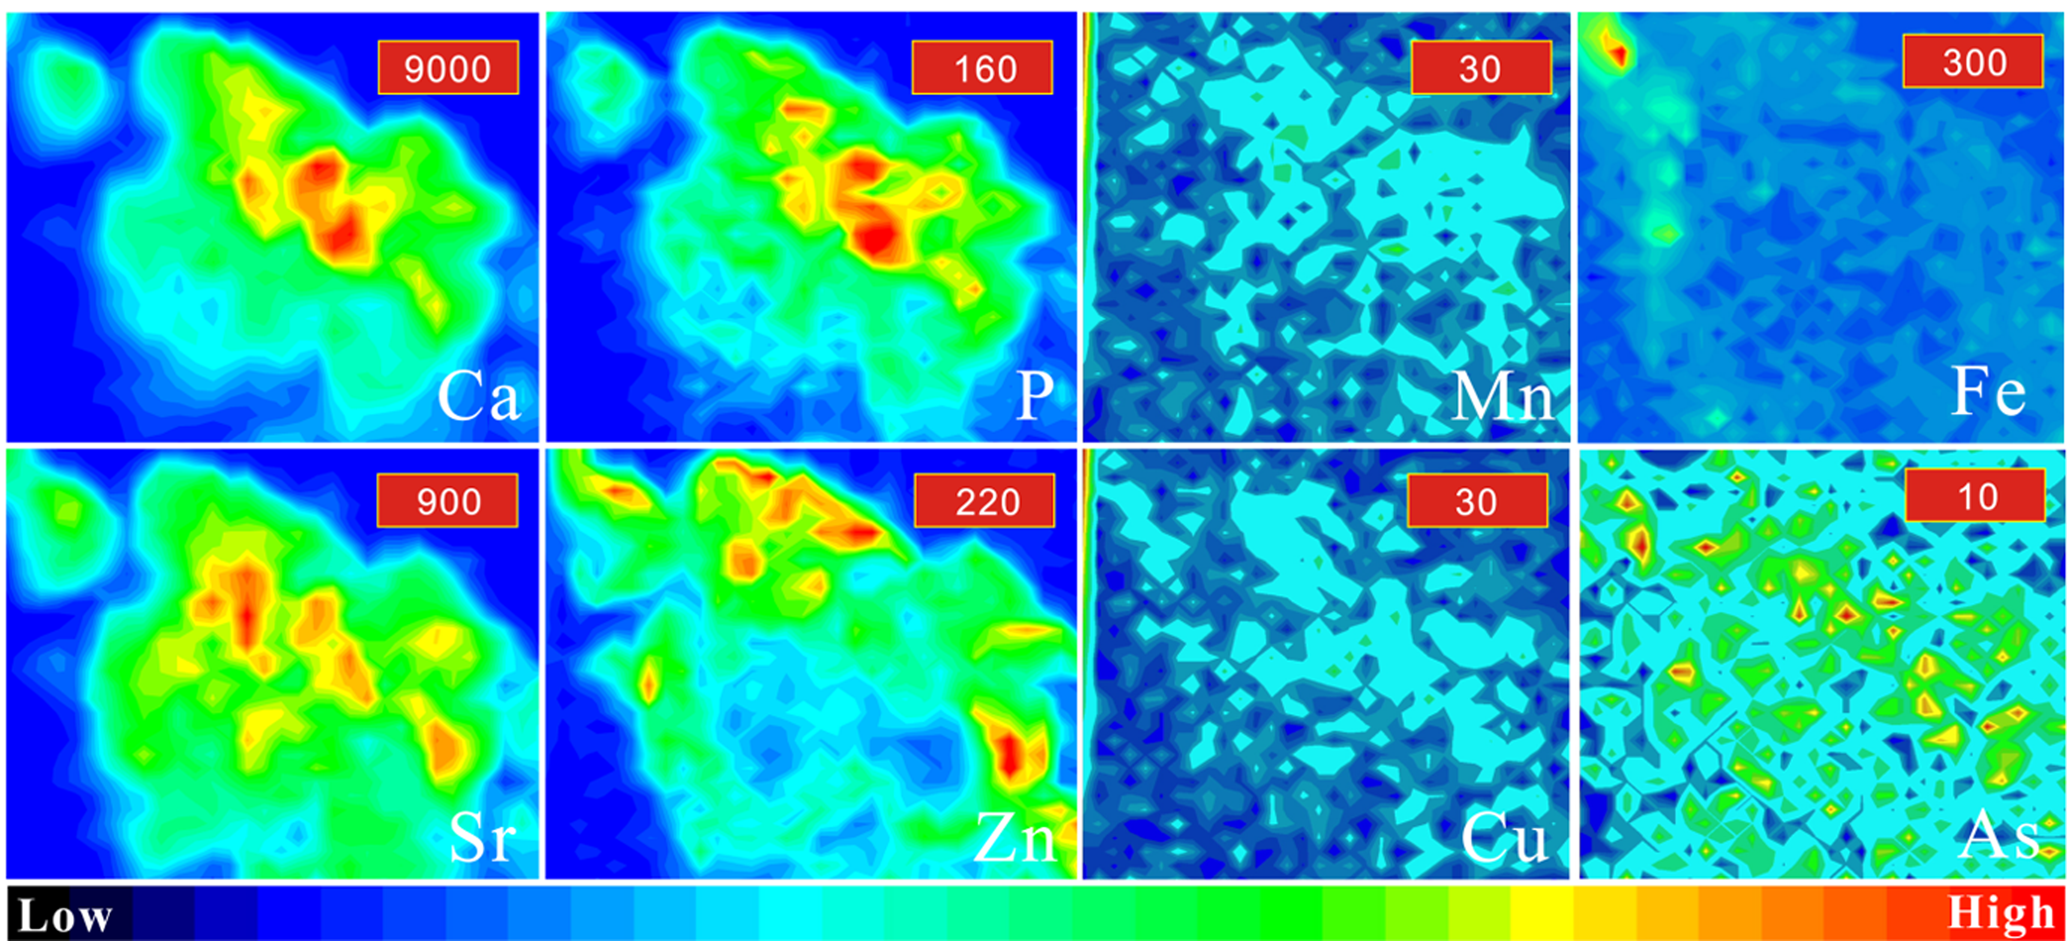
The distributions of Ca, P, Mn, Fe, Cu, Zn, As and Sr were examined for a 0.1 mm × 0.1 mm area sample of breast cancer tissue (Fig. 9). Calcium and phosphorus, the main elements in hydroxylapatite, were distributed roughly in accordance with the contours of the calcification. Remarkably, the distribution of Zn showed a higher concentration around the periphery of the calcification than in the centre. Copper, Mn and As were distributed in much smaller amounts within the profile of the calcification, which makes it difficult to compare their distribution patterns with those for Ca and P. Fe was distributed mainly outside the calcification (determined according to the distribution of Ca), and it was associated with the surrounding organics.
Distribution of Ca, P, Mn, Zn, Sr, Fe and Cu within a 0.1 mm × 0.1 mm area in breast cancer. Colours from red to blue represent the highest to lowest counts. The maximum counts of each element are listed in the red box in the upper-right corner of each image. The intensities from low to high are represented by different colours.
Discussion
Carbonate substitution
It is generally accepted that hydroxylapatite is the main mineral phase in breast cancer calcifications (Garola et al., Reference Garola and McGuire1978; Panko, Reference Panko, Watson and Clark1981; Maaroufi et al., Reference Maaroufi, Lacroix, Lespagnard, Journé, Larsimont and Leclercq2000; Tanwell et al., Reference Tanwell, Gescher, Bradshaw and Pettit1994), and the results for all of the cases in this study accord well with previous findings. The TEM, EDAX, FTIR and Raman results reported herein also indicated the presence of CHA in the calcifications. Carbonated hydroxylapatite ‘CHA’ has not been designated as a natural mineral by the International Mineralogical Association (IMA) (Pasero et al., Reference Pasero, Kampf, Ferraris, Pekov, Rakovan and White2010), but it has been well-studied in biocalcifications (Penel et al., Reference Penel, Leroy, Rey and Bres1998; Dorozhkin and Epple, Reference Dorozhkin and Epple2002; Ivanova et al., Reference Ivanova, Frank-Kamenetskaya, Kol'tsov and Ugolkov2001), where it is often referred to as ‘bioapatite’ or biological apatite. The wide range of the Ca:P ratio might be due to interference of organic tissues, involvement of CO32–, or calcium deficiency in the crystals.
In all the breast cancer cases we studied, the average CO32– level in the calcifications was 7.3%. Previous studies that employed IR spectra to quantify the CO32– level of biocalcifications have suggested that the average CO32– level in trabecular bone is 6.38% (Ou-yang et al., Reference Ou-Yang, Paschalis, Mayo, Boskey and Mendelsohn2001) and the average CO32– level in human heart-valve calcifications is 5–10% (Mangialardo et al., Reference Mangialardo, Cottignoli, Cavarretta, Salvador, Postorino and Maras2012). The CO32– content in ash samples from enamel and bone have been estimated to be 4.1 and 6.5 wt.% (Elliott, Reference Elliott, Kohn, Rakovan and Hughes2002) and 3.2 and 5.8 wt.% (Gross and Berndt, Reference Gross, Berndt, Kohn, Rakovan and Hughes2002), respectively. The CO32– contents found in enamel, bone, human heart-valve calcifications, and breast cancer calcifications appear to be different. Therefore, the interior environment of the human body may be linked with CO32– substitution during intracorporeal calcification.
CO32– can substitute into the hydroxylapatite structure at either OH– or PO43– sites, yielding A- or B-type CHA, respectively (LeGeros et al., Reference LeGeros, Trautz, Klein and LeGeros1969; Fleet and Liu, Reference Fleet and Liu2003; Antonakos et al., Reference Antonakos, Liarokapis and Leventouri2007). Highly crystalline A-type CHA can be formed by reaction of hydroxylapatite with CO2 gas at high temperatures (800–1000°C) (Ito et al., Reference Ito, Maekawa, Tsutsumi, Ikazaki and Tateishi1997), whereas B-type CHA can be formed by precipitation from aqueous media at temperatures of 20–95°C (Krajewski et al., Reference Krajewski, Mazzocchi, Buldini, Ravaglioli, Tinti, Taddei and Fagnano2005; Merry et al., Reference Merry, Gibson, Best and Bonfield1998; Jarcho et al., Reference Jarcho, Bolen, Thomas, Bobick, Kay and Doremus1976). Substitution of CO32– at the B site has been found to reduce crystallinity and crystal size (Blumenthal and Posner, Reference Blumenthal and Posner1973; Blumenthal et al., Reference Blumenthal, Betts and Posner1975; Nelson and Featherstone, Reference Nelson and Featherstone1982), which makes it difficult to characterise it clearly. Because the environment of the human body is comparable to the synthetic conditions that yield B-type CHA, it is not surprising that B-type substitution dominates in breast cancer calcifications. In synthetic experiments, CHA formed at 37°C accommodated the maximum CO32– content measured herein (14 wt.%), and B-type substitution was more prevalent (Barralet et al., Reference Barralet, Best and Bonfield1998). However, the pH used (pH >11) during the synthetic experiments is much higher than that found in the fluid environment of the human body (pH ≈7.5). Therefore, the formation of B-type CHA in breast cancer calcifications may not be the result of an inorganic process but a biological one, and the macromolecules and interstitial fluid around the calcification may account for the regulation of B-type CHA (Blumenthal and Posner, Reference Blumenthal and Posner1973; Rimola et al., Reference Rimola, Corno, Zicovich-Wilson and Ugliengo2009; Kato et al., Reference Kato, Fukuzawa and Mochizuki2015).
Cation substitution and its association with A- or B-type substitution
Regarding cation substitution, we found Na, Mg, Zn, Fe, Sr, Cu, Mn and As in the hydroxylapatite of breast cancer calcifications. Considering that the point of the zero charge (PZC) of hydroxylapatite is fixed at ~pH 8 (Tarasevich et al., Reference Tarasevich, Shkutkova and Janusz2012), the surface of hydroxylapatite in standard body fluid (pH 7.3–7.5) thus has a positive charge. Therefore, cations are not likely to be electrostatically adsorbed by hydroxylapatite in this case. According to the foundational theory of isomorphic substitution for the apatite group, the basic requirements for substitution are similar ionic (or atomic) radius, overall charge balance, similar chemical bond and similar thermodynamic conditions (White and Dong, Reference White and Dong2003; Pasero et al., Reference Pasero, Kampf, Ferraris, Pekov, Rakovan and White2010). Due to the similar geochemical properties of Ca, Mg and Sr, it is not surprising that Mg and Sr can substitute for Ca in hydroxylapatite, in addition As can replace P (Pasero et al., Reference Pasero, Kampf, Ferraris, Pekov, Rakovan and White2010). In natural geological mineral phases, more than half of the elements that occur as long-lived isotopes can be incorporated into the apatite structure (Hughes and Rakovan, Reference Hughes and Rakovan2015). Therefore, the elements As, Fe, Mg, Mn and Sr often coexist in hydroxylapatite (Pan and Fleet, Reference Pan, Fleet, Kohn, Rakovan and Hughes2002). Due to the need for similar ionic radius (Table 3) and charge balance for CO32– substitution, Na can substitute for Ca (El Feki et al., Reference El Feki, Savariault, Salah and Jemal2000). Although there are differences between the ionic radius of Zn and Ca, we found that the distribution pattern of Zn was very similar to that of Ca, so there is no doubt that Zn can substitute into the crystal lattice of hydroxylapatite, probably by filling a Ca vacancy, a conclusion that supports the findings of computational modelling (Matsunaga et al., Reference Matsunaga, Murata, Mizoguchi and Nakahira2010). Other trace elements with smaller ionic radii (Table 3), such as As, Fe, Mn and Cu, can also be adsorbed onto negatively charged sites (Kawasaki et al., Reference Kawasaki, Takahashi and Ideda1985). In addition, it is possible for As and, rarely, Mn to enter the crystal structure as AsO43– and MnO43– substituting for PO43– (Pan and Fleet, Reference Pan, Fleet, Kohn, Rakovan and Hughes2002; Szuszkiewicz et al., Reference Szuszkiewicz, Pieczka, Gołębiowska, Dumańska-Słowik, Marszałek and Szełęg2018). Unfortunately, further confirmation of these mechanisms in breast cancer calcifications was difficult due to their minute amounts, tiny sizes, and the poor crystallinity of hydroxylapatite. Similar mechanisms, however, have been proposed in studies of synthetic hydroxylapatite (Barralet et al., Reference Barralet, Best and Bonfield1998; Gibson and Bonfield, Reference Gibson and Bonfield2002; El Feki et al., Reference El Feki, Savariault, Salah and Jemal2000; Nelson and Featherstone, Reference Nelson and Featherstone1982; Vignoles et al., Reference Vignoles, Bonel, Holcomb and Young1988; Ivanova et al., Reference Ivanova, Frank-Kamenetskaya, Kol'tsov and Ugolkov2001).
Ionic radii of metallic elements found in breast cancer calcifications.

Carbonate and cation substitutions complicate the structure of hydroxylapatite in breast cancer calcifications and provide multiple routes to charge balance in the crystal lattice. In hydroxylapatite, when CO32– replaces OH–, either more or higher-valence cations are needed for charge balance, unless the ratio of CO32– insertion to OH– removal is 1:2. When CO32– substitutes for PO43–, fewer cations, lower-valence cations, or Ca vacancies are needed to maintain the charge balance. In breast cancer calcifications, B-type CO32– substitution is dominant, so the charge cannot be balanced by the coexistence of B-type and A-type substitutions alone. Therefore, it is not surprising to find Na in the crystal lattice, and Ca vacancies are highly likely.
Diagnostic significance and implications
Isomorphic substitution is very common in ‘bioapatite’ and has been studied extensively in bones and teeth (Johnson et al., Reference Johnson, Armstrong and Singer1966; Nemliher et al., Reference Nemliher, Baturin, Kallaste and Murdmaa2004; Li and Pasteris, Reference Li and Pasteris2014; Seredin et al., Reference Seredin, Goloshchapov, Prutskij and Ippolitov2015), but it has rarely been investigated in breast cancer calcifications (Romaniuk et al., Reference Romaniuk, Lyndin, Moskalenko, Hortynska and Lyndina2016). This work firstly observed that cations like Na+, Mg2+, Zn2+, Fe3+, Sr2+, Cu2+, Mn2+ and As5+ could coexist in the calcifications, and CO32– substitution was dominated by B-type substitution (schematically shown in Fig. 1). Thus, the calcifications seem to be more chemically active than pure hydroxylapatite.
Interactions between organics and calcifications may prove interesting. For example, macromolecules and interstitial fluids adjacent to the calcifications may influence the sites of CO32– substitution, as evidenced both by the failure to synthesise B-type CHA under conditions similar to those within the human body (Barralet et al., Reference Barralet, Best and Bonfield1998) and by the large difference between the CO32– content found in enamel and breast cancer calcifications. The calculations of CO32– content and the ratio of B- to A-type substitution in the calcifications provide quantitative data that can be used to determine the characteristics of breast cancer from a mineralogical perspective.
The identification of trace elements such as Zn, Fe, Sr, Cu, Mn and As may serve as a useful and promising diagnostic for breast cancer calcifications. Previous studies found that only the elements Ca, P, Mg, S, Na, Cl and K were found in breast cancer calcifications (Ng et al., Reference Ng, Looi and Bradley1997; Romaniuk et al., Reference Romaniuk, Lyndin, Moskalenko, Hortynska and Lyndina2016; Scimeca et al., Reference Scimeca, Bischetti, Lamsira, Bonfiglio and Bonanno2018), mainly due to the limitations of the measurements. The presence of other trace elements, including the Cu and Zn that we have observed, has great value for breast cancer research. Yücel et al. (Reference Yücel, Arpaci, Özet, Döner, Karayilanoĝlu, Sayar and Berk1994) is the only report of Cu found in patients with breast cancer that were significantly higher than in a control group. Our findings of Cu and Zn in breast cancer calcifications with a uniform distribution show that hydroxylapatite could be one of the most important sinks of these abnormal elements in the body. In addition, breast cancer tumours were found to have a significantly lighter Zn isotopic composition (–0.6 to –0.9‰ of δ66Zn) than healthy breast tissue (–0.3 to –0.5‰) as well as blood and serum (–0.1 to +0.3‰) in both groups (Larner et al., Reference Larner, Woodley, Shousha, Moyes, Humphreys-Williams, Strekopytov, Halliday, Rehkämper and Coombes2015). Because the trace elements present in breast cancer calcifications are in a relatively stable state, their detection in calcifications will be more meaningful clinically than their detection in the organic tissues. In turn, the development of calcifications can change the local environment as Ca, phosphate ions, and trace elements are accumulated at the calcification site (Cui et al., Reference Cui, Vogt, Olson, Glass and Rohan2007; Saul, Reference Saul2009). This process can be considered a type of detoxification (Saul, Reference Saul2009), because relatively high levels of Zn, Fe and Ca in benign breast tissue may be associated with a modest increase in risk for subsequent breast cancer (Cui et al., Reference Cui, Vogt, Olson, Glass and Rohan2007).
The concentrations or ratios of trace elements in breast cancer calcifications also have promise for building corresponding diagnostic pools. However, we have not yet found a way to establish a diagnostic pool of this type using current data. Further data is needed and we encourage more mineralogists and materials scientists to join this field to allow sufficient data to be gathered to create a diagnostic pool. The in situ micro-mapping of elements based on synchrotron radiation light source as well as micro-Raman and FTIR are an effective method to investigate the distribution and substitution of elements in biogenic microcalcifications.
Conclusions
The breast cancer calcifications investigated were found to consist of either irregular aggregates with widths greater than 200 μm, or spherical aggregates similar to psammoma bodies with an average diameter of 30 μm. Short columnar or dumbbell-shaped aggregates with widths of 10–15 nm and lengths of 20–50 nm were the most common morphologies. Hydroxylapatite was the dominant mineral phase in the calcifications, and both CO32– and cation substitutions were present in the hydroxylapatite structure. The appearance in the FTIR spectra of peaks at 872 and 880 cm–1 indicated that CO32– substituted both PO43– and OH– sites of hydroxylapatite. The ratio of B-type to A-type substitution was estimated to be in the range of 1.1–18.7 from the ratio of the peak intensities (I 872/I 880), and the CO32– contents varied from 1.1% to 14.5%. Trace elements of Na, Mg, Zn, Fe, Sr, Cu, Mn and As were present in the calcifications. Therefore, breast cancer calcifications may provide a diagnostic site for these trace elements.
Acknowledgements
This work was supported by the National Natural Science Foundation of China (4177020314, 41522201) and the DDE-IUGS Big Science Program. We thank the staff at BL15U and SSRF for providing beam time and offering help during the tests.