INTRODUCTION
The main factors currently limiting the world's crop production are osmotically challenged conditions such as drought and soil salinity. Water resources are limited in most of the countries around the eastern and southern Mediterranean (Parry et al. Reference Parry, Flexas and Medrano2005) and in many other parts of Africa and Asia (FAO 2003) as well as Australia (Chapman Reference Chapman2008). Some estimates indicate that half of the total global area of wheat sown annually is affected regularly by drought (Pfeiffer et al. Reference Pfeiffer, Trethowan, Van Ginkel, Ortiz-Monasterio, Rajaram, Ashraf and Harris2005). The reduction of wheat yield, depending on time and intensity of drought and also additional kinds of biotic and abiotic stresses, varies from 10 to 90% of its potential yield under non-stressed conditions (Reynolds et al. Reference Reynolds, Mujeeb-Kazi and Sawkins2005).
Three stages in wheat growth are particularly sensitive to the effects of water deficiency, namely seedling establishment, booting and grain filling (Fischer & Turner Reference Fischer and Turner1978). The last of these stages, being at the end of the season, is usually accompanied by damaging high temperatures during the summer months. If soil has insufficient moisture at the time of sowing then germination and seedling establishment will be poor, leading to fewer plants per unit area with smaller growth potential. Drought at meiosis (e.g. while wheat is at booting) leads to reduced fertility, which reduces the number of grains per plant (Fischer & Turner Reference Fischer and Turner1978). Moreover, drought and high temperatures during grain filling combine to reduce the rate and duration of grain filling, resulting in small or shrivelled grains (Prasad et al. Reference Prasad, Pisipati, Momčilović and Ristić2011).
Under rainfed conditions in arid and semi-arid regions, low moisture is a regular limiting factor during germination. Although terminal drought is most frequently experienced by wheat grown in the Mediterranean Basin, due to the high variability in rainfall pattern, water shortages in Mediterranean environments can also occur from sowing time (e.g. late autumn) to early spring (Maccaferri et al. Reference MacCaferri, Sanguineti, Demontis, El-Ahmed, Del Moral, Maalouf, Nachit, Nserallah, Ouabbou, Rhouma, Royo, Villegas and Tuberosa2011). Also, autumn-sown wheat in continental climates frequently experiences low water potential early in the season prior to and/or shortly after seedling emergence (Landjeva et al. Reference Landjeva, Korzun, Stoimenova, Truberg, Ganeva and Börner2008). In such cases, drought has an even stronger negative effect on yield than in later stages of growth, because it impacts yield potential at the sink level by decreasing the number of fertile spikes per unit area at the crop establishment and tillering phases, as well as the number of grains per spike (Maccaferri et al. Reference MacCaferri, Sanguineti, Demontis, El-Ahmed, Del Moral, Maalouf, Nachit, Nserallah, Ouabbou, Rhouma, Royo, Villegas and Tuberosa2011). Therefore, a strategy to alleviate the effects of drought at this critical time needs to ensure that seeds can germinate and seedlings can establish themselves at lower soil moisture contents than normal or can survive deeper sowing depths (where soil moisture will be high enough to support germination and early growth). Previous studies have demonstrated considerable genetic variability in growth response to low water potentials at very early seedling stage (Landjeva et al. Reference Landjeva, Korzun, Stoimenova, Truberg, Ganeva and Börner2008) as well as coleoptile length (COL) and diameter (Rebetzke et al. Reference Rebetzke, Richards, Sirault and Morrison2004) in wheat.
Studies in several crop species have shown that differences in the earliest stages of ontogeny can be related to differences observed later in the season. For example, barley genotypes with the greatest relative growth of coleoptile also had the greatest capacity for osmotic adjustment in the flag leaf and produced the greatest yields in experiments with adult plants (González & Ayerbe Reference González and Ayerbe2011). In wheat, genotype differences in early growth and turgor pressure were correlated with differences in dry-matter production and grain yield (GY) in the field (Morgan Reference Morgan1988). The relationship between coleoptile growth and GY under drought stress has also been obtained for wheat (Moud & Maghsoudi Reference Moud and Maghsoudi2008). Furthermore, in cowpea, a close correspondence between drought tolerance in the seedling and reproductive stage has been found (Singh et al. Reference Singh, Mai-Kodomi and Terao1999). More recently, Grzesiak et al. (Reference Grzesiak, Marcińska, Janowiak, Rzepka and Hura2012) reported a close correlation between drought tolerances for seedling dry weight and GY in maize and triticale genotypes under field conditions.
The current study focuses on the responses of wheat plants to water stress in the first 3–4 weeks of ontogeny by using high molecular mass polyethylene glycol (PEG). As a screening test (Blum et al. Reference Blum, Sinmena and Ziv1980), PEG has been widely used in wheat to simulate osmotic stress at the early seedling stage in a relatively controlled manner. The objectives of the current research were: (a) to examine the effects of genotype on plant growth response to PEG-induced osmotic stress at the germination and early seedling stage; (b) to identify whether any agronomic traits of adult plants, typically screened in breeding programmes, can be useful to select for increased seed germination and seedling growth under water deficit conditions or vice versa; and (c) to explore the relationship between drought tolerance in the seedling and field grown plants under pre- and post-anthesis drought stress.
MATERIALS AND METHODS
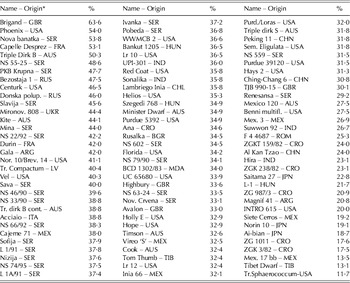
Ninety-six wheat (Triticum aestivum L.) genotypes of worldwide origin, with contrasting expression for some traits of agronomic importance, were chosen to study the effect of low moisture stress at the seedling stage by using PEG (PEG-6000) (Merck Schuchardt OHG, Hohenbrunn, Germany). The idea to test these genotypes in laboratory conditions initially arose from a casual observation of their differences in the number of emerged plants in a field trial (FT0) sown in mid-October 2002. In FT0 the genotypes experienced low water potential in the soil prior to a seedling's emergence because of a lack of precipitation after sowing. Each genotype was sown in a single 1 m row at 20 cm spacing in three replications, with a sowing rate of 70 seeds of uniform size per row. Plants were grown at the experimental field of the Centre for Agricultural and Technological Research (CATR), Zaječar, Serbia (43°53′N, 22°17′E; 144 m asl). The soil type was Vertosol, with 2·9% organic matter and pH 5·9. The average percentage of emerged plants (number of sown kernels/number of emerged plants, counted over several non-consecutive days when the weather allowed up to the beginning of December) for the 96 genotypes, along with their names and origins, are presented in Table 1.
Name and country of origin of the 96 wheat genotypes ranked in the descending order according to the percentage of emerged plants (%) in a field trial exposed to low soil water potential prior to seedling establishment

* Country code from the UN website.
For laboratory testing, good quality seeds free of any visible damage were sourced from main stems of irrigated field-grown plants for each genotype. Similar seed sizes (graded over a 2·5 mm sieve) and weights of single seeds (40–50 mg) were selected to exclude these effects on seedling establishment. Dormancy can be present in wheat more or less immediately after harvest, depending on environmental conditions during ripening, but this has disappeared after 6 months (and in most cases after just 3 months) and, to some extent, dormancy can be genotype-dependent. Therefore, since the current set included various genotypes from all around the world, all seeds from each genotype were aged at least 6 months to avoid any post-harvest dormancy. The selected seeds were surface-sterilized to protect from mycosis in the experiments. The seeds were first treated with commercial bleach (4% NaOCl) with added commercial detergent (‘Fairy’ washing-up liquid, Procter & Gamble, London, UK) for 60 min and then with 0·1% mercuric chloride solution for 10 min. After sterilization the seeds were washed several times with distilled water. For germination, 15 seeds of each genotype were then placed on two layers of Whatman No. 1 filter paper under an osmotic potential of 0·0 (LT1, distilled water, control) and −0·4 MPa (LT2), which was created using a PEG-6000 solution as per the method described by Michel & Kaufman (Reference Michel and Kaufmann1973). The seeds were put on filter paper with a seed-to-seed distance of 1·5 cm in transparent plastic bags and placed in a growth chamber for 10 and 25 days for LT1 and LT2, respectively, as genotypic differences became more prominent with longer periods of water stress. The filter paper was initially moistened (5 ml) with either distilled water or PEG solution, and then kept moist with the addition of equal quantities (5 ml) of distilled water or PEG at day 5 for water, and days 10 and 20 for PEG treatments. The plastic bags were maintained vertically at a constant temperature of 21±1 °C in the dark for 3 days, followed by 7 (LT1) and 22 (LT2) days in a 12/12 h light/dark regime. The genotypes were tested after 6 months from harvest in 2003 and 2004 in completely randomized design with three replicate bags of each treatment.
Data were recorded for the following characteristics: percentage germination (GER), mean germination time (MGT) in days, coleoptile length (COL) in mm, shoot length (SHL; coleoptile+the first leaf from the coleoptile) in mm and shoot growth rate (SGR) in mm/day/seedling. Germination was recorded when the radicle and plumule reached at least 2 mm in length. Seeds with an emerged radicle were considered as viable but not germinated, while those with no emerged radicle and/or plumule were considered as non-viable and hence excluded from germination calculations. In order to measure MGT (Ellis & Roberts Reference Ellis and Roberts1981), the counting of germinated seeds was done on a daily basis. Coleoptile lengths were determined as the distance from the scutellum to the tip of the coleoptile. The SHL was determined as the distance from the scutellum to the tip of the primary leaf when it had emerged from the coleoptile; otherwise the SHL was assumed to be equal to the COL. Data for coleoptile and SHL and shoot growth were obtained from the 10 longest seedlings (total coleoptile+SHL) in each replication.
The data for the adult plants of the 96 genotypes used in the current work for correlation analyses are mean values from 3-year (FT1) and 2-year (FT2) field experiments conducted at CATR, with plants grown under pre- and post-anthesis drought stress conditions, respectively. In FT1, 96 genotypes were evaluated under a fully irrigated and rain-out plot shelter. Irrigated plots were watered manually when water in the top 75 cm of soil declined to less than 55% of field capacity, i.e. 21% of soil moisture. The rain-out plot shelter was erected above the experimental plots at the end of the winter period when most of the genotypes were at the tillering stage (typically early March) and it remained over the plots until crop maturity. The plot shelter kept the rain off the plots from the tillering stage until maturity. Control plots received no water other than rainfall. The drought plot was provided with a 1-m-deep ditch around the edge to prevent rain from seeping into the plot. In FT2, 96 wheats were tested for their capacity to maintain grain filling under drought conditions simulated by cutting off all leaf blades at around 10 days after anthesis (growth stage (GS) 62; Zadoks et al. Reference Zadoks, Chang and Konzak1974). Previous research (Regan et al. Reference Regan, Whan and Turner1993) has shown that eliminating leaf photosynthetic activity after anthesis by artificial desiccation can simulate post-anthesis drought stress. It was found that spike photosynthesis and increased photoassimilate partitioning towards grain were responsible for sustained grain growth when all leaves were removed at the anthesis stage (Iqbal et al. Reference Iqbal, Masood and Khan2012). Control plants were left intact. More about the FT1 trial can be found in Dodig et al. (Reference Dodig, Zorić, Kobiljski, Šurlan-Momirović and Quarrie2010) while details of the FT2 trial are mainly unpublished, although some information can be found in Dodig et al. (Reference Dodig, Barnes, Kobiljski and Quarrie2011). To better characterize the field trials due to drought stress, the stress intensity (SI) was calculated. The SI is defined as [1−(Xs)/(Xns)] where Xs and Xns represent the mean trait value across all genotypes evaluated under stressed and non-stressed conditions (Fischer & Maurer Reference Fischer and Maurer1978).
In FT1 and FT2 trial plants were scored for more than 25 morphological, developmental and productive traits including: early vigour (EV), days to heading (DTH), days from heading to flowering (DHF), stem height (SH), peduncle length (PL), peduncle extrusion (PE), fertile tillers/plant (FTP), flag leaf chlorophyll content (CHL), flag leaf area (FLA), flag leaf area duration (FLD), spike index (SI), number of sterile spikelets/spike (SSS), number of kernels/spikelet (KPS), thousand grain weight (TGW), hectolitre weight (HW), above ground biomass/plant (BPP), harvest index (HI), grain filling rate (GFR), grain weight/spike (GWS) and GY. Early vigour was assessed visually at the 6–7 leaf stage (GS 15–16; Zadoks et al. Reference Zadoks, Chang and Konzak1974) on a scale of 1 to 5, with 5 being the most vigorous. Days to heading was recorded as the number of days after 31 December when spikes were fully emerged from half of the plants in a plot. Days to flowering (anthers exerted from the spikelets) was recorded as the number of days after 31 December when half of the spikes within a given plot were at this stage. Flag leaf area duration was scored at 2 weeks after anthesis (0–5, 0=completely green). Stem height (cm, from the soil surface to the base of spike), PL (cm, from the last node to the base of spike), PE (cm, from the ligule of flag leaf to the base of spike), CHL of flag leaves (SPAD units recorded by a hand-held chlorophyll meter, Minolta, Japan) and the FLA (cm2, leaf width×leaf length×0·75) were measured on 20 randomly selected main stems at anthesis in every plot. Fertile tillers/plant (spike number/row divided by plant number/row) were recorded at maturity. Twenty main tillers were harvested randomly from each plot to measure the number of SSS, number of kernels/spike, SI (kernel weight divided by total spike weight) and GFR (mg/day/grain, only in FT2). The GFR was estimated as grain weight at maturity divided by duration (in days), assuming that grain weight is zero at anthesis. The remaining plants in each plot were harvested to determine TGW (g), HW (kg/hl, only in FT2), GWS (g, grain weight/plot divided by number of spikes/plot), above-ground BPP (g), HI and GY (calculated as t/ha).
To study the correspondence between stress tolerance in the seedling and reproductive stages of wheat plants, three stress indices for the seedling traits and GY in FT1 and FT2 were calculated based on mean trait values obtained under stress and the corresponding trait values under non-stress control conditions. A measure of drought tolerance (TOL) was obtained using the following relationship: TOL=Tns−Ts, where Tns is the trait value under non-stress conditions and Ts is the trait value under stress (Rosielle & Hamblin Reference Rosielle and Hamblin1981). The smaller the value of TOL, the greater the stress tolerance. A stress susceptibility index (SSI) was calculated using the procedure of Fischer & Maurer (Reference Fischer and Maurer1978). This was expressed by the following relationship: SSI=[1−(Ts)/(Tns)]/SI. Smaller values of SSI indicate greater tolerance to stress. A stress tolerance index (STI) was calculated using the following relationship: STI=(Tns×Ts)/(Xns)2 (Fernandez Reference Fernandez and Kuo1992). Higher values of STI indicate a greater tolerance to stress.
Statistical analyses
Summary statistics were calculated to describe the variation of the measured traits across all genotypes. The association among the traits was analysed by employing the biplot methodology as outlined in Yan & Kang (Reference Yan and Kang2003). A trait metric preserving scaling method was used prior to construction of the biplots. Following the biplot approach, Spearman non-parametric correlations were computed among all traits studied. All data analyses and visualizations were accomplished within the R environment (R Development Core Team 2013; http://www.r-project.org).
RESULTS
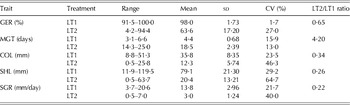
The analysis of variance indicated the presence of a considerable amount of genetic variability for all of the characters under both normal (LT1) and osmotic stress (LT2) conditions, except for GER in LT1 (data not shown). As expected, the expression of mean performance for GER and growth parameters (COL, SHL and SGR) was higher under LT1 than LT2 conditions (Table 2).
Descriptive statistics for germination % (GER), mean germination time (MGT), coleoptile length (COL), shoot length (SHL) and shoot growth rate (SGR) for 96 genotypes under osmotic stress (LT2) compared with normal conditions (LT1) (averaged over 2 years)

sd, standard deviations; CV, coefficient of variation.
The highest percentage of reduction was seen for SGR (78%), followed by SHL (74%), COL (66%) and GER (35%). The MGT was prolonged for more than 14 days in LT2 compared to LT1 (Table 2). The coefficients of variation (CV) for all traits, except MGT, were higher under LT2 than LT1. The majority of the traits showed a relatively high variation (CV>20%) under both treatments. The highest CV had SHL in LT2 (64·7%) while the lowest had a GER in LT1 (1·7%). Germination under laboratory stress conditions (LT2) ranged from 4·2 to 94·4%, compared to 11·7–63·6% under field water deficit conditions (FT0) (Table 1).
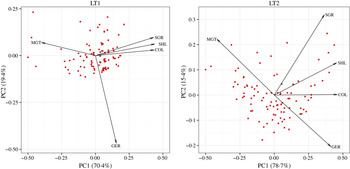
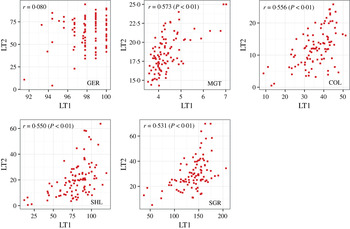
Genotype×trait biplots are used to visualize similarities/dissimilarities of the interrelationships among seedling traits in each treatment (Fig. 1). The biplots were based on the first two principal components derived from subjecting the standardized genotype-by-trait table. The biplot for LT1 and LT2 treatment explained a high proportion of the total variation of a two-way table (89·8 and 94·1%, respectively). In both treatments there was a high positive correlation among COL, SHL and SGR, as indicated by the small acute angle between their vectors. Also in both treatments, those three growth parameters were highly negatively correlated with MGT, as indicated by the obtuse angles between their vectors. Germination had high positive correlation with COL, SHL and SGR, and high negative correlation with MGT in LT2. However, in LT1 GER showed near zero correlation with those traits, as indicated by their nearly perpendicular vectors. The Spearman's correlation coefficients between stress treatments for the seedling traits are presented in Fig. 2. There was a moderate association (0·500–0·600) between the LT1 and LT2 treatments for MGT, COL, SHL and SGR (all P<0·001). However, the Spearman's rank correlation for GER between stress and non-stress conditions was very weak (r=0·080) and not significant. However, there appears to be a relatively weak (r=0·303) yet significant (P<0·01) positive correlation between germination observed in FT0 and LT2. This was not true in the case of the correlation between germination in FT0 and LT1, which were very weak and not significant (r=0·036).
(Colour online). Vector view of genotype-by-trait biplot showing interrelationship among seedling traits under non-stress (LT1) and water stress (LT2) conditions in the laboratory. GER, germination percentage; MGT, mean germination time in days; COL, coleoptile length; SHL, shoot length; SGR, shoot growth rate.

(Colour online). Spearman rank correlation coefficient (r) and scatter graphs showing relationship between seedling traits under non-stress (LT1) and water stress (LT2) conditions (averaged over 2 years). GER=germination percentage, MGT=mean germination time, COL=coleoptile length, SHL=shoot length, SGR=shoot growth rate.

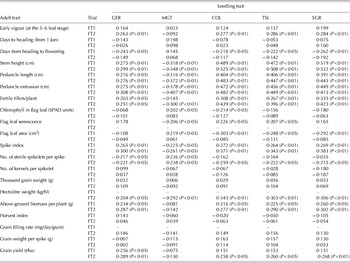
Initially, data were used for 26 morphological, developmental and productive traits of adult plants grown in the field under pre- (FT1) and post-anthesis (FT2) drought stress to correlate with the five seedling traits measured under laboratory water stress (LT1) or non-stress (LT2) conditions. Out of the 26 traits, 20 showed significant Spearman's rank correlation with at least one of the seedling traits either under LT1 or LT2 (Table 3).
The Spearman's rank correlations between seedling traits under water stress in the laboratory and adult traits under pre-anthesis (FT1) and post-anthesis (FT2) water stress under field conditions

GER, germination percentage; MGT, mean germination time; COL, coleoptile length; SHL, shoot length; SGR, shoot growth rate.
Most of the significant correlations were weak (0·200–0·399) or moderate (0·400–0·599). In general, lower correlations were obtained between adult traits and seedling traits under LT2 than LT1 conditions. All seedling traits under LT2 were significantly correlated with SH, PL, PE, FTP, SI, SSS and HW either in FT1 and/or FT2. These correlations were positive except for MGT, which were all negative. Several traits, including DTH, KPS, HI, GWS and GFR were found to be related with seedling traits in LT1 but not in LT2. The opposite was true only for DHF. For adult traits, such as growth habit, spike length, spike density, fertile spikelets per spike, kernels per spike and leaf senescence at anthesis, there was no observable effect on seed germination or early seedling growth under both LT1 and LT2 conditions.
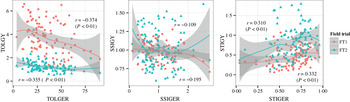
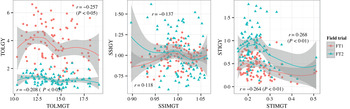
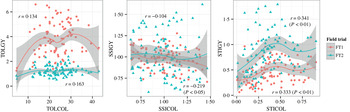
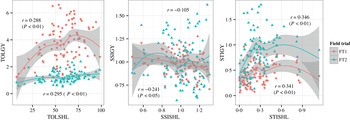
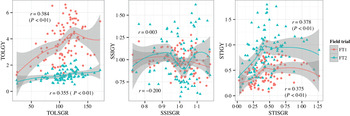
The three STIs, TOL, SSI and STI, were defined for the seedling traits and GY in field trials as the ratio between the mean trait value obtained under stress and the corresponding trait value under control conditions. The rank correlations between STIs based on the seedling traits and corresponding STIs based on GY in FT1 and FT2 are presented in Figs 3–7. The ranking of the 96 wheat genotypes based on STI from GER, MGT, COL, SHL and SGR showed a significant correlation with their ranking based on STI from GY in FT1 and FT2. The correlation coefficients were positive (except between STI from MGT and STI from GY in FT1 and FT2, which were negative) and not so strong (0·261–0·378). Except for TOL from COL, the ranking of the 96 wheat genotypes based on TOL from the seedling traits showed to be significantly correlated with their ranking based on TOL from GY in FT1 and FT2. The significant correlations were weak (0·202–0·384) with either positive (between TOL from SHL and SGR and TOL from GY in FT1 and FT2) or negative (between TOL from GER and MGT and TOL from GY in FT1 and FT2) direction. Only two rank correlation coefficients between SSI obtained from laboratory and field experiments were significant (between SSI from COL and SHL and SSI from GY in FT1). Interestingly, both were negative.
DISCUSSION
The current paper focuses on the responses of wheat plants to water stress in a laboratory environment during 25 days after sowing in PEG solution, and how it closely corresponds between drought tolerance in the seedlings and adult plants in the reproductive stage under field conditions. Initially, three different PEG concentrations were used (equivalent to water potentials of −0·2, −0·4 and −0·6 MPa) to reveal the differences in germination and seedling growth of 96 wheat genotypes with a contrasting expression for a number of agronomic traits (Kobiljski et al. Reference Kobiljski, Quarrie, Denčić, Kirby and Ivegeš2002). The results showed that the effect of drought stress at −0·4 MPa was most informative for differentiating between the genotypes for the studied seedling traits. The idea of detecting variability for seedling traits in 96 genotypes initially arose from a casual observation of differences in their seedlings emergence under low water potential in the soil after autumn sowing. Under field conditions, there was the possibility of variable quantity and spatial distribution of soil water. However, relatively weak yet significant rank correlations between the emergence of 96 wheat varieties under water stress in the field and their seedling germination and growth under PEG-induced drought stress was obtained. This suggests that laboratory seedling testing under PEG-induced water stress is a potential predictor of seed establishment under natural drought conditions.
As expected, all seedling traits recorded across 96 genotypes in the LT2 treatment were lower than in LT1, except for MGT which was increased. A comparison of mean performance under LT1 and LT2 conditions indicated that SGR was the most sensitive trait, followed by SHL and COL. In general, GER was less sensitive to water stress than seedling growth traits (c. 2·5–3·0-fold) and particularly MGT (over 6-fold). These observations generally agree with observations made by other authors. It is reported that plumule elongation of the cell expanding growth was more sensitive to water stress than germination (Xiping et al. Reference Xiping, Lun and Shinobu1999). In wheat, Dhanda et al. (Reference Dhanda, Sethi and Behl2004) also showed that SHL was more affected by osmotic stress than germination percentage and root length. It seems that seedling survival under water stress was not directly related to the ability of seeds to germinate under stress (Qi & Redmann Reference Qi and Redmann1993). In the current study, there were positive correlations between GER and seedling growth traits (COL and SHL) and negative correlations between GER and MGT in LT2. In LT1, GER was not correlated with any of the other seedling traits possibly because of a very low phenotypic variation for germination under optimal water supply.
The coefficient of variation for all traits, except MGT, was much higher in LT2 than in LT1, indicating a higher variability under stress conditions. Usually, severe drought stress reduces the magnitude of genetic components of variance and heritability as compared to non-stress conditions (Blum Reference Blum1988). However, moderate intensity of drought stress allows for an increase in the range of trait mean values under drought stress conditions compared to well-watered conditions (Tuberosa et al. Reference Tuberosa, Sanguineti, Landi, Giuliani, Salvi and Conti2002). The ranking of the studied genotypes based on their value in LT1 was rather consistent, except for GER, with the ranking based on their value in LT2. This implies that the selection of genotypes with a maximum expression of genetic potential for seedling growth traits in the absence of stress can still sustain a significant trait improvement under moderate drought. It is also believed for yield that its potential has a large effect on yield only under moderate drought stress, before stress is severe enough to induce genotype by environment interaction (Blum Reference Blum1996; Pantuwan et al. Reference Pantuwan, Fukai, Cooper, Rajatasereekul and O'Toole2002).
In order to determine which of the most commonly measured adult plant traits are related to germination and early growth of wheat, or vice versa, Spearman's rank correlation analysis was performed between seedling traits tested in the laboratory and morphological, developmental and productive traits measured in the two field trials. The SI values based on GY in FT1 and FT2 were 0·652 and 0·208, respectively, indicating severe and moderate stress levels. So it is assumed that in FT1, stress imposed before anthesis and later, i.e. pre-terminal stress, occurred under severe drought conditions while in FT2, stress imposed during grain filling, i.e. terminal stress occurred under moderate drought conditions. Not surprisingly, all seedling traits showed the highest correlation with SH and stem-related traits (PL and PE), regardless of stress treatment (LT1, LT2) and field trial (FT1, FT2). Taller plants tend to have longer COL and SHL, higher SGR and GER but lower MGT.
The relationship between wheat plant height and seedling traits, particularly length of coleoptile, is well documented in other studies (Rebetzke et al. Reference Rebetzke, Ellis, Bonnett and Richards2007; Landjeva et al. Reference Landjeva, Korzun, Stoimenova, Truberg, Ganeva and Börner2008; Rosyara et al. Reference Rosyara, Ghimire, Subedi and Sharma2009). Shorter coleoptiles and poor emergence have commonly been associated with the presence of the Rht-B1b (previously known as Rht1) and Rht-D1b (previously known as Rht2) dwarfing genes (Matsui et al. Reference Matsui, Inanaga, Shimotashiro, An and Sugimoto2002). Although plant height was reduced universally through wheat breeding during the 20th century due to the introgression of semi-dwarf genes (Calderini et al. Reference Calderini, Reynolds, Slafer, Satorre and Slafer1999; Royo et al. Reference Royo, Álvaro, Martos, Ramdani, Isidro, Villegas and García Del Moral2007), semi-dwarf wheats have not replaced older, taller wheats in all areas (e.g. in Australia). As was shown by Butler et al. (Reference Butler, Byrne, Mohammadi, Chapman and Haley2005), taller wheats maintained their higher yield level under post-anthesis drought. Taller genotypes have a greater capacity to support grain-filling from stem reserves because of their greater storage potential (Blum Reference Blum1998). The Rht-B1b and Rht-D1b dwarfing genes of wheat were found to reduce reserve storage by 35 and 39%, respectively, as a consequence of a 21% reduction in stem length (Borrell et al. Reference Borrell, Incoll and Dalling1993). The current findings generally agree with observations made by the above authors. Namely, although there was a positive correlation with SH under both pre-terminal and terminal stress for growth, the relationship between seedling traits and GY under drought stress is only significant under terminal stress. This suggests that the selection for higher COL, SHL and SGR will benefit GY (via SH) more under post- than pre-anthesis stress. Because seedling traits can be related to grain filling under stress, this also suggests positive significant correlations with HW, which is an indicator of how well grains are filled and is strongly impacted by unfavourable soil and climate.
Early genotype differences under drought stress were also significantly related to differences of adult plants in FTP, SI, SSS and BPP under pre- and post-anthesis. Among these traits FTP generally showed the highest correlation with the seedling traits in LT2, but in LT1 FTP was only correlated with SHL. Thus selecting genotypes with better seedling traits under drought stress should contribute to a better yield under pre- and post-anthesis stress via FTP as a direct component of GY. Although wheats with reduced tillering capacity have been proposed for areas regularly subject to a terminal drought (Duggan et al. Reference Duggan, Richards and Van Herwaarden2005), based on the set of 96 genotypes investigated in the current paper there was a significant correlation between FTP and GY in FT2. However, Jones et al. (Reference Jones, Keane and Osborne1998) showed that spring bread wheats with alien cytoplasms (alloplasmic lines) had in several cases better light interception associated with higher tiller production and larger leaves. Under low input conditions this resulted in an increased yield of up to 20%, coupled with a reduction of weed biomass at crop maturity of 39% for the best alloplasmic line. Crop ground cover is the result of a range of individual plant characteristics, such as growth habit, tillering capacity, rapid early growth and plant height (Kruepl et al. Reference Kruepl, Hoad, Davies, Bertholdsson, Paolini, Donner and Osman2006). Out of these traits only growth habit showed no correlation with seedling traits in the current study. Tillers also may play a central role in the recovery from early season drought (Blum et al. Reference Blum, Ramaiah, Kanemasu and Paulsen1990).
The assessment of the degree of drought tolerance of different genotypes is a crucial aspect in all studies dedicated to plant water relationships (Mastrangelo et al. Reference Mastrangelo, Mazzucotelli, Guerra, De Vita, Cattivelli, Venkateswarlu, Shanker, Shanker and Maheswari2012). There is also a need for the laboratory testing method to be characterized by a significant correlation with drought tolerance observed under field conditions (Grzesiak et al. Reference Grzesiak, Marcińska, Janowiak, Rzepka and Hura2012). A drought tolerant genotype can usefully be defined as one which gives a significantly higher yield or other reference trait than average under conditions where crop water availability is limited by some aspect of the environment. Voltas et al. (Reference Voltas, Lopez-Corcoles and Borras2005) have suggested that yield performance over a range of environments should be used as the main indicator for drought tolerance when a physiological parameter as a reliable indicator of yield under dry conditions is not easy to identify. To differentiate drought tolerant genotypes, several criteria have been suggested on the basis of yield performance of a given genotype under stress and non-stress conditions or in comparison with the average yield or the yield of a superior genotype. The current study used an SSI and an STI in order to determine drought tolerance of the 96 genotypes for the seedling traits. For GY under field conditions three drought indices were used, i.e. TOL, SSI and STI. Rosielle & Hamblin (Reference Rosielle and Hamblin1981) defined TOL as the difference in yield between the stress and non-stress environments. Fischer & Maurer (Reference Fischer and Maurer1978) proposed SSI as a measure of drought tolerance in terms of minimization of the reduction in yield caused by unfavourable compared with favourable environments. Both selections based on TOL and on SSI favour stress-tolerant genotypes with low yield potential (Fernandez Reference Fernandez and Kuo1992). However, STI has been suggested to identify genotypes that produce high yield under both stress and non-stress conditions (Fernandez Reference Fernandez and Kuo1992).
All correlations between STI for the seedling traits and STI for GY in FT1 and FT2 were moderate but highly significant (P<0·01). In other words, the ranking of the 96 genotypes based on their stress tolerance and potential of the seedling traits was rather consistent with the ranking based on stress tolerance and yield potential of adult plants under pre- and post-anthesis drought stress. Associations between TOL from seedling growth traits (SHL and SGR) and TOL based on GY in LT1 and LT2 were also positive and highly significant (P<0·01). Tolerance index (TOL) from germination-based traits had significantly negative correlations with TOL from GY in LT1 and LT2. But in a case of MGT this actually means a shorter delay in germination under water stress which was related to better drought tolerance of adult plants based on GY. Hence, findings in the current study indicate that genetically conditioned drought tolerance could be similar for plants in the seedling and reproductive GSs or may at least partly have a common genetic background. However, the obtained rank correlations between SSI for the seedling traits and SSI for GY in FT1 and FT2 were mostly non-significant. Only in two cases were the rank correlations between SSI for young and adult plant traits significant (P<0·05), but were classified as weak and even negative. In other words, selecting genotypes based on the seedling traits with high drought tolerance will result in adult plants with low drought tolerance based on GY, at least under more severe (pre-anthesis) stress. Higher STI- and TOL-based rank correlations compared to SSI-based ones, as well as their more consistent appearance across the seedling traits and levels of stress in the field indicate STI and TOL to be better criterion to choose genotypes with higher drought tolerance both in the seedling and reproductive stages of growth. Several authors suggested TOL to be a useful indicator for cereal breeding where the stress is severe (Rizza et al. Reference Rizza, Badeck, Cattivelli, Lidestri, Di Fonzo and Stanca2004; Dodig et al. Reference Dodig, Zorić, Knežević, King and Šurlan-Momirović2008), while STI is suggested if the stress is less severe (Sio-Se Mardeh et al. Reference Sio-Se Mardeh, Ahmadi, Poustini and Mohammadi2006; Talebi et al. Reference Talebi, Fayaz and Naji2009). Moreover, the STI index can be used to choose genotypes in the seedling stage for a better yield of adult plants under a range of stress and non-stress environments. Previous studies, not only in wheat (González & Ayerbe Reference González and Ayerbe2011) but also in other cereals such as barley (Moud & Maghsoudi Reference Moud and Maghsoudi2008), triticale (Grzesiak et al. Reference Grzesiak, Marcińska, Janowiak, Rzepka and Hura2012) and maize (Grzesiak et al. Reference Grzesiak, Marcińska, Janowiak, Rzepka and Hura2012), showed that seedling growth subjected to water deficit could be used as an indicator of drought tolerance in adult plants under field conditions. Furthermore, Tuberosa et al. (Reference Tuberosa, Sanguineti, Landi, Giuliani, Salvi and Conti2002) indicated the feasibility of using hydroponics in maize to identify QTL regions controlling root traits at an early GS and also influencing GY in the field.
In conclusion, statistically significant differences among the studied genotypes exposed to drought stress were observed in the case of germination percentage, MGT, COL, SHL and SGR. Generally, growth-related seedling traits showed more often and slightly higher significant correlations with agronomic traits compared to germination-related traits. But in the case of GY, growth-related traits under PEG-induced stress were associated with GY in the field only under moderate (post-anthesis) drought stress. Nevertheless, stress indices based on GY and the seedling traits indicate that in the examined genotypes there exists a close correspondence between drought tolerance in the seedling and reproductive stage, although it is shown that it depends on the choice of evaluation criteria. Thus in the current study, the STI appeared to be the most promising in predicting drought tolerance based on GY in the field from a seedling's performance in a laboratory environment, or vice versa. It should be noted that STI identify genotypes that produce high yield under both (moderate) stress and non-stress conditions and due to complexity of drought tolerance and variability in the nature and occurrence of drought stress it is necessary to take into consideration various tolerance evaluation criteria in the breeding process.
(Colour online). Spearman rank correlation coefficient (r) and scatter graphs showing relationship between stress tolerance indexes based on germination percentage (GER) in the laboratory and stress tolerance indexes based on grain yield under pre- and post-anthesis drought stress under field conditions (FT1 and FT2, respectively). TOL=tolerance index, SSI=stress susceptibility index, STI=stress tolerance index. Relationship among variables was fitted by non-parametric LOESS regression.

(Colour online). Spearman rank correlation coefficient (r) and scatter graphs showing relationship between stress tolerance indexes based on mean germination time (MGT) in the laboratory and stress tolerance indexes based on grain yield under pre- and post-anthesis drought stress in field conditions (FT1 and FT2, respectively). TOL=tolerance index, SSI=stress susceptibility index, STI=stress tolerance index. Relationship among variables was fitted by non-parametric LOESS regression.

(Colour online). Spearman rank correlation coefficient (r) and scatter graphs showing relationship between stress tolerance indexes based on coleoptile length (COL) in the laboratory and stress tolerance indexes based on grain yield under pre- and post-anthesis drought stress in field conditions (FT1 and FT2, respectively). TOL=tolerance index, SSI=stress susceptibility index, STI=stress tolerance index. Relationship among variables was fitted by non-parametric LOESS regression.

(Colour online). Spearman rank correlation coefficient (r) and scatter graphs showing relationship between stress tolerance indexes based on shoot length (SHL) in the laboratory and stress tolerance indexes based on grain yield under pre- and post-anthesis drought stress under field conditions (FT1 and FT2, respectively). TOL=tolerance index, SSI=stress susceptibility index, STI=stress tolerance index. Relationship among variables was fitted by non-parametric LOESS regression.

(Colour online). Spearman rank correlation coefficient (r) and scatter graphs showing relationship between stress tolerance indexes based on shoot growth rate (SGR) in the laboratory and stress tolerance indexes based on grain yield under pre- and post-anthesis drought stress in field conditions (FT1 and FT2, respectively). TOL=tolerance index, SSI=stress susceptibility index, STI=stress tolerance index. Relationship among variables was fitted by non-parametric LOESS regression.

The authors would like to thank Boris Kobiljski (Institute for Field and Vegetables Crops, Novi Sad, Serbia) for providing wheat genotypes used in this study. We also thank Mrs Nancy Borchetta for her help with English grammar and vocabulary. This work was supported by the Ministry of Education and Science of the Republic of Serbia (Grant No. TR31005).
The research was carried out in the Centre for Agricultural and Technological Research, Zajecar, Serbia.