


Introduction
Late-glacial glaciers may provide valuable quantitative information about the climate during their existence (Reference Maisch, Haeberli and GamperMaisch and Haeberli, 1982; Reference KerschnerKerschner, 1985; Reference MaischMaisch, 1987). If their surface geometry can be reconstructed with a reasonable degree of accuracy, it is possible to derive various glaciological parameters which can be interpreted climatically (e.g. Reference Maisch, Haeberli and GamperMaisch and Haeberli, 1982; Reference Haeberli and PenzHaeberli and Penz, 1985). Among these parameters are the past equilibrium-line altitude (ELA), ELA depression (ΔELA), basal shear stress (T) and mass balance gradients (δb/δz). In this paper, the former glacier at the type locality of the “Gschnitz Stadial” of the Alpine Late glacial chronology is interpreted from a paleoglaciological and paleoclimatological point of view. It may give some valuable insight into the climatic conditions in the Alps during an early phase of the Alpine Late-glacial, for which paleoclimatic proxy information from other sources (e.g. lake sediments, pollen analysis) is largely absent.
The complex of lateral and end moraines in the Gschnitz valley, near the village of Trins (Reference PichlerPichler, 1859; Reference Kerner von MarilaunKerner von Marilaun, 1890), about 30 km to the southwest of Innsbruck (Fig. 1) was chosen by Reference Penck and BrücknerPenck and Brückner (1901/1909) as the type locality of the Gschnitz Stadial of the Alpine Late- glacial chronology. Since then, various authors have studied the glacial geomorphology of the Gschnitz valley (e.g. Reference PaschingerPaschinger, 1952; Reference Mayr, Heuberger and RichmondMayr and Heuberger, 1968), defining and redefining the Late-glacial chronology of the eastern Alps in general and that of the Gschnitz valley in particular (cf. Reference KerschnerKerschner, 1986). Today, the moraine at Trins is again considered the type locality of the Gschnitz Stadial (Reference Mayr, Heuberger and RichmondMayr and Heuberger, 1968; Reference Patzelt and SchirmerPatzelt and Sarnthein, 1995).
Location of Gschnitz valley (G) in the central Alps.

Moraines of the Gschnitz Stadial, as presently defined, have been found elsewhere in the Alps (e.g. Reference Mayr, Heuberger and RichmondMayr and Heuberger, 1968; Reference Patzelt, Fliri and LeidlmairPatzelt, 1975; Reference Gross, Kerschnerand and PatzeltGross and others, 1977; Reference Van HusenVan Husen, 1977; Reference MaischMaisch, 1987). Minimum radiocarbon ages suggest they were deposited during the Oldest Dryas. They show that large parts of the central Alps were already ice- free and only covered by local glaciers some time before the beginning of the Late-glacial Interstadial (Bølling— Allerød). No reasonable minimum ages could be obtained for the type locality, but recent surface-exposure dating (10Be, 26Al) of the end moraine (Reference Ivy-Ochs, Kerschner, Kubik, Synal, Patzelt and chlüchterIvy-Ochs and others, 1997; see Reference Ivy-Ochs, Schlüchter, Kubik, Synal, Beer and KerschnerIvy-Ochs and others 1996, Reference Ivy-Ochs1998 for the sampling and dating methodology) suggests a preliminary age of about 15 kyr BP for its deposition.
Geomorphology
A prominent end moraine occurs in the Gschnitz valley close to the village of Trins at an altitude of 1200 m a.s.l., marking the end of a former local glacier. The lateral moraines are well preserved on both sides of the valley (cf. Reference Kerner von MarilaunKerner von Marilaun, 1890; Reference PaschingerPaschinger, 1952) for a distance of more than 3 km up to an altitude of 1410 m. From the morphology of the moraines it can be concluded that the lefthand part of the former glacier tongue, below 1300 m (about 1 % of the glacier surface), was covered with rockfall debris. Above the village of Gschnitz, 6–6.5 km from the end moraine, remnants of moraines at an altitude of 1520–1540 m can be traced to the lateral moraines downvalley.
The valley is almost straight and its width varies only slightly for the entire length of the former glacier tongue (about 12.5–13 km). The lower parts of the valley walls are covered with scree slopes, morainic material and alluvial cones from small tributaries. Wherever bedrock is exposed, the cross-section is almost perfectly parabolic (Fig. 2). Between the end moraine and the present-day end of the public road at Gasthaus Feuerstein, the valley floor rises for 100 m over a distance of 9km (1.1%). From there to Lappones Alm it is somewhat steeper (7.6%). Farther up- valley, a step leads 400–500 m up to the cirque areas, which are presently glacierized (Fig. 3). The surrounding peaks are in the order of 2800–3200 m a.s.l. The comparatively simple morphology of the lower part and the large number of preserved moraines makes the Gschnitz valley well suited for reconstructing a glacier tongue.
Cross-sections of the lower part of Gschnitz valley. Solid lines represent the actual topography, dashed lines the parabolic cross-sections. Letters a—d refer to the position of cross profiles in Figure 3. Surface areas of the parabolic cross profiles are indicated in upper left.

Long profile of the Gschnitz valley and Gschniz Stadial glacier. Thick lines at the glacier tongue and above the village of Gschnitz Preserved moraines. Sc is accumulation area; Sa is ablation area; YD is position of the Egesen Stadial (Younger Dryas) glacier end.

Reconstruction of Glacier Topography
Due to the favourable morphological situation, the surface topography of the glacier tongue can be reconstructed with a high degree of accuracy.
As a first step, the basal shear stresses in the lowest 3 km of the tongue are calculated as

with ρ the density of glacier ice (900 kg m —3), g the acceleration due to gravity (9.81 ms—2), h the thickness of the glacier at its centre-line, a the slope of the glacier surface and f the shape factor for a channel with parabolic cross-section (Reference NyeNye, 1965). h is calculated from the altitude of the moraine crests assuming a parabolic cross-section for the valley (dashed line in Fig. 2). α is calculated from the lateral moraines over a horizontal distance which is five times the glacier thickness. As the glacier tongue becomes steeper upvalley, the basal shear stress rises from about 18 kPa 500 m from the end moraine to 77 kPa 3000 m from the end moraine (Fig. 4).
Basal shear stress at the glacier tongue.

The surface profile between the upper end of the moraines (1410 m a.s.l., km 3.4, Fig. 3) and the point where the bed slope steepens significantly (km 8.3, Fig. 3) was calculated using the theoretical long profile of a glacier tongue (Reference NyeNye, 1952). Under the assumption of steady-state, it relates glacier length (x) and thickness (h), if the difference between bed slope (3) and surface slope (a) is small, as

with h'0= T1 and T1 = T/f. By connecting the lowest points of the parabolic cross- sections, a bed slope of 0.88% can be calculated. With h'0 = 12.8 m, the reconstructed glacier surface passes through the ice-marginal features above the village of Gschnitz. With a shape factor f = 0.68, as deter mined from the topography, this is equivalent to a shear stress of 76.8 kPa, which is similar to the value further downvalley.
In the upper part of the valley, moraines are missing. Here, the glacier received considerable amounts of ice from the large cirque areas at both sides of the valley and from the Sandestal tributary. Hence, it is reasonable to assume the glacier thickness decreased somewhat upvalley (Fig. 3). At the step, which leads up to the cirque areas, the ice thickness was calculated with a shear stress of 400 kPa, as it was typical for the steep part of the Little Ice Age Rhonegletscher (Reference Haeberli and SchweizerHaeberli and Schweizer, 1988). In the cirque areas, which are very wide compared to the ice thickness, a constant shear stress of 100 kPa was used.
With the help of the long profile, the topography of the glacier tongue was drawn with 100 m contour lines up to an altitude of 2200 m. Higher up, no contour lines were drawn as it was quite clear from earlier studies (Reference PaschingerPaschinger, 1952; Reference Gross, Kerschnerand and PatzeltGross and others, 1977) that the ELA of the glacier was situated between 1800 and 2000 m a.s.l. Steep and serrated rock areas in the uppermost part of the glacier were excluded.
Equilibrium-Line Altitude
The ELA of modern and Late-glacial glaciers in the Alps is usually calculated using an accumulation area ratio (AAR) of 0.67. This yields reliable results for glaciers with a typical ‘Alpine” area—altitude distribution with large and comparatively flat surface areas in the vicinity of the equilibrium line (Reference Gross, Kerschnerand and PatzeltGross and others, 1977; Reference Kerschner and LiedtkeKerschner, 1990). In the case of the Gschnitz glacier, the ELA was in the steepest part of the glacier. Therefore, it seemed reasonable to bracket it between AAR values of 0.67 and 0.60 (Fig. 5). The respective ELAs are between 1860 and 1990 m. As a compromise, an AAR of 0.63 and an ELA of 1930 m are chosen for the subsequent calculations. The average Little Ice Age (1850) ELA in the catchment basin was at 2630 m (Reference Gross, Kerschnerand and PatzeltGross and others, 1977), resulting in an ELA depression for the Gschnitz Stadial of —700 m against 1850 values or about —800 m against modern values.
Area-altitude distribution of Gschnitz glacier tongue and ELAs for different AAR values.

Balance Gradients
From the topography of the glacier and its bed, the ice-flux through selected cross-sections and balance gradients along the glacier tongue can be calculated. They are important tools for qualitative and quantitative paleoclimatic interpretations.
To calculate the ice flux, we must first know the mean velocity over a cross-section. If only ice deformation is assumed, the surface velocity us of an infinitely wide parallel-sided slab of ice is

with A as the temperature-dependent parameter (in this case 5 × 10—15 kPa—3s—1 ; Reference PatersonPaterson, 1994) and n = 3 as the exponent in Glen’s flow law. The mean horizontal velocity over a parabolic cross-section u m, p can then be calculated from u s with a correction factor, which depends on the relation between glacier width and ice thickness. This was determined from table IIIA in Reference NyeNye (1965, p.677). Then, the total horizontal velocity due of the glacier is the mean velocity due to ice deformation um, p plus the contribution of basal sliding u b (Table 1). As the amount of basal sliding is unknown, scenarios were calculated with basal sliding contributing 80% and 50% of u t.
Ice thickness (h), surface slope (α), surface velocity (u s), correction factor for a channel with parabolic cross-section (fc), mean velocity for a parabolic cross-section (u m, p) sliding velocity for 80% basal sliding (u b) and total velocity (u t) forselected cross-sections. Letters a—d refer to Figures 2 and 3.

The ice flux Q through a cross-section can be determined by multiplying u t with the area of the cross-section (Fig. 2). From the difference in ice flux ΔQ between two neighbouring cross-sections and the surface area S between them, net ablation can be calculated as ΔQ/S, which finally has to be corrected for water equivalent. The resulting b(z) curves for the glacier tongue are shown in Figure 6. For comparison, the b(z) curves of various other glaciers for years with zero net balance (Reference KuhnKuhn, 1984) are added to Figure 6. Under the assumption of 80% basal sliding, the balance gradient is somewhere in between that of Tsentral’nyy Tuyuksu glacier (Tien Shan) and White Glacier (Canadian Arctic Archipelago), whereas for 50% basal sliding it is rather similar to that of White Glacier. If we (unrealistically) assume there was no basal sliding at all, the balance gradient is even steeper than that of Devon Ice Cap (Canadian Arctic Archipelago). Depending on the amount of basal sliding, the balance gradients δb/δz on the glacier tongue between 1350m and 1550 m a.s.l. vary between —3.55 kg m m—1 (80% basal sliding) and —0.71kg m—2 m—1 (0% basal sliding). These values are typical for glaciers in a cold and continental climate.
Steady-state balance gradients along the glacier tongue of Gschnitz glacier and various other glaciers.

They can be cross-checked with the activity index of a stationary glacier (Reference Kuhn, Herrmann, Baumgartner and LiebscherKuhn and Hermann, 1990, p.307). It relates the balance gradient δb/δz with the length of the glacier tongue X and the maximum velocity in the x direction u x, max as

Assuming a value of 50 m a 1 for u x, max and taking the length of the glacier tongue as 12.8 km (Fig. 3), δb/δz is —3.55 kg m—2 m—1, which is similar to the result obtained for 80% sliding.
Possible Errors
This way of calculating ice discharge and balance gradients is sensitive to various parameters. The influence of the temperature-dependent parameter A is linear. The chosen value of 5 × 10—15 kPa—3s—1 is for ice with a temperature of about —1°C (Reference PatersonPaterson, 1994). Smaller values for colder ice lead to correspondingly lower discharge rates. Values for surface slope a are determined as exactly as possible from the moraines, and, therefore, from topographical maps. Errors in the order of several metres can easily occur during such a procedure. As the surface slope enters the velocity equation with the third power, this may lead finally to a distortion of the b(z) curves. However, the overall shape of the b(z) curve is not altered significantly, even if the assumed errors are larger than necessary (> ±10 m). A systematic error in the determination of the surface slope is unlikely due to the large number of preserved moraines. Errors in the determination of the ice thickness h may also occur. As the actual glacier bed remains unknown, h is determined from the parabolic cross-sections and only speculations can be made about the size of the errors. An error in h not only influences the area of the cross-sections, but also the surface velocity because it enters the velocity equation with the fourth power. On the other hand, the effects of changes in h are somewhat counterbalanced by corresponding changes in the shape factor. Changes in h do not affect the surface topography, as it is largely fixed by the moraines. The results of some calculations with different values of h (±20 m) showed fairly similar results compared to those with changes in a. The b(z) curves were distorted, but the principal shape remained the same. In any case, the balance gradients remain typical for glaciers in a cold and continental climate.
Paleoclimatological Interpretation
This section provides some more quantitative ideas about precipitation and summer temperature during the Gschnitz Stadial. They are to some extent speculative and the figures should not be seen so much as absolute values, but rather as orders of magnitude.
By extrapolating the b(z) curve towards the ELA, we can calculate the total net ablation A n on the glacier tongue. If we assume steady-state, A n must be balanced by total net accumulation C n. Thus we may calculate the mean specific accumulation over the accumulation area S c as c = A n/S c. Even for 80% sliding, calculated values are quite low (Table 2). Only this case, which is already rather “humid” and “warm”, is discussed in more detail below. All other scenarios (lower values for A under the assumption of lower ice temperatures, smaller contributions of basal sliding to the velocity of the glacier) represent drier and colder conditions.
Mean specific accumulation of Gschnitz glacier.
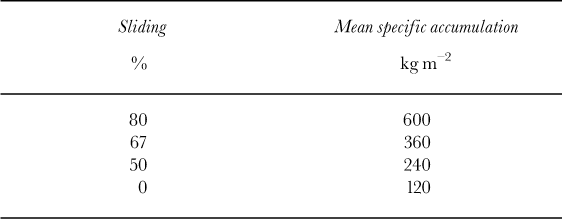
From the data in Reference FliriFliri (1975) we may estimate present-day precipitation (i.e. 1931–1960) at the ELA (about 2730 m) as 1700 mm a 1 and summer (June—August) temperature as 3.3°C. Similar precipitation values can be obtained from the (P, T) relation of Reference Ohmura, Kasser and FunkOhmura and others (1992, p.401). If we assume that accumulation is 1.5 times precipitation (Reference KuhnKuhn, 1981), it should be in the order of 2550 kg m—2 m—1 . Assuming further that the mean specific accumulation during the Gschnitz Stadial is correct at the median altitude of the accumulation area (2580 m), and using an accumulation gradient of 1kg m —1, accumulation at 2730 m was then about 750 kg m—2 (29% of the present accumulation). The change in accumulation was —1800 kg m—2 . We may therefore conclude that accumulation and probably also precipitation during the Gschnitz Stadial was less than one-third of the present-day values.
Inferring temperature change is even more prone to errors. Reference KuhnKuhn’s (1981) glacial—meteorological model should only be used with extreme caution, because ΔELA is large (—800 m) and the results for the summer temperature change Sts are strongly influenced by the (unknown) accumulation gradients, the (unknown) duration of the ablation period, the (unknown) change of the temperature lapse rate, possible (unknown) changes of the short-wave radiation balance and the (unknown) contribution of the latent-heat flux to ablation. Despite these uncertainties, some cautious calculations show that temperatures might have been lowered in the order of—7.5 to —11°C.
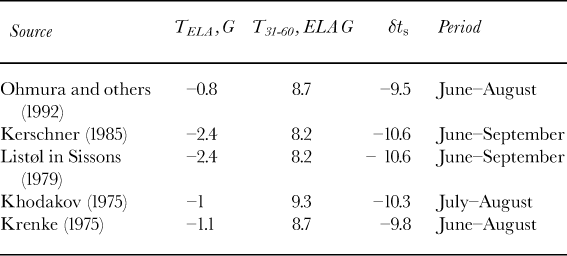
In a different approach, various statistical (P, T) models can be used. The basic assumption is that precipitation at the Gschnitz Stadial ELA was proportionally lowered like accumulation. In that case, precipitation at 1930 m (ELA of the Gschnitz Stadial glacier) during the Gschnitz Stadial is estimated at 400 mm. Then we may calculate the corresponding summer temperature at the ELA from the (P, T) models. Finally, the present-day summer temperature at 1930 m has to be subtracted from the Gschnitz Stadial summer temperature at the ELA to obtain δts. The results are summarized in Table 3. They show that temperature was roughly 9–11°C lower than today with an average value of —10.2°C. This agrees surprisingly well with the results from the glacial—meteorological model. It should be kept in mind though that a summer temperature depression of about —10°C is quite large and should be evaluated in further studies.
Temperature at the ELA of Gschnitz glacier (T ELA, G), present-day temperature (1931–60) at the altitude of the Gschnitz Stadial ELA (T 31-60, ELA G) and changes of summer temperature (δts).
In comparison, climate during the Younger Dryas in the Alps was much warmer (δts —2.5 K to —3 K) and more humid (δP ± 0 to —40%), as can be inferred from timberline and ELA fluctuations in the Austrian and Swiss Alps (e.g. Reference KerschnerKerschner, 1985; Reference Ivy-Ochs, Kerschner, Kubik, Synal, Patzelt and chlüchterIvy-Ochs and others, 1996). During the Gschnitz Stadial, climate more closely resembled full glacial conditions. This strongly supports an early age for the Gschnitz Stadial.
Conclusions
From the above, we may draw some interesting conclusions for paleoclimatological research:
In valleys with simple topography (flat valley bottoms, no significant changes in the geometry of the valley), it is possible to reconstruct the topography of glacier tongues with simple glaciological models to a high degree of accuracy, ifa sufficient number of moraines is preserved to calculate reliable shear stresses.
From the topography of the glacier tongue, it is possible to calculate ice flux through selected cross-sections and mass-balance gradients on the glacier tongue, which give realistic orders of magnitude. In the case of the former Gschnitz glacier, they are similar to those from glaciers in central Asia and the Canadian Arctic, thus indicating a cold and continental climate.
Under the assumption of steady-state, it is possible to estimate net accumulation, and, with some further assumptions, precipitation. Even under the assumption of 80% basal sliding, accumulation and precipitation are calculated at less than one-third of present-day values in that area.
Changes of summer temperature can be inferred with standard glacier—climate models. For earlier parts of the Alpine Late-glacial (i.e. older than the Younger Dryas), statistical models seem to be more robust than glacial— meteorological models, which require too many assumptions. They show that summer temperature was roughly 9–11° lower than today. These results are realistic orders of magnitude.
The paleoclimatic interpretation of balance gradients is independent of non-glacial paleoclimatic information (e.g. from timberline fluctuations). Therefore, it allows quantitative paleoclimatic inferences for earlier periods of the Alpine Late-glacial, for which such information is unavailable.
Acknowledgements
We sincerely thank G. Patzelt (Institut für Hochgebirgs-forschung, Innsbruck) and G. Kaser (Institut fur Geographie, Innsbruck) for reading the manuscript critically and for many valuable suggestions. The comments of two reviewers (N. Hulton and A. Mackintosh) were most helpful during the final stages of the manuscript. The project was partly supported by the Swiss National Science Foundation under grant No. 21-043469.95/1. This support is most formally acknowledged.



