I. INTRODUCTION
We have developed methods for producing large quantities of silicon (Si) and germanium (Ge) nanowires,Reference Hanrath and Korgel1–Reference Tuan and Korgel4 and in the process of manipulating these materials for various applications, we have observed that both Si and Ge nanowires can accumulate a significant amount of electrostatic surface charge. This static charge can be a nuisance. On a day with low humidity, nanowires in a vial can dance around erratically when any surface with static charge—a spatula, tweezers, a gloved hand, or even a bench top—comes near them, making handling difficult. Even nanowires in a solvent can respond dramatically to nearby surfaces that have accumulated static charge. Because the nanowires have an extremely high amount of surface area, they can accumulate large quantities of surface charge.
Static charging is known to make handling of particulate materials difficult, and sometimes dangerous. For example, charge accumulation can be a problem in food and chemical industries that store, process, and transport particulate powders, creating the potential for an electrostatic discharge that can cause the powder to explode.Reference Abbasi and Abbasi5 These hazards are not limited to particulate powders, as low-conductivity liquids can also accumulate large quantities of static charge while flowing or being mechanically agitated.Reference Gibson and Lloyd6, Reference Glor7 Static charge can also damage electronic devices if not controlled. On the other hand, static charge can be harnessed for useful processes, such as electrostatic printing. The xerographic process, for example, combines photography with the ability to manipulate the static charge of pigment particles and paper. Herein, we show how dramatic the effects of electrostatic charging can be on semiconductor nanowires and then demonstrate ways of manipulating nanowires using electric fields, enabling the deposition of high densities of nanowires onto selective regions of a substrate.
II. EXPERIMENTAL
Si and Ge nanowires were synthesized by gold nanocrystal–seeded supercritical fluid–liquid–solid growth in supercritical toluene using either monophenylsilane or diphenylgermane as the reactant, as described elsewhere in detail.Reference Hanrath and Korgel1–Reference Tuan and Korgel4, Reference Holmberg and Korgel8 All solvents were purchased from Sigma-Aldrich (St. Louis, MO). Nanowire fabric was prepared using a modified version of the process described in Ref. Reference Smith, Holmberg and Korgel9, where a dispersion of nanowires is placed in a Teflon trough and the solvent is allowed to evaporate, leaving a sheet of nanowire fabric, which is subsequently peeled off of the trough surface.Reference Smith, Holmberg and Korgel9, Reference Yuan, Liu, Akbulut, Hu, Suib, Kong and Stellacci10 The preparation of water-soluble, polyethylene glycol functionalized (PEGylated) Ge nanowires is also described elsewhere in detail.Reference Holmberg, Rasch and Korgel11 A Zerostat antistatic gun, purchased from SPI Supplies (West Chester, PA), was used for the static charging experiments. Si substrates with gold (Au) interdigitated array (IDA) electrodes were provided by EMD Chemicals (Darmstadt, Germany). Nanowires were deposited by either applying a direct current (DC) bias to the IDA electrodes using a Karl Suss PM5 Analytical Probe System (SUSS MicroTec, Sunnyvale, CA) or using a pulse generator and amplifier to apply an alternate current (AC) bias to the IDA contact pads. Scanning electron microscopy (SEM) was performed using a Zeiss Supra 40VP SEM (Carl Zeiss NTS, Peabody, MA) operated at 5 kV with a working distance of 5 mm.
III. RESULTS AND DISCUSSION
A. Observations of static charge on Si and Ge nanowires
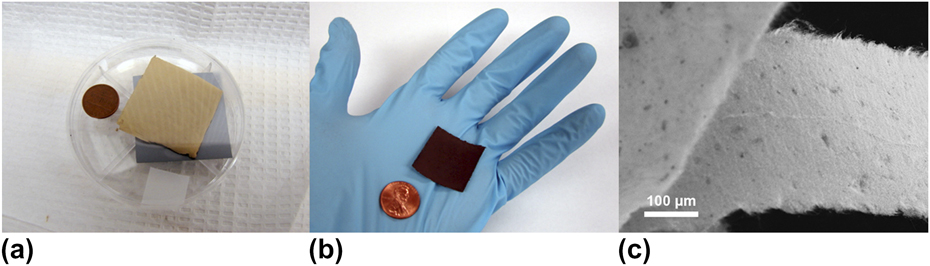
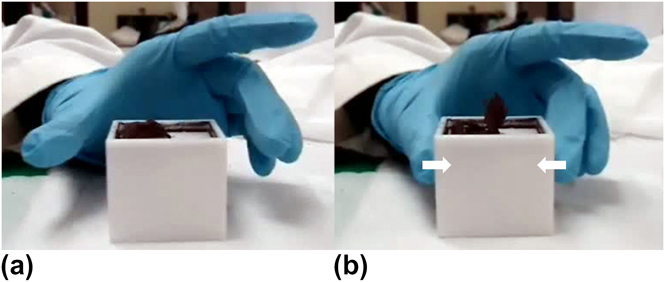
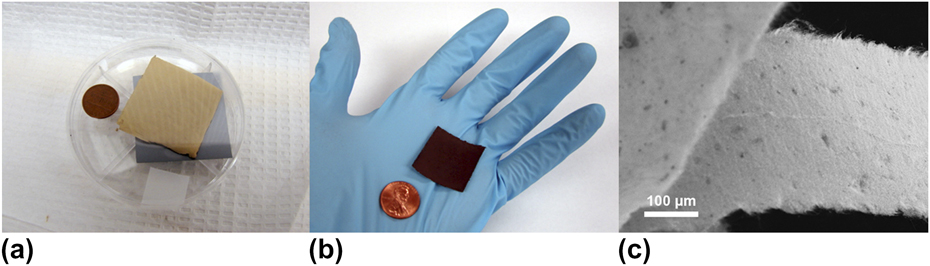
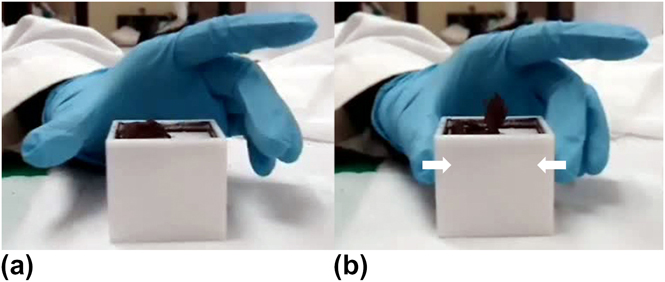
Figure 1 shows images of Si and Ge nanowire fabricReference Smith, Holmberg and Korgel9 produced by drying a dispersion of nanowires on a Teflon trough. Free-standing nanowire fabric is obtained by peeling the resulting structure off of the Teflon substrate. The fabric is comprised of a compressed mat of pure nanowires,Reference Smith, Holmberg and Korgel9 as shown in the SEM image in Fig. 1(c). Figure 2 shows a sheet of Ge nanowire fabric that is being removed from the Teflon trough. In the first image, the right half of the sheet has been peeled off of the substrate and is lying folded over on itself. When a gloved hand touches the sides of the trough, the free half of the nanowire fabric stands on end [Fig. 2(b)]. This happens because the nitrile gloves have been charged by rubbing against a plastic (polyethylene) surface. This charge is then transferred to the Teflon trough, causing the nanowires to be repelled due to their own accumulated surface charge. When the gloved hand and the associated static charge is removed, the nanowire fabric settles back into the trough.
Sheets of (a) Si and (b) Ge nanowire fabric. (c) SEM image of Ge nanowire fabric.Reference Smith, Holmberg and Korgel9
(a) Ge nanowire fabric lying in a Teflon trough. (b) The Ge nanowire fabric being repelled from the surface by static charge transferred to the Teflon trough from a charged nitrile glove. As the investigator presses his thumb and middle finger onto the sidewall surfaces of the trough, the fabric is observed to stand on end. (See the Supplemental Materials for a movie of charged Ge nanowire fabric.)12
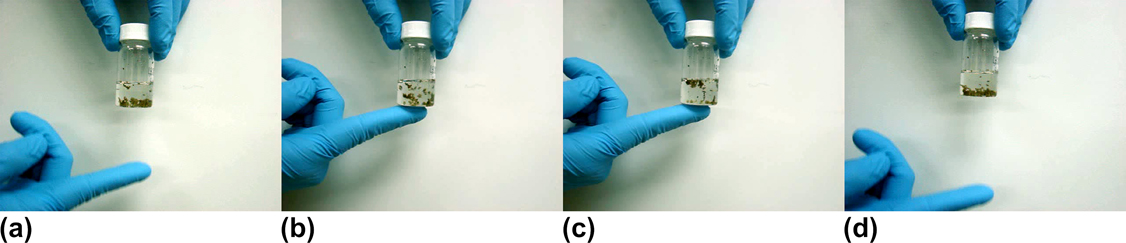
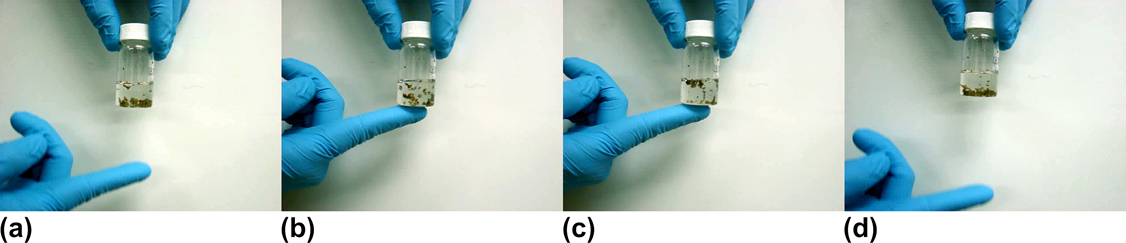
Electrostatic charging of nanowires is also observed when they are dispersed in a poor solvent. Figure 3 shows Si nanowires settled at the bottom of a vial of toluene. When a charged nitrile glove is touched to the base of the vial, the nanowires are repelled by the electrostatic charge and rapidly migrate to the top of the vial. When the source of the external electrostatic charge is removed, the nanowires sink to the bottom of the vial. Similarly, when a vial of nanowires is exposed to the ions generated by an antistatic gun, the nanowires are either attracted or repelled, depending on the polarity of the ions being generated.
(a) Si nanowires settled at the bottom of a vial of toluene. (b) The instant a positively charged nitrile glove is placed in contact with the bottom of the vial, the nanowires scatter. (c) Si nanowires held at the top of the vial by a repulsive electrostatic interaction. (d) After the external source of the charge is removed, the Si nanowires sink to the bottom of the vial. (See the Supplemental Materials for a movie of Si nanowires moving in response to static charge.)13
When two materials with different work functions come into contact with each other, it is possible for electrons to be transferred from the surface of one material to the other, depending on which material has the higher electron affinity, or equivalently, their relative positions on the triboelectric series.Reference Davies14, Reference Pierce15 When the two materials are separated, this results in a charge imbalance between the two materials, or static charge. For example, when a nitrile glove is rubbed against a material with a higher electron affinity, such as polystyrene, polyethylene, polyvinylchloride, neoprene, or synthetic rubber, the surface of the nitrile develops a positive charge.Reference Pierce15 This excess charge creates an electrostatic field that attracts charged objects with opposite polarity and repels those with like charges. In another example, when scotch tape (polyethylene) is adhered to a piece of steel and quickly removed, it acquires a negative charge because of its high electron affinity.Reference Pierce15 Unlike the positively charged nitrile glove utilized in Figs. 2 and 3, when a negatively charged piece of scotch tape is brought in proximity to a group of nanowires, the nanowires are strongly attracted, jumping up, and adhering to its surfaces.
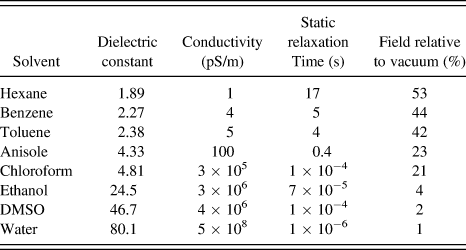
Si and Ge nanowires respond strongly to electrostatic fields applied in vacuum, in air, and in liquid solvents, as illustrated in Fig. 3. In particular, a strong electrostatic response was observed from nanowires dispersed in hexane, benzene, and toluene. Only a small amount of motion was observed for nanowires dispersed in anisole, and there was no motion from nanowires dispersed in chloroform, ethanol, or dimethyl sulfoxide (DMSO). Likewise, PEGylated Ge nanowiresReference Holmberg, Rasch and Korgel11 dispersed in water showed no response to applied electrostatic fields. Polar solvents are much more effective at dissipating charge and shielding electric fields than nonpolar solvents. Electrostatic forces are governed by Coulomb’s law,

where r is the separation between charges Q 1 and Q 2, ε is the dielectric constant of the surrounding medium, and ε 0 is the permittivity of free space. Therefore, the electrostatic force on the nanowires is inversely proportional to the dielectric constant of the fluid medium. Table I provides a list of solvent dielectric constant and typical electrical conductivity. Nanowires dispersed in hexane, benzene, and toluene experience roughly half the electrostatic field relative to vacuum because of their low dielectric constants. Anisole and chloroform shield roughly 80% of the electrostatic field, whereas polar solvents like ethanol, DMSO, and water attenuate 95–99% of the applied field.
Solvent dielectric constants, conductivities, static relaxation times, and electric field relative to vacuum.

Even if the electrostatic field penetrates the solvent, the solvent can still dissipate charge. For instance, water very effectively dissipates charge. A charged particle placed in water induces the formation of a diffuse layer of oppositely charged ions around the particle, forming an electric double layer that electrically screens the particle. This diffuse layer that screens the particle also interacts with the electric field, creating an electrophoretic retardation force, which is coupled to the particle via viscous stresses and forms the basis for particle electrophoresis. The ability of a solvent to dissipate and screen charge is directly related to its conductivity. Some solvents dissipate charge extremely quickly, whereas others like hexane and toluene tend to accumulate static charge.Reference Gibson and Lloyd6, Reference Glor7 The rate of charge dissipation is captured by the static relaxation time,

where ε and ε 0 are the dielectric constant of the medium and the permittivity of free space, and σ is the conductivity of the solvent. Table I lists the static relaxation time calculated for various solvents. For hexane, τ is nearly 20 s. Benzene and toluene exhibit values of τ near 5 s, and anisole has a τ value of about 0.5 s. Chloroform, ethanol, DMSO, and water all dissipate and screen charge within microseconds. Therefore, no electrostatic charging effects are observed in ethanol, DMSO, and water because of the fast charge dissipation and screening of the electrostatic field in these solvents. While a good fraction of the electrostatic field penetrates into chloroform, its static relaxation time is also very fast, dissipating charge in a few microseconds. Anisole has a fairly long static relaxation time and does not completely shield the electrostatic field, with the remaining solvents having the combination of a very long static relaxation time and low dielectric constant, leading to the observed electrostatic effects on the nanowires.
B. Manipulating Si and Ge nanowires dispersed in solvents by applying electrostatic fields
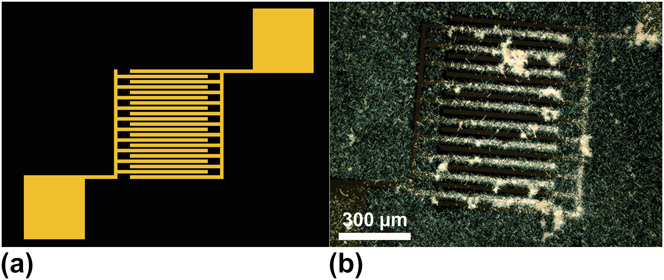
The electrostatic charge on the nanowires could be utilized as a lever to aid the deposition of semiconductor nanowires on substrates. Significantly higher surface coverage was observed when a substrate was dipped into a dispersion of Si or Ge nanowires after the substrate had been charged with an antistatic gun, as compared to an uncharged substrate. It was also observed that when a negative static charge was applied to a Si substrate with a patterned Au IDA using an antistatic gun, the nanowires accumulated preferentially on one set of metal electrodes, as shown using Si nanowires in Fig. 4.
(a) Schematic of a Au IDA on a Si substrate. (b) Dark field optical microscopy image of a Au IDA on a Si substrate after applying an electrostatic charge and dipping the substrate into a dispersion of Si nanowires. Nanowires deposit preferentially onto the negatively charged regions of the metal electrodes.
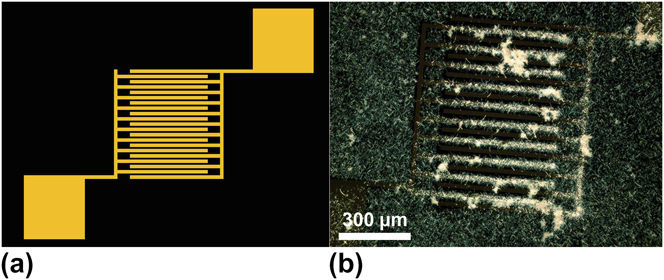
Since the electrodes are electrically isolated from each other, and both have accumulated charges of the same polarity, there is a repulsive interaction between the charges on each electrode surface. In the finger region of the IDA, the two electronically isolated metal pads are in very close proximity. While negative charge accumulates in the finger region of one electrode, repulsive electrostatic forces keep the negative charges repelled off of the finger region of the other electrode. As a result, the nanowires preferentially adhere to the negatively charged set of fingers and leave the other set of fingers bare.
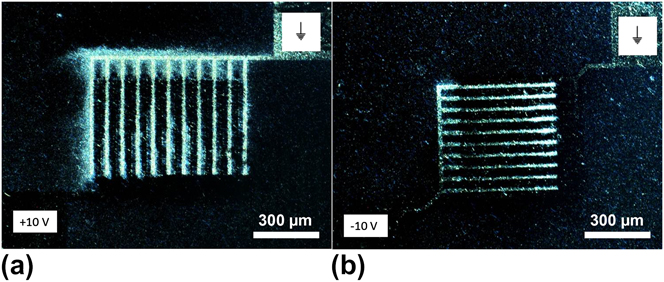
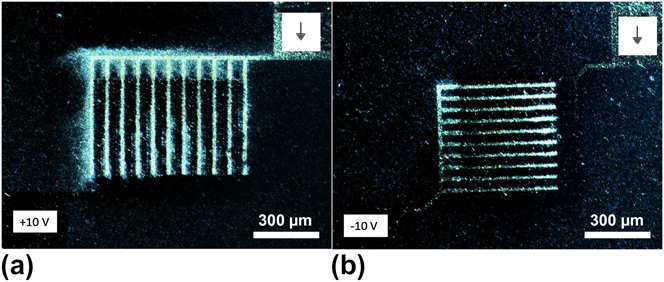
Figure 5 shows an experiment in which a 10 V DC bias was applied to the contact pads of an IDA as a droplet of Si nanowires dispersed in anisole was placed on top of the electrode. As discussed earlier, solvents such as toluene and hexane have much longer static relaxation times and allow higher field penetration than anisole (Table I). However, hexane and toluene are rather poor solvents for Si and Ge nanowires, and anisole provides much better dispersion of the nanowires for more uniform deposition. The field penetration and static relaxation time in anisole are sufficient for electrostatic deposition experiments, and the enhanced dispersion provides a distinct advantage over other solvent choices. After a few seconds on the electrode, the droplet was wicked away and the applied potential was removed. The experiment was repeated on another set of electrodes with the polarity reversed, as shown in Fig. 5(b). In both cases, the nanowires preferentially deposited onto the negatively charged electrode. Also note that the nanowire coverage on the wafer surface is lower in Fig. 5 than in Fig. 4 because of the fact that the Si surface was charged in Fig. 4, whereas only the electrodes were charged in Fig. 5.
(a) Si nanowires deposited onto a Au IDA electrode using a 10 V DC bias. (b) Si nanowires deposited using a DC bias of the opposite polarity. In both cases, the nanowires accumulate on the negatively charged electrode.
All of these observations suggest that the nanowires have accumulated an excess positive surface charge from the environment. It is likely that the charges on the nanowires are also mobile, as Protasenko et al.Reference Protasenko, Gordeyev and Kuno16 observed in photoluminescence studies of CdSe nanowires. They found that the photoluminescence was altered significantly by the presence of surface charge and observed similar electrophoretic behavior as the Si and Ge nanowires, indicating that the nature of the charge on the CdSe nanowires is similar to that on the Si and Ge nanowires.Reference Protasenko, Gordeyev and Kuno16, Reference Zhou, Chang, Protasenko, Kuno, Singh, Jena and Xing17 Protasenko et al.Reference Protasenko, Gordeyev and Kuno16 also observed both positive and negative charging of their CdSe nanowires depending on the environmental conditions. Although only net positive charge was observed for Si and Ge nanowires, it should be possible that both positive and negative charges can build up on the nanowire surface, depending on the environmental conditions, through contact and electron transfer with materials possessing significantly higher or lower electron affinities. The nature of the nanowire surface also appears to be important, as organic ligand–passivated Ge nanowires responded more weakly to external fields than nanowires without passivation. Nonetheless, nanowires with organic surface passivation still exhibited significant response to external fields, indicating that significant static charge accumulates on the nanowire surface, similar to other insulating materials.
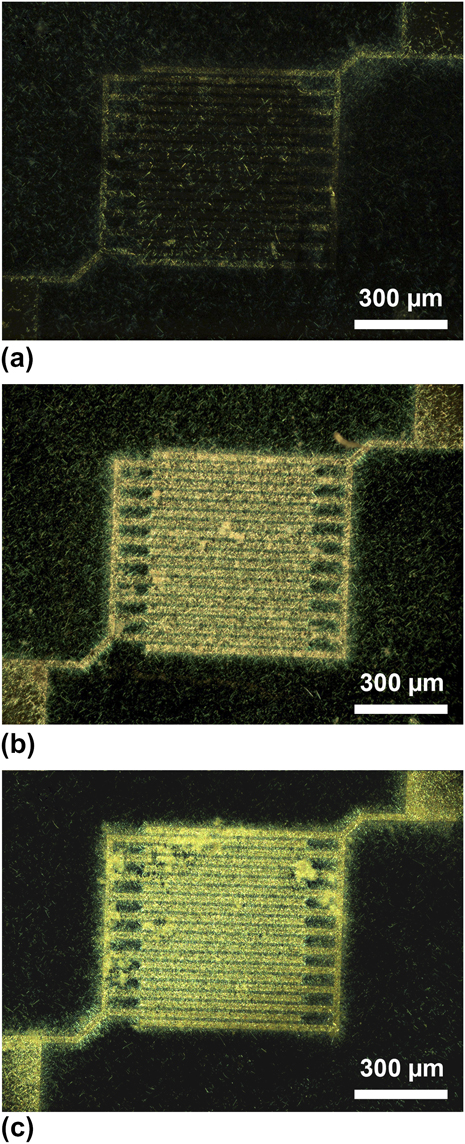
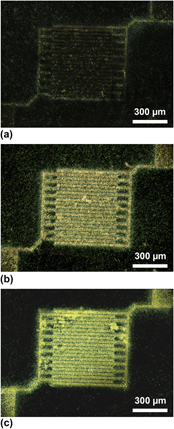
While the selective deposition results shown in Fig. 5 are insightful, it would be much more useful if the nanowires were contacting both electrodes. To coerce the nanowires into bridging the gap between the electrodes, instead of depositing on one electrode and leaving the other one bare, an AC bias was applied to the contact pads while a droplet of Si nanowires in anisole was placed on the substrate. After a few seconds, the droplet was wicked away, and the electric field was removed. Biases of 0.1, 1, and 10 V were applied with frequencies of 10, 100, 1000, and 10,000 Hz. Figure 6 shows the results of three different deposition conditions carried out at 10 Hz.
Si nanowires deposited on a Au IDA electrode using an AC bias of (a) 100 mV, (b) 1 V, and (c) 10 V at a frequency of 10 Hz.
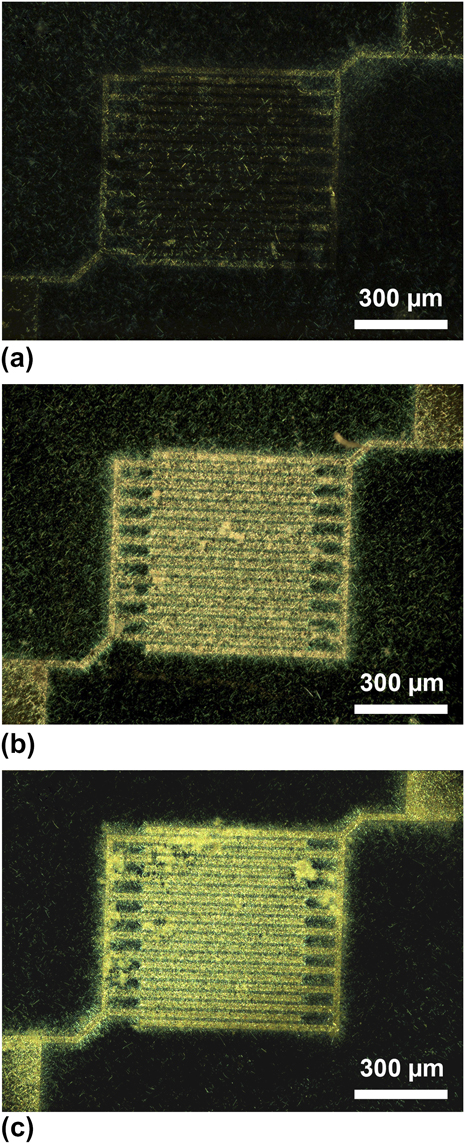
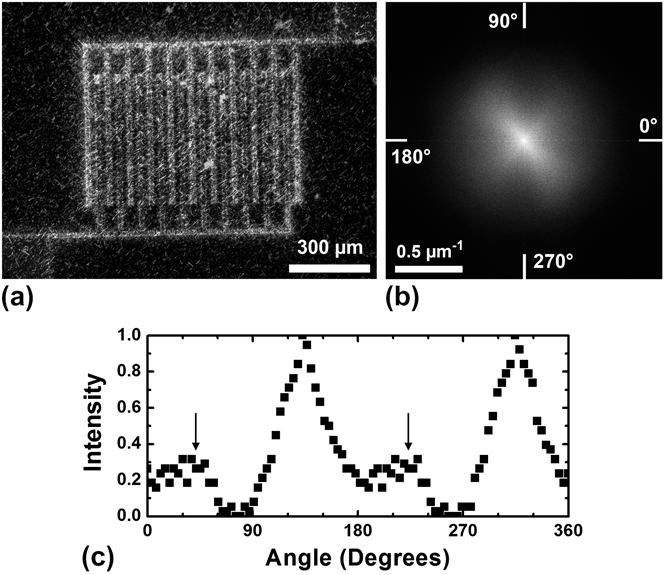
Although the frequency did not appear to affect the deposition, the nanowire coverage on the electrodes was significantly influenced by the strength of the AC field. Samples prepared with a bias of 100 mV showed little preferential deposition, with the coverage on the electrodes being comparable to that of the surrounding substrate. An AC bias of 1 V resulted in the optimal coverage, with a large quantity of wires bridging the gaps of the electrode. When the bias was increased to 10 V, a thick multilayer of nanowires was left on the IDA. Furthermore, the nanowires that deposit onto the surface of the IDA bridge the gap between the electrodes with an alignment oriented parallel to the electric field between the probes attached to the contact pads. A small fraction of the wires were also aligned perpendicular to the field, as shown in Fig. 7. The vast majority of the wires are aligned along the diagonal between the contact pads, with a few wires aligned along the other diagonal, as indicated by the anisotropy in the Fourier transform of the image and the angular distribution of the nanowires.
(a) Dark field optical microscopy image of Si nanowires deposited onto a Au IDA using an AC bias of 1 V with a frequency of 1 kHz. The majority of the nanowires are oriented diagonally between the contact pads. (b) Fourier transform of the central part of the image, illustrating the degree of alignment, and the small fraction of nanowires aligned perpendicular to the field, along the other diagonal. (c) Angular intensity distribution of the Fourier transform, measured at a radius of 0.25 μm−1, illustrating the angular distribution of the nanowires. The large intensity peaks correspond to nanowires aligned parallel to the electric field, while the arrows pointing to the smaller peaks correspond to nanowires oriented perpendicular to the field.

IV. CONCLUSIONS
Like many particulate materials and powders, static charge can make handling semiconductor nanowires quite difficult. Despite the inconveniences, electrostatic charging can also be used as a handle to manipulate nanowires. Semiconductor nanowires in vacuum, in air, or even dispersed in low dielectric constant, low-conductivity solvents move in response to externally applied electrostatic fields. By electrostatically charging surfaces, nanowires can be preferentially deposited onto selective areas of a substrate, with nanowires strongly attracted to negatively charged surfaces. Likewise, the implementation of an AC bias between two electrodes causes an alternating attraction between the two surfaces, ultimately resulting in nanowires spanning the electrode gap. Tuning the strength of the alternating electric field can also be used to control the quantity of nanowires deposited, while the orientation of the field can be used to align the nanowires. Though problematic at times, electrostatic charging proves to be very useful in the deposition and manipulation of semiconductor nanowires.
ACKNOWLEDGMENTS
This research was supported by the Robert A. Welch Foundation (F-1464) and the Air Force Research Laboratory (FA8650-07-2-5061). V.C. Holmberg acknowledges the Fannie and John Hertz Foundation and the NSF Graduate Research Fellowship Program for financial support.