
Introduction
Uranium dioxide (UO2) is a widely used nuclear fuel because of its vast application in almost all types of commercial nuclear reactors, such as boiling water reactor and pressurized water reactor.[1] During severe conditions, such as Fukushima accident, zirconium metals may react with water at elevated temperature, leading to the fuel failure and the generation of hydrogen with the risk of explosion.[2] Extensive efforts are focused on the development of advanced fuels with enhanced performance and accident tolerance to improve the safety margin of the current light water reactor fleets and the development of future advanced nuclear systems. New concepts of fuels such as engineering fuels with increased grain size by sintering additive, composite fuels and high-density fuels are proposed to improve fuel behavior, performance, and safety of UO2 with the focus on fuel fabrication of UO2,[Reference Wolfe and Kaufman3–Reference Carrea6] mechanical properties[Reference Wolfe and Kaufman3, Reference Kutty, Chandrasekharan, Panakkal and Ghosh7, Reference Novikov, Sivov, Mikheev and Fedotov8] and thermal properties.[Reference Yamada, Kurosaki, Uno and Yamanaka9–Reference Watanabe, Sinnott, Tulenko, Grimes, Schelling and Phillpot12]
As oxide fuels are typically fabricated by high-temperature sintering (over 1700°C) for a long duration (several tens of hours) in a reducing atmosphere,[Reference Williams, Barnes, Scott and Hall5, Reference Carrea6] it is highly desired to develop new fuel fabrication technologies for new concept fuel types. UO2 can also be sintered using hot pressing,[Reference Wolfe and Kaufman3, Reference Amato, Colombo and Balzari4] where a pressure is applied to the pellet at elevated temperature and held for a certain period of time to enhance the fuel fabrication. For example, Amato et al.[Reference Amato, Colombo and Balzari4] investigated the hot-pressing sintering mechanisms and achieved over 95% theoretical density by hot pressing at 8000 psi and 1200°C for 60 min. In addition to hot pressing, spark plasma sintering (SPS) is a field-assisted sintering technology (FAST) that works by applying high DC current and hydrostatic pressure during sintering, enabling rapid consolidation of dense ceramic pellets with controlled microstructure and enhanced densification. The application of modern SPS process brings numerous benefits to the nuclear fuel fabrication in reducing sintering temperature and sintering time within a few minutes,[Reference Wei, Zhang, Shen, Wang, Sun, Yang and Lee13] and achieving a near theoretical density (TD). Recently, extensive researches have been performed to apply SPS as a FAST to synthesize nuclear fuel pellets. For example, Ge et al.[Reference Ge, Subhash, Baney, Tulenko and McKenna14] studied the influence of sintering conditions, such as sintering temperature, holding time, and heating rates, to the densification of the UO2 pellets. More than 95% TD pellets can be sintered when temperature reaches 1050°C, and no significant improvement in densification is achieved with further increase in the temperature. Tyrpekl et al.[Reference Tyrpekl, Naji, Holzhauser, Freis, Prieur, Martin, Cremer, Murray-Farthing and Cologna15] studied the role of the electrical field during the UO2 sintering process, and reported the presence of larger grain size at the anode than cathode, which can be attributed to the electric-potential-induced grain growth at the anode size. We recently demonstrated the capability of SPS in sintering dense fuel pellets with controlled length scales and stoichiometry from nanocrystalline to very large micrometer-sized UO2 pellets, enabling the investigation of the thermal properties[Reference Yao, Scott, Xin, Gong and Lian16] and grain growth kinetics as functions of microstructures.[Reference Yao, Mo, Yun, Nanda, Yacout and Lian17]
However, the dimension and size of the pellets sintered previously by SPS were typically a few millimeters thick, significantly less than the full size of the commercial fuel pellets (e.g., 10 mm in height), and the microstructure evolution and microchemical variation across the whole pellets and the impacts of the sintering parameters are not fully revealed. It is expected that the non-uniformity distribution of the temperature gradient through highly non-conductive UO2 will impact the fuel microstructure and stoichiometry. A thorough investigation and detailed experimental data on microstructure and stoichiometry and their correlation with SPS processing parameters of the sintered UO2 pellets are of technical importance to further develop SPS as an advanced technology for nuclear fuel fabrication. In the current study, we fabricated the commercial-size fuel pellets (10 mm diameter and 11 mm height) using SPS at 1600°C for 5 min, and the homogeneity of microstructure and micro-chemical variation across the fuel pellets were investigated. Particularly, the sintered pellet was cut into six discs and each disc was characterized using x-ray diffraction (XRD) to characterize the stoichiometry at different depths along the axial direction of the sintered fuel pellet. Raman mapping was performed on the cross-section of the fuel pellet in order to identity the possible controlled defect configurations and structure variation. It has been found that the whole pellet displays almost identical Raman spectra, suggesting a nearly ideal fluorite with only point defects in the oxygen sublattice. Grain size distribution was also determined by measuring more than 50 locations on the cross-section of the fuel pellets, and it was found that the largest grain size occurred at upper center, decreasing accordingly from the center to the rim and from the anode to the cathode.
Experimental procedure
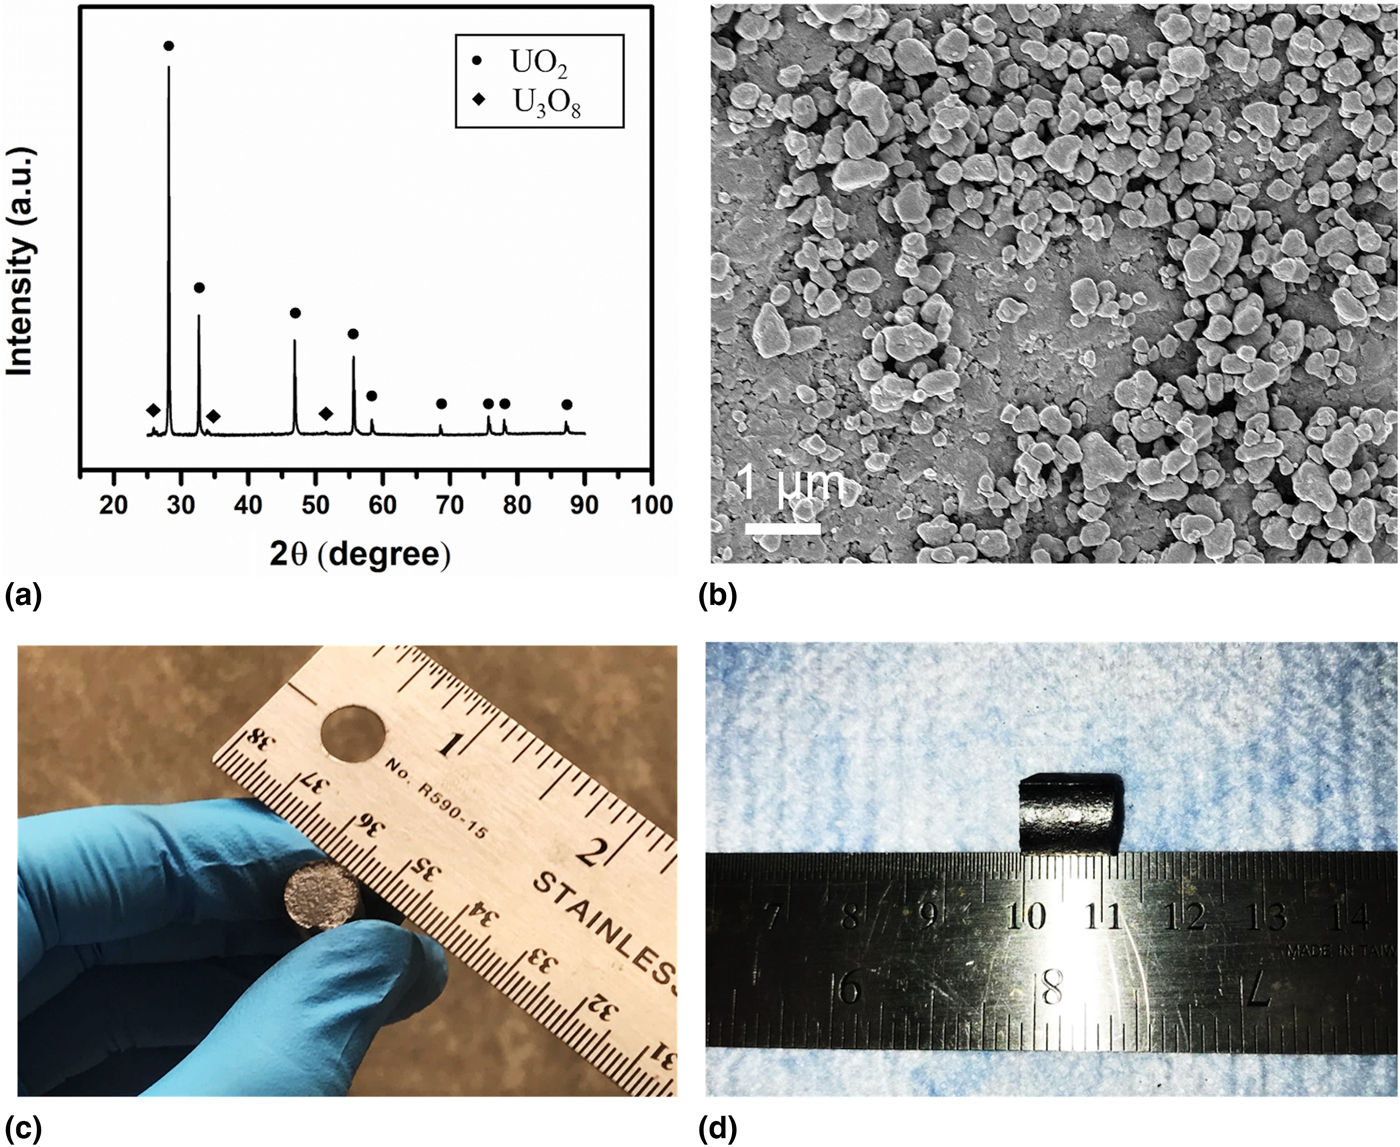
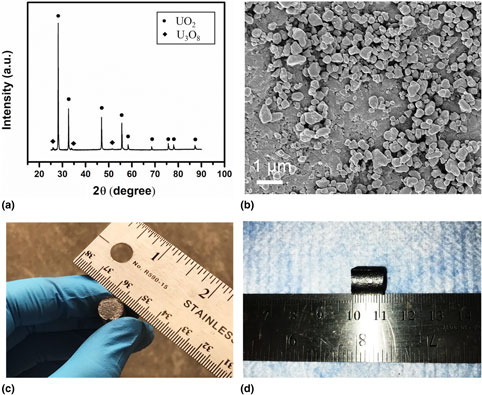
The original powder was purchased commercially with initial stoichiometry of UO2.11. U3O8 was added as an additive into UO2+x in order to control fuel stoichiometry of the sintered pellets as shown by the dual phase in the XRD of the starting materials [Fig. 1(a)]. The volumetric fraction of UO2 is estimated to be ~93.6%, based on the quantitative analysis using the refinement software Maud. High-energy ball milling (HEBM) is a widely applied mechanochemical processing technique[Reference Yao, Mo, Yun, Nanda, Yacout and Lian17] to facilitate the synthesis and manufacture of many materials that are traditionally difficult or even impossible to produce.[Reference Sopicka-lizer18] HEBM was used to pre-process the starting powders and reduce the grain size of the starting materials in order to enhance sinterability. After ball milling, the average grain size was measured as ~388 nm based on over 20 measurements of the particles from the high-magnification scanning electron microscopy (SEM) images [Fig. 1(b)]. With reduced grain size and elevated surface areas, high sintering density and superior mechanical properties of the synthesized sample can generally be expected.[Reference Wank and Wielage19] In this work, HEBM was conducted under ambient atmosphere using an HEBM apparatus (Fritsch, Pulverisette 7, Idar-Oberst, Germany) to ensure the homogenization of particle size and specific surface area. Ten grams of UO2 powder was loaded into a tungsten carbide (WC) ball-milling jar, along with two WC balls that are of 8 mm in diameter. Eighty ball-milling cycles were performed and each cycle consisted of 15 min running time and 10 min idle time.
(a) XRD spectrum of the starting powder showing the mixture of UO2+x and small amount of U3O8, (b) an SEM image of the starting powders after ball milling showing average particle size of ~388 nm, (c–d) photos showing the dimension of the SPS-sintered UO2 with the diameter 10 mm and thickness 11 mm.
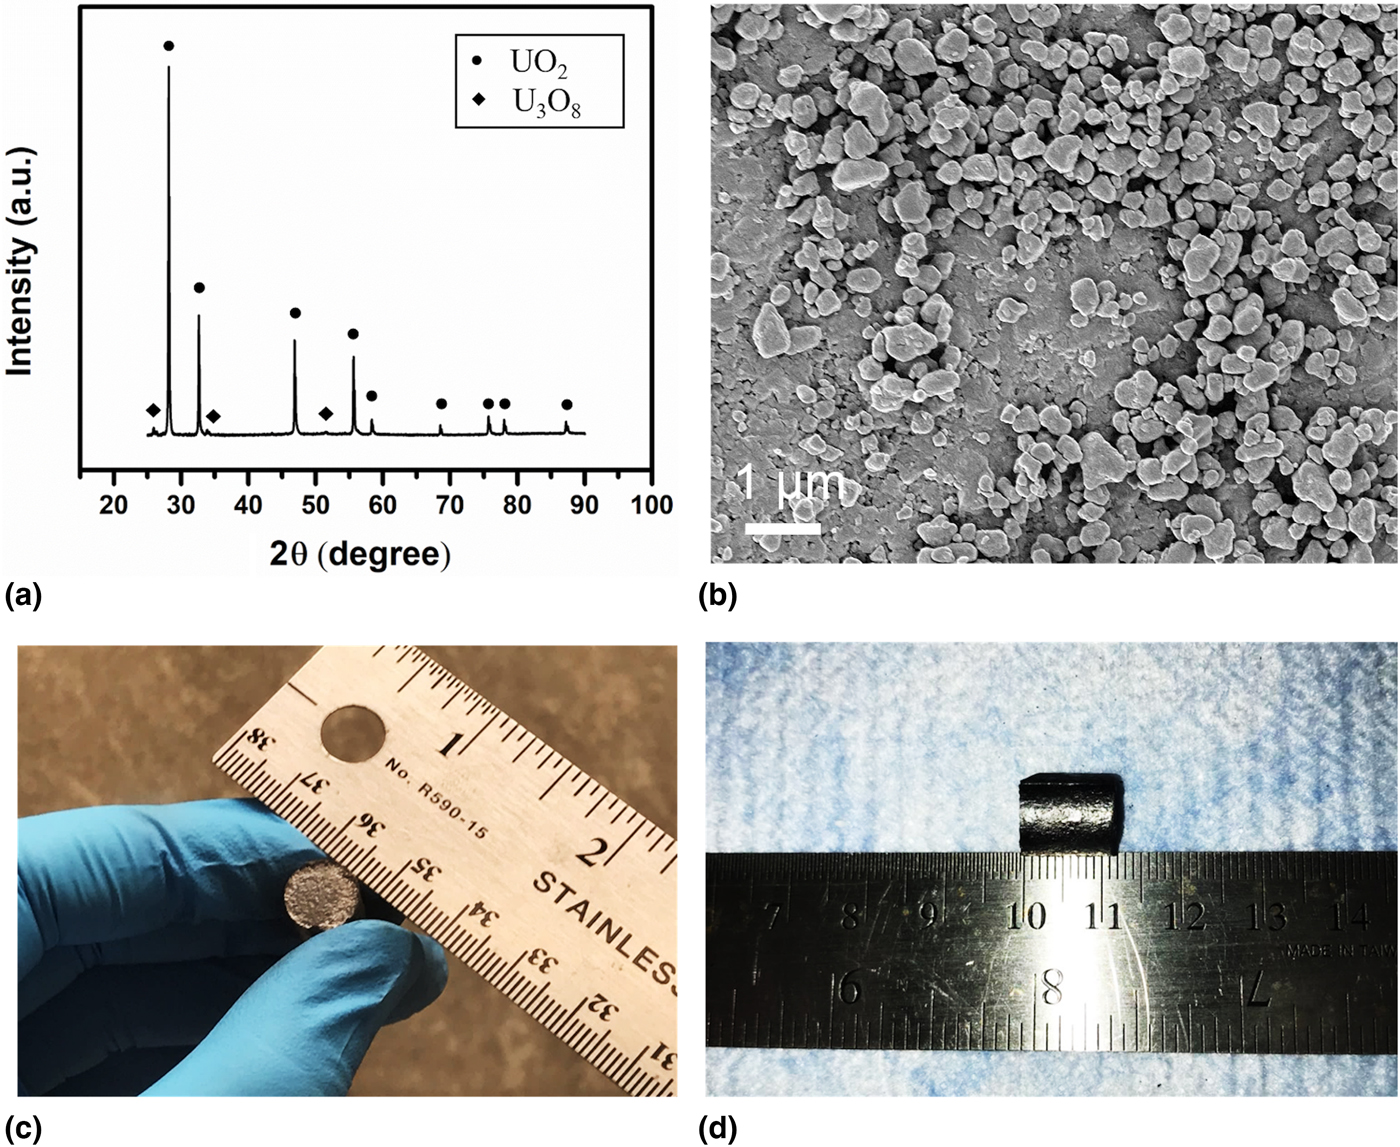
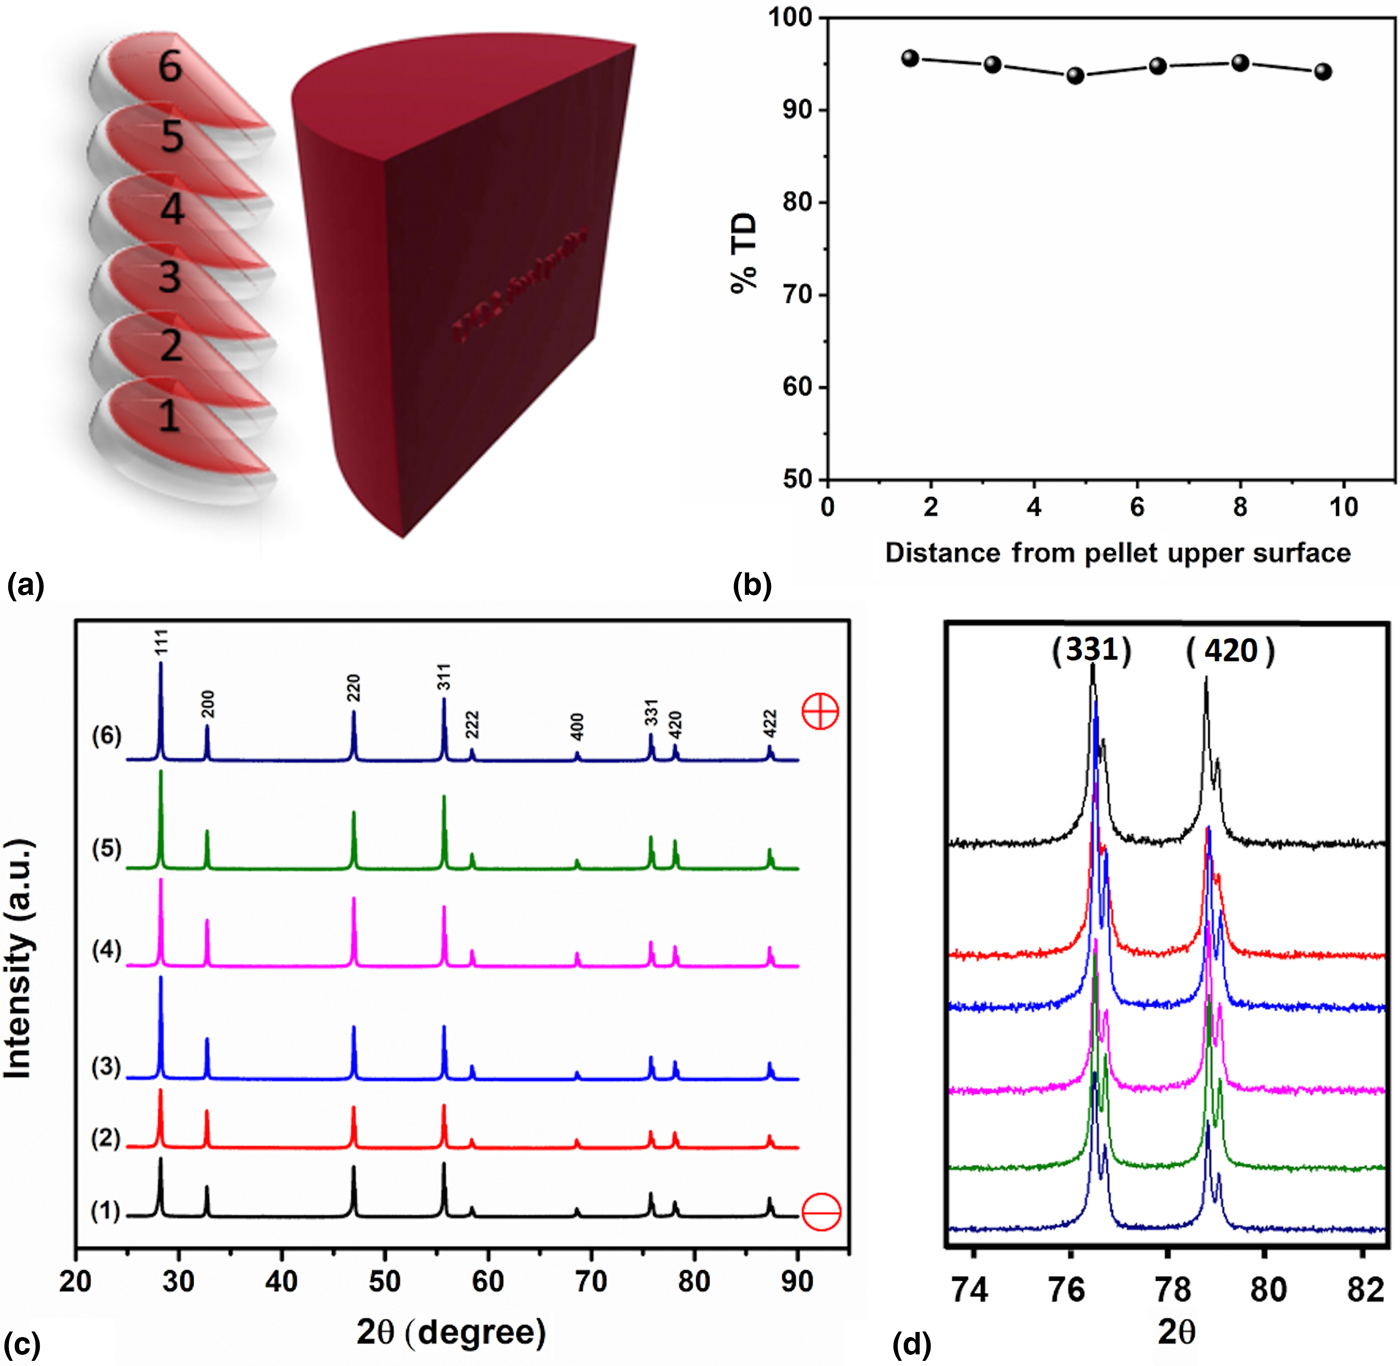
The sintering and densification of UO2 was conducted using an SPS apparatus (Thermal tech® SPS 10-3, Santa Rosa, CA, USA). The milled powder was loaded into a graphite die with the size of 20 mm outer diameter, 10 mm inner diameter and 30 mm height. A piece of graphite foil with size being the same as the inner chamber of the die was rolled and put into the die to ensure no powder contacting with the dies. Before inserting the graphite punch, two graphite disks were inserted at each side of the loaded powder to separate the powder from the punches, ensuring that the pellet would not stick to the punch after sintering. A piece of graphite felt with a hole opened in the middle was used to cover the die as a means of thermal insulation. The purpose of the hole was to allow the pyrometer to measure the temperature of the die during sintering. Then the die-punch-felt assembly was loaded into the SPS chamber and was pre-pressed at 10 MPa by punches at two ends. The position of the assembly was adjusted to ensure the pyrometer to detect the temperature at the middle of the die. The chamber was vacuumed before sintering and backfilled with argon during sintering. Important sintering data were constantly acquired and recorded through the software Specview. During sintering, temperature was raised from room temperature to 1600°C with a heating rate of 150°C/min, while the pressure was raised from 10 to 30 MPa at an increasing rate of 2.5 MPa/min. The holding time, i.e., the period during which the temperature and the pressure were kept unvaried, is 5 min. When the holding time came to the end, the power was immediately turned off and the pressure was released right away. After the temperature dropped to the room temperature, the sample was taken out and the graphite disks were carefully peeled off. Figures. 1(c) and 1(d) show the fuel pellet after sintering with a commercial-size dimension (10 mm in diameter and 11 mm in height). The whole pellet was then cut into two isometric pieces with diamond blade and one of them was then cut into six isometric disks from top to bottom [Fig. 2(a)]. The physical density as measured by an Archimedes’ Method indicates a similar physical density (~95% TD) among the six slices from top to bottom of the fuel pellet [Fig. 2(b)], suggesting that a uniform densification was achieved for the commercial-size fuel pellet sintered by SPS.
(a) A sketch view of six slices of samples cutting from the whole-sintered pellet and the corresponding density measurements, (b) showing uniform densification achieved across the whole pellet by SPS, (c) XRD spectra, and (d) in high-angle range obtained from the slices cut from the whole pellet. The consistent intensity and peak positions across the whole pellets suggest a uniform fuel chemistry close to near stoichiometry UO2.

XRD patterns of the polished slices were measured on a Panalytical X'Pert XRD system (Westborough, MA, USA) using Cu Kα (λ = 1.5406 Å) irradiation, with a range being 25–90°. Before each measurement, the sample height was aligned at the bisected x-ray beam. The XRD scanning step used for all scans is 0.013° and 0.5 s/step. The stoichiometry of the sample is calculated with lattice parameters according to the empirical equation[Reference Teske, Ullmann and Rettig20] shown below, where a is the derived lattice parameter and x is the stoichiometry deviation of UO2+x from stoichiometric UO2.[Reference Teske, Ullmann and Rettig20]
 $$a = \left(5.4705 - 0.1306\; x \right)\; \ring{\rm A}.$$
The grain structure and size were determined using a Carl Zeiss Supra 55 (Jana, Germany) field-emission SEM. The sample was chemically etched using 75 vol.% nitric acids for 6 min.
Micro-Raman scans across the cross-section of the half pellet were also carried out in order to investigate their vibrational properties, structural deviation, and defect configurations in the oxygen sublattices as Raman spectroscopy is sensitive to structural variation in anion sublattices. Raman spectroscopy measurements were performed using a Renishaw system Micro-Raman spectrometer equipped with an argon-ion laser (514.5 nm). For every measurement, the laser power was 20 mW, the exposure time was 10 s, and three accumulations were conducted. After each scan, the surface of the sample was examined to ensure that no damage was introduced. The range of the scan was 100–1600/cm1 to include all of the possible bands of UO2.
Results and discussion
XRD spectra [as shown in Figs. 2(c) and (2d)] of the slices are arranged vertically according to their actual positions to be more distinguishable. The layers close to the anode and cathode of the SPS are marked as + and – in the figure. No peak shift and variation in peak intensity are observed, suggesting consistent chemical stoichiometry through the whole pellet.
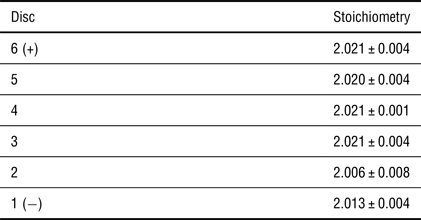
Stoichiometry of six discs cutting from the pellet, showing that stoichiometry decreases from the top of the sample (close to anode) to the bottom (close to cathode). Stoichiometry is calculated based on the XRD shifts.[Reference Teske, Ullmann and Rettig20]

The stoichiometry for slides determined based upon XRD diffraction is tabulated in Table I. It can be noticed that the stoichiometry of all layers is close to each other and are close to the stoichiometric UO2, indicating that the UO2 phases are uniform along the radial direction within the thickness of the commercial-size fuel pellets. It is also found that the stoichiometry is reduced from 2.11 to 2.02 during the sintering process, consistent with previous literature[Reference Tyrpekl, Naji, Holzhauser, Freis, Prieur, Martin, Cremer, Murray-Farthing and Cologna15, Reference Ge, Subhash, Baney and Tulenko21] and can be explained by the reactions[Reference Ge, Subhash, Baney and Tulenko21–Reference Gossé, Guéneau, Chatillon and Chatain23] of UO2+x with carbon from the graphite dies as follows.
 $${\rm UO}_{2 + x} + x{\rm C}\; \to {\rm UO}_2 + x{\rm CO}.$$
The layers near cathode show a slightly lower value of stoichiometry than the one near the anode, which matches with Tyrpekl et al.’s findings.[Reference Tyrpekl, Naji, Holzhauser, Freis, Prieur, Martin, Cremer, Murray-Farthing and Cologna15] They found that the surface adjacent to the positive side has a higher oxidation state than the negative side as a result of the oxygen ions movement and distribution introduced by the electric field. The stoichiometry of layer 2 is slightly lower than layer 1, which might be explained by the measuring error.
The microstructure of the sintered pellets was observed based on a set of 60 SEM images acquired on the cross-section of the sample at locations shown in Fig. 3(a). The grain size at these locations was obtained based on the measurements of more than ten grains. A contour map [Fig. 3(b)] of the grain structure across different locations of the whole pellets is constructed from the SEM observations [Figs. 3(c)–3(e)]. The grain size at the upper center of the pellet is approximately 46 µm [Fig. 3(c)], bottom center is 21 µm [Fig. 3(d)], and bottom rim is 19 µm [Fig. 3(e)]. It can also be noticed from the SEM images that there are some cavities resulting from the chemical etching using 75 vol.% nitric acids.
(a) A schematic view of the 60 spots on the cross-section of the sintered fuel pellets for SEM microstructure analysis, (b) grain size mapping (in the size of micrometers) constructed showing the largest grain obtained at the upper center of the pellet, (c–e) SEM images of different regions showing grain sizes at (c) the upper center ~46 µm, (d) bottom center ~21 µm, and (e) bottom rim ~19 µm, (f) grain size variation along the axial direction, and (g) grain size variation along the radial direction. The grain size decreases from the top to the bottom, and decreases from the center to the rim across the fuel pellet.

The variations of average grain size on the cross-section along axial and radial directions are also plotted and a mapping of the average grain size on the cross-section at all spots is conducted, which is shown in Figs. 3(f) and 3(g), respectively. It is found that along axial direction, the largest average grain size is ~39 µm and the smallest is around ~24 µm. Grain size tends to decrease from anode to cathode. Along radial direction, the largest average grain size is ~38 µm, while the smallest is ~23 µm, with an increasing trend from the rim to the center. Also, from the mapping of grain sizes on the whole region [Fig. 3(b)], it is clearly evidenced that large grains are close to the top center of the sample.
Non-uniform distribution of grain size could be attributed to the temperature gradient within the sample during sintering. There are many existed theories interpreting UO2 grain growth, such as the first kinetic model proposed by Burke and Turnbull,[Reference Burke and Turnbull24] the model considering pore migration along boundaries,[Reference Kingery and Francois25] and the extended model for different transport processes.[Reference Nichols26] The formulae of grain growth these authors proposed are of the same form as shown below, where D is the grain size at time t, D 0 is the starting grain size, R is the ideal gas constant, T is the temperature, Q is the activation energy, and k is a constant that depends on different models. The equation displays a positive relationship between the grain size D and the temperature T, indicating that in a certain range, when the temperature is high, the grain size is large.
 $$D^n - D_0^n = kt \cdot \; \exp \left( { - Q/RT\;} \right).$$
On the other hand, the distribution of temperature in a sintering specimen is not absolutely uniform, according to the finite element simulations conducted by Wei et al.,[Reference Wei, Zhang, Shen, Wang, Sun, Yang and Lee13] Diatta et al.,[Reference Diatta, Antou, Pradeilles and Maître27] Mondalek et al.,[Reference Mondalek, Silva and Bellet28] and Wang et al.[Reference Wang, Zhao and Cheng29] These authors showed that (1) temperature is higher at top than bottom[Reference Wei, Zhang, Shen, Wang, Sun, Yang and Lee13] and (2) temperature at center of the specimen is higher than the rim.[Reference Wei, Zhang, Shen, Wang, Sun, Yang and Lee13, Reference Diatta, Antou, Pradeilles and Maître27–Reference Wang, Zhao and Cheng29] The explanation for (1) might be the higher current density and Joule heat at the top than at the bottom[Reference Wei, Zhang, Shen, Wang, Sun, Yang and Lee13]; while for (2) electrical conductivity difference[Reference Diatta, Antou, Pradeilles and Maître27] and current density difference.[Reference Mondalek, Silva and Bellet28] Considering the thermal conduction from the center to the rim and thermal convection from the rim to the protective gas, the difference may be even augmented. Combined with the grain growth theory, it is not hard to explain why the largest grain is achieved at the top center. Tyrpekl et al.[Reference Tyrpekl, Naji, Holzhauser, Freis, Prieur, Martin, Cremer, Murray-Farthing and Cologna15] also observed similar phenomenon, i.e., larger grains were obtained close to the anode and their explanation is electric field-induced redistribution of defects.
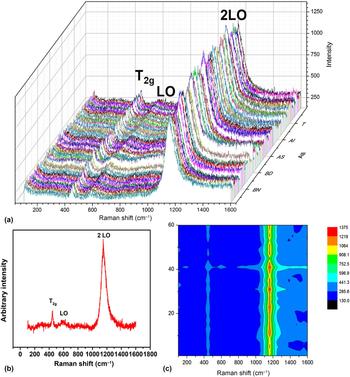
A set of 60 Micro-Raman spectra in total was acquired [Fig. 4(a)] from the location shown in Fig. 3(a), which covers more than half of the cross-section of fuel pellets. Figure 4(b) displays a representative Raman spectrum showing three characteristic Raman modes with wavelengths identified as 447, 577 and 1153/cm, which is in excellent agreement with the reported data in the literature. Specifically, stoichiometric UO2 possesses a fluorite structure with Fm-3m space group, which was predicted by the group theory to contain two vibrational modes.[Reference Graves30, Reference White31] Therefore, one Raman mode (T 2g) and one infrared mode (T 1u) are expected for the material of this type.
(a) Collection of 60 µm-Raman spectra across the half pellets [as shown in Fig. 3(a)], (b) a representative micro-Raman spectrum showing three characteristic active peaks of T 2g at 445/cm, LO at 577/cm, and 2LO at 1153/cm, (c) a contour map of the intensity of the active Raman modes from the spectra shown in (a). The almost identical Raman spectra with similar peak intensities and the strongest 2LO mode clearly suggest that the SPS-densified fuel pellet displays a nearly perfect fluorite structure and dominates point defects in oxygen sublattices.

Triply degenerated Raman mode (T 2g) was reported to be observed at 445/cm,[Reference Tyrpekl, Naji, Holzhauser, Freis, Prieur, Martin, Cremer, Murray-Farthing and Cologna15, Reference Yao, Mo, Yun, Nanda, Yacout and Lian17, Reference Graves30, Reference Razdan and Shoesmith32–Reference Palacios and Taylor35] which is a fundamental U–O vibrational stretch. The band tends to get broader and its intensity tends to get decreased while UO2 gets oxidized, due to the reason that β-U3O7 and α-U3O8 might form on the surface while the sample is exposed in the ambient atmosphere and gradually the overall structure is altered from fluorite to orthorhombic.[Reference Allen, Butler and Tuan34, Reference Manara and Renker36] Since this band is seen to be narrow and sharp in the current study, it is evident that our sintered UO2 pellet is close to stoichiometric. Another observed band is at 577/cm, which corresponds to the non-degenerate IR active (T 1u) longitudinal optical (LO) mode.[Reference Yao, Mo, Yun, Nanda, Yacout and Lian17, Reference Graves30, Reference Naji, Colle, Benes, Sierig, Rautio, Lajarge and Manara37–Reference Livneh and Sterer39] It was mentioned that except for the aforementioned T 2g band, other bands may also appear in the range of 500–700/cm due to the point defects[Reference Naji, Colle, Benes, Sierig, Rautio, Lajarge and Manara37] or lattice damage.[Reference Graves30] Desgranges et al.[Reference Desgranges, Guimbretiere, Simon, Jegou and Caraballo40] showed that this band is Raman-forbidden and would become Raman active due to lattice damage or clustered oxygen vacancies.[Reference Chollet, Prieur, Bohler, Belin and Manara38] Livneh and Sterer[Reference Livneh and Sterer39] assigned LO to this band and proved that there is a Raman resonant overtone at 1150/cm, which was assigned to 2LO. The most intensive band observed for our stoichiometric UO2 is at 1153/cm[Reference Yao, Mo, Yun, Nanda, Yacout and Lian17, Reference Graves30, Reference Razdan and Shoesmith32, Reference Manara and Renker36, Reference Naji, Colle, Benes, Sierig, Rautio, Lajarge and Manara37, Reference Desgranges, Baldinozzi, Simon, Guimbretière and Canizares41–Reference Pointurier and Marie45] and debates exist for the origin of this band. Schoenes[Reference Schoenes46] reported this band and suggested its electronic origin was due to the dependence of the intensity. The band was then related with the Γ5→Γ3 crystal field transitions. Graves[Reference Graves30] also reported the band on the single-crystal UO2 and it was claimed that this band is not because of the phonon process but electronic scattering. This band was recently reassigned to the 2LO band instead of Γ5→Γ3 crystal field transitions, based on the measurement of Raman spectra of UO2 under pressure. Manara and Renker[Reference Manara and Renker36] stated that this band can be regarded as a fingerprint of quasi-perfect fluorite structure. Based on the structural regions identified by He et al.,[Reference He and Shoesmith43] the defect structure of our sintered commercial-size UO2 pellet is a random point defect due to small amount of interstitial oxygen atoms.
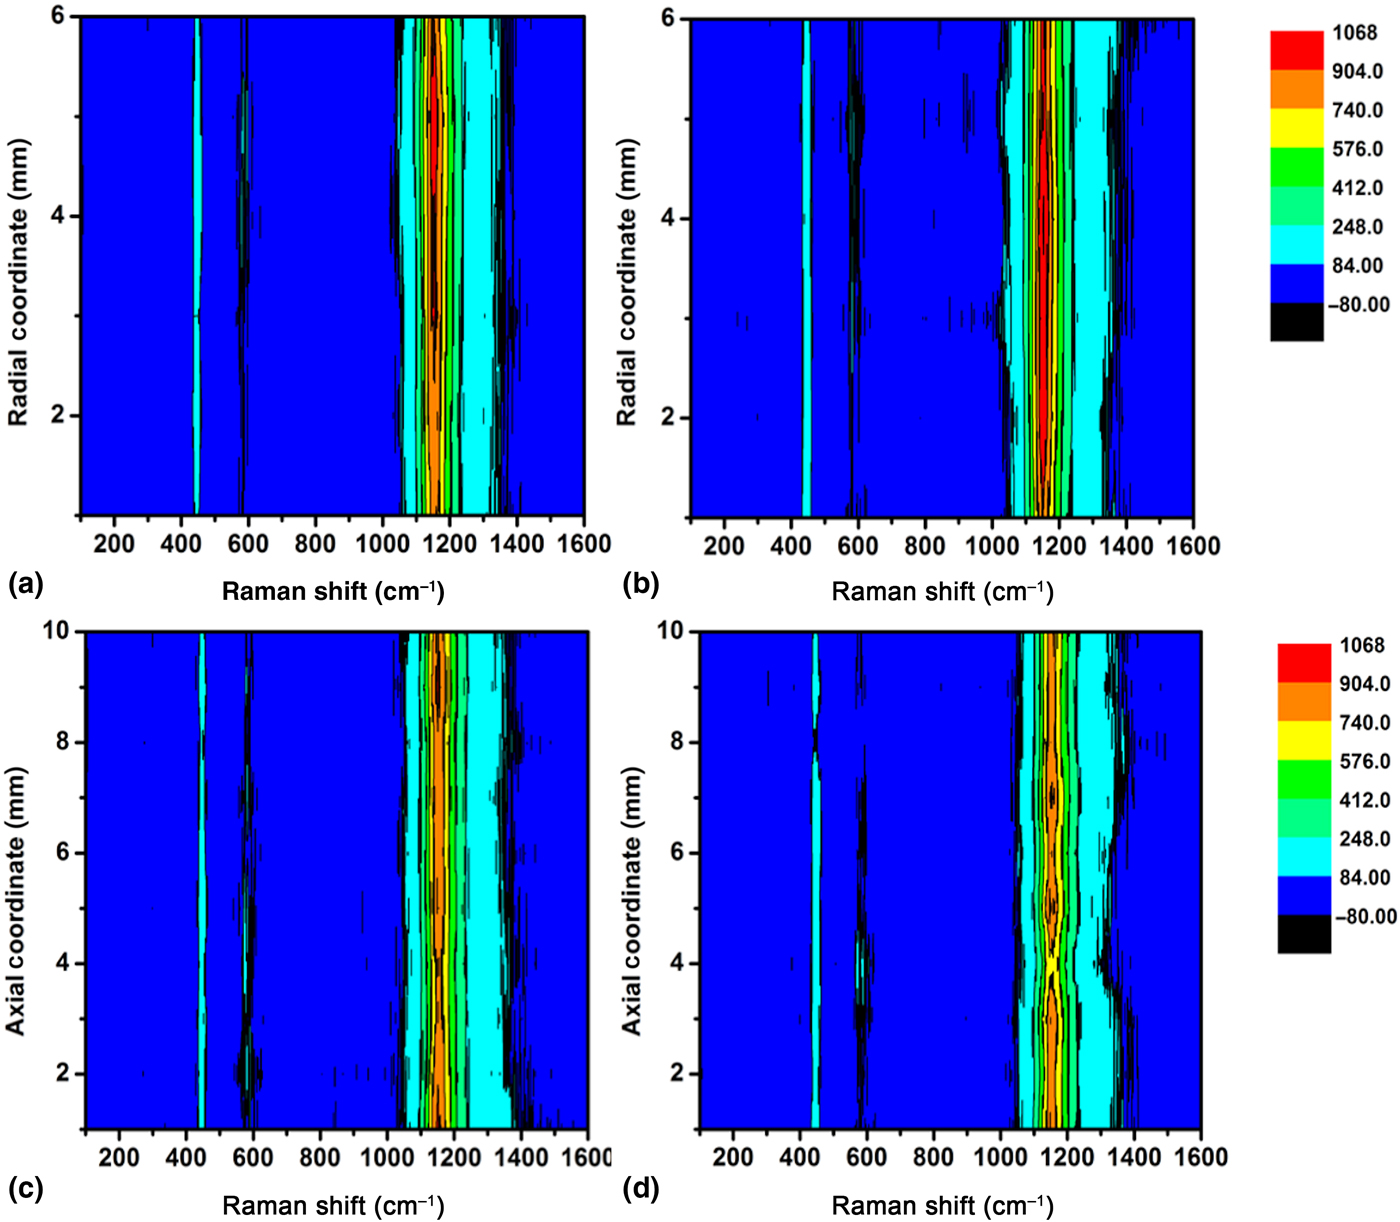
A contour map of the micro-Raman measurement was also constructed based on the 60 Raman spectra to show the structure and defect variations across the whole fuel pellets [Fig. 4(c)]. Figure 5 shows a contour map of the Raman spectroscopy across different locations along the radial direction at the top [Fig. 5(a)] and bottom [Fig. 5(b)] of the sample, and along axial direction at the rim [Fig. 5(c)] and middle [Fig. 5(d)]. From all mappings, it can be found that the Micro-Raman is quite uniform at all places. The almost identical Raman spectra with similar peak intensities and the strongest 2LO mode clearly suggest that the SPS-densified fuel pellet displays a nearly perfect fluorite structure and dominates point defects in oxygen sublattices.
Raman mapping showing uniformity of the defect configuration and structure across the whole-sintered fuel pellets: (a) along radial direction at the top of the fuel pellet, (b) along radial direction at the bottom of the fuel pellet, (c) along axial direction at the rim, (d) axial line at the center. The Raman mapping was constructed from the 60 spectra as shown in Fig. 4(a), and the uniform peak intensity across different locations of the fuel pellet again indicates the uniformity of defect configuration and structure.

Conclusion
In summary, a dense commercial-size UO2 fuel pellet with ~95% theoretical density was synthesized by combining HEBM with high-temperature SPS. Microstructure analysis indicates a mean grain size of ~30 µm. The SPS-sintered fuel pellets show uniformity of chemical stoichiometry and defect structures and almost ideal fluorite structure can be achieved for the fuel pellets as evidenced by the systematic investigation of XRD and micrometer-Raman mapping. XRD spectra on different layers show that the pellets are stoichiometric UO2 and are uniform among all layers. Micro-Raman spectra mapping on the cross-section of the sample was also conducted, showing that the observed bands match well with those reported in the literature and that the sample is in great uniform, i.e., the sample is single-phase stoichiometric UO2. Non-uniformity in grain structure was also identified at different locations across the fuel pellet, and the grain size decreases along the axial and radial directions from the top to the bottom and decreases from the center to the rim, respectively. As the study of the commercial-size UO2 is scarce in the literature, the systematic investigation of the grain size, chemical stoichiometry, and defects provides a thorough picture of understanding the microstructure and micro-chemical evolution across the whole pellet. This work also demonstrates a great potential of using field-assisted SPS as an advanced technology for fabricating nuclear fuels. The rapid consolidation of the dense fuel pellets at relatively lower temperatures and shorter durations with respect to the conventional sintering clearly presents advancement of materials synthesis at a less energy-intensive manner and may hold potentials for consolidation of the nuclear fuels with highly volatile elements, e.g., Am-based fuels and boron (as burnable poisons)-containing oxide fuels.
Acknowledgments
This work is supported by the US Department of Energy, Office of Nuclear Energy under a Nuclear Engineer University Program (award number: DE-NE0008440) and an internal support by Westinghouse Electric Company in developing advanced technology for fuel fabrication.