


Introduction
Since the quality factor (Q) of the triangular patch antenna is high [Reference Garg1], the antenna structure exhibits narrow band response. This inherent limitation of narrow band response of the triangular patch antenna might be a critical requirement for an antenna particularly to receive a narrow band signal in the presence of noise and can be utilized in designing of microstrip filters [Reference Liu, Wang and He2–Reference Hong and Lancaster5]. It is also being used to design microstrip compact array [Reference Luo6–Reference Sumantyo, Ito and Takahashi8] with reduced coupling between adjacent elements. Recently, the triangular patch antennas are being used in designing microstrip sensors [Reference Biswas and Mandal9, Reference Jobs and Rydberg10], ring antennas [Reference Zhang11, Reference Chen12], reconfigurable [Reference Sung13], and multiple input and multiple output antennas [Reference Zhang14]. It can also be used on curved surfaces because of its easy conformability.
The resonant frequency and the input impedance of triangular patch antenna have been investigated by several researchers [Reference Helszajn and James15–Reference Dam and Biswas40] but those articles do not provide any information regarding the probe reactance. So, the works reported in [Reference Helszajn and James15–Reference Dam and Biswas40] is insignificant for probe reactance computation of triangular patch antenna. The current paper is mainly focused on the investigation of probe reactance and its correct estimation. The coaxial probe feeding technique to a single microstrip element or arrays has become very popular and common in practice [Reference Lee and Chen41]. The probe reactance is highly sensitive to its location under the patch and it significantly affects the matching of input impedance [Reference Richards, Lo and Harrison42, Reference Yano and Ishimaru43]. For a co-axial probe feeding technique, the outer conductor of the probe is connected with the ground plane of the antenna and the central conductor connected to the radiating patch by penetrating through the substrate as shown in Fig. 1(a). The excitation of the patch principally occurs through the coupling of the probe current to the patch. The current through a central conductor of the probe creates surface electric current under the patch which produces the electric field. This field provides the probe reactance X F is in series with the patch reactance itself. Therefore, the correct estimation of the probe reactance is very essential to match the input impedance between probe and patch properly.
(a) A schematic diagram of probe-fed equilateral triangular microstrip patch, (b) equivalent resonant parallel R–L–C circuits.

In literatures, various numerical techniques e.g. Green's function [Reference Yano and Ishimaru43–Reference Aberle, Pozar and Birtcher45], Mode matching [Reference Davidovitz and Lo46], Vector Hankel Transform [Reference Chew and Kong47], etc. have been employed to analyze the probe reactance of rectangular and circular patch antenna yielding reasonably accurate results. But the numerical techniques are very complex, rigorous and time consuming in estimation of probe reactance. Harrington [Reference Harrington48] developed a simple formula for the reactance of a current carrying probe within a parallel plate waveguide taking the source as a cylindrical wave function. Due to its simplicity, many researchers have used this formula to analyze the probe reactance. But a group of researchers [Reference Alarjani and Dahele49] have reported that the computed probe reactance employing the Harrington's formula [Reference Harrington48] does not match the measured reactance. In order to match the experimental and theoretical value of the probe reactance, an additional static capacitance was introduced in series with probe reactance [Reference Alarjani and Dahele49]. This modified formulation shows better agreement near resonance at a specific probe location. In these works [Reference Harrington48, Reference Alarjani and Dahele49], the effect of the probe location variation was not considered. Recently, Guha et al. [Reference Guha, Biswas and Siddiqui50] have modified the Harrington's formula [Reference Harrington48] by multiplying it with the field factor to compute the probe reactance of rectangular and circular patch antenna. This model is suitable irrespective of operating frequency and feeds location under the patch. The works reported in [Reference Biswas and Dam33, Reference Maity and Gupta36] are mainly focused on the computation of resonant frequency and input impedance. They have not considered the effect of probe reactance in input impedance computation. The work reported in [Reference Guha, Biswas and Siddiqui50] is focused on rectangular and circular geometry. To the best of our knowledge, neither any design guideline nor any experimental results of the probe reactance of equilateral triangular patch antenna (ETPA) have yet been reported.
We, therefore, propose a very simple and efficient closed-form analytical formula to predict accurately the probe reactance of an ETPA. We have also proposed a set of closed-form expression to determine accurately the resonant frequency and input impedance of an ETPA. This efficient formula is capable to predict accurately the probe reactance for a wide variation of substrate electrical parameters. This formula also computes accurately the probe reactance as a function of frequency and probe location under the patch.
The expressions for this model are introduced in the “Theory” section. We have presented the predicted, measured and simulated results in the “Results and discussions” section. This section also includes the experimental test.
Theory
The probe reactance as a function of frequency may be obtained as [Reference Harrington48]:
 $$X_f (\,f) = \displaystyle{{\eta k_r d} \over {2\pi}} \left[ {\ln \left( {\displaystyle{4 \over {kg}}} \right) - 0.577} \right],$$
where g is the probe diameter, η is the intrinsic impedance of the medium, d is the thickness of the substrate, and k r is the wave number. It is previously mentioned that probe reactance is highly sensitive to its location under the patch and it significantly influences the computation of input impedance. So the computation of probe reactance is incomplete until we incorporate the effect of probe feed location in it. The dependence of X f on the location of the probe from the tip of the patch, defined as ρ in Fig. 1, can be derived as follows [Reference Guha, Biswas and Siddiqui50]:
Figure 1(b) shows an equivalent circuit of a probe-fed patch. Ideally, the patch itself can be looked upon from XX′ and this near resonance can be represented by a simple resistive network as shown in Fig. 2(a).
Equivalent circuits for a microstrip patch fed by a coaxial probe. (a) Near resonance, (b) replacing R(ρ) by I(ρ) near resonance.

The quantity L f is the probe inductance and R(ρ) is the resonant resistance of the microstrip element which varies with ρ as:
 $$R(\rho ) = R_r P_{nml} (\rho ),$$
 $$P_{nml} (\rho ) = \left( {5\pi} \right)^{ - 1} \left[ {\cos \displaystyle{{2\pi l\rho} \over {\sqrt 3 r}} + \cos \displaystyle{{2\pi n\rho} \over {\sqrt 3 r}} + \cos \displaystyle{{2\pi m\rho} \over {\sqrt 3 r}}} \right]^2, $$
where R r is the resonant resistance of the patch. This circuit excited by an RF source will have the voltage–current relation as
 $$V_{YY^{\prime}} = L_f \displaystyle{{dI} \over {dt}} + V_{XX^{\prime}}, $$
where V XX ′ can be expressed for different ρ values as
 $$V_{XX^{\prime}} = I_{\rho 1} R(\rho_1 ) = I_{\rho 2} R(\rho_2).$$
Equation (5) implies that the product of I(ρ) and R(ρ) is constant and the profile of I(ρ) and R(ρ) is complementary to each other that is when I(ρ) increases then R(ρ) decreases or vice versa. So, I(ρ) or R(ρ) anyone can be replaced by other. So, the element R(ρ) can be replaced by a branch current I(ρ), which must follow the complementary profile of R(ρ) [Reference Guha, Biswas and Siddiqui50]. Hence, for ETPA I(ρ) may be represented as
 $$I(\rho ) = I_0 P{\rm ^{\prime}}_{nml}, $$
 $$\eqalign{ P_{nml}^\prime (\rho ) = & {\left( {5\pi } \right)^{ - 1}}\left[ {\cos \pi \,l\left( {{{r/\sqrt 3 - \rho } \over r}} \right) + \cos \pi n\left( {{{r/\sqrt 3 - \rho } \over r}} \right)} \right. \cr & + \cos \pi m{\left( {{{r/\sqrt 3 - \rho } \over r}} \right)^2}, \cr} $$
where I 0 is the current for ρ = 0.
When the element R(ρ) is replaced by the branch current I(ρ), then the equivalent circuit of Fig. 2(a) reduces to a reactive network as shown in Fig. 2(b) [Reference Guha, Biswas and Siddiqui50] and its terminal voltage can be written as
 $$V_{YY^{\prime}} = L_f \displaystyle{{dI(\rho )} \over {dt}}.$$
This equation with the help of (6) reduces to
 $$V_{YY{\rm ^{\prime}}} = L_{\,f,e} \displaystyle{{dI_0} \over {dt}},$$
where L f,e is expressed as
 $$L_{\,f,e} = L_f P_{nml}^{\prime} (\rho ).$$
Equation (10) finally determines the equivalent feed reactance which can account for its variation with the change in ρ. The relation (10) thus can be extended to modify Harrington's formula (1) as
 $$X_f (\,f,\rho ) = X_f (\,f) \times P_{nml}^{\prime} (\rho ).$$
This formula for probe reactance of an ETPA can be used for another triangular patch also. But only the appropriate field factors of the corresponding patch geometries are required.
The wave number k r may be defined as
 $$k_r = \displaystyle{{2\pi} \over {\lambda _{r,nml}}} = \displaystyle{{2\pi f_{r,nml}} \over c},$$
where c is the velocity of light in free space and f r,nml is the resonant frequency. The accurate computation of resonant frequency is required due to accurate computation of probe reactance as a function of frequency. The f r,nml can be computed as [Reference Helszajn and James15]
 $$f_{r,nml} = \displaystyle{{2c} \over {3r_{eff} \sqrt {\varepsilon _{r,\,eff}}}} (n^2 + nm + m^2 )^{1/2}, $$
where c is the velocity of light in free space, ε r,eff is the effective permittivity of the medium below the patch, r eff is the effective side length of the patch and n, m, l are integers which are never zero simultaneously satisfying the condition n + m + l = 0.
In order to determine the r eff, most of the researchers [Reference Helszajn and James15–Reference Biswas and Mandal30, Reference Olaimat and Dib32, Reference Maity and Gupta35–Reference Dam and Biswas40] assumed that all the modes have the same r eff. But the different modes have the different fringing fields. The models reported in [Reference Olaimat and Dib31, Reference Biswas and Dam33–Reference Biswas and Dam34] indicate that the r eff is different for different modes. Thus, the mode dependent r eff is computed from [Reference Biswas and Dam34] as
 $$r_{eff} = r(1 + \gamma q)^{1/2}. $$
In equation (14), q arises due to the fringing field at the edge of the patch and γ is the mode dependent factor. The model reported in [Reference Chen, Lee and Dahele21] has been employed a curve fitting formula for computing r eff and shows a large discrepancy between measured and computed values. Based on the concept employed in [Reference Chen, Lee and Dahele21] we have proposed a curve-fitting formula for q based on experimental results [Reference Dahele and Lee18, Reference Chen, Lee and Dahele21, Reference Biswas and Dam34] available in open literature and HFSS simulation results. This approach shows better agreement with the HFSS and experimental result. The q for this geometry is proposed as
 $$q = q_1 + q_2 - q_{_3}, $$
where
 $$q_1 = 7.146\displaystyle{d \over r} - 16.485\left( {\displaystyle{1 \over {\sqrt {\varepsilon _{re}}}}} \right)\left( {\displaystyle{d \over r}} \right),$$
 $$q_2 = 21.083\left( {\displaystyle{1 \over {\varepsilon _{re}}}} \right)\displaystyle{d \over r} + 10.172\left( {\displaystyle{d \over r}} \right)^2, $$
 $$q_3 = 16.121\left( {\displaystyle{1 \over {\sqrt {\varepsilon _{re}}}}} \right)\left( {\displaystyle{d \over r}} \right)^2, $$
where ε re is the equivalent relative permittivity of the medium below the patch. The ε re for a two-layer structure as shown in Fig. 1(a) may be defined as
 $$\varepsilon _{re} = \displaystyle{{\varepsilon _{r1} \varepsilon _{r2\,} d} \over {\varepsilon _{r1} d_2 + \varepsilon _{r2\,} d_1}}. $$
The fringing field is different for different operating modes of patch due to the field configuration [Reference Biswas and Dam34] under the patch. In order to match the theoretical values with experimental values an empirical mode dependent factor was introduced in [Reference Biswas and Dam34] in the expression of r eff. In this paper, we have also incorporate an empirical mode dependent factor γ in the expression of r eff for better matching between theoretical and experimental values as
 $$\gamma = 0.75^m n^{0.23}, $$
here n and m are the mode indices.
Equation (14) in the present model and equation (6) in [Reference Biswas and Dam34] are basically same. Here the fringing factor p of [Reference Biswas and Dam34] has been replaced by q. In [Reference Biswas and Dam34], p has been determined by equation (7) using the original expression of circular patch by employing an equivalence relation between circular and triangular geometry. In the present paper, we have proposed a new curve-fitting formula to compute q in equations (15)–(18) without employing any equivalence relation. Equation (8) in [Reference Biswas and Dam34] and equation (20) in the present model are empirically proposed mode dependent factors to account the effect of modes in effective side length calculation.
In order to compute ε r,eff for a triangular patch, the triangular patch (side length r) is replaced by the rectangular patch (width W and length L) having an equivalent surface area. On the basis of an equivalence relation, we have
 $$WL = (\sqrt 3 /4)r^2. $$
Now, we equate the zeroth-order resonant frequencies of a rectangular patch and triangular patch without fringing to get
 $$f_{r,10,-1} = \displaystyle{c \over 2L \sqrt{\varepsilon_{re}}} = \displaystyle{2c \over 3r \sqrt{\varepsilon _{re}}}. $$
Thus,
 $$L = (3/4)r.$$
The width (W) of the rectangular patch is obtained from (21) and (23) as
 $$W = (1/\sqrt 3 )r.$$
The ε r,eff for this structure is obtained from [Reference Edwards and Steer51] as
 $$\varepsilon _{r,eff} = \varepsilon _{re} - \displaystyle{{\varepsilon _{re} - \varepsilon _{r,dyn}} \over {1 + G(\,f_a /f_p )^2}}, $$
where G is purely empirical term, ε r,dyn is the dynamic permittivity which depends on the dimensions, equivalent substrate relative permittivity ε re, and field configurations of the mode under study [Reference Wolff and Knoppik52], f a is the frequency without fringing fields and ε re is defined in (19). The G, f a, and f p are computed as
 $$G = \sqrt {\displaystyle{{\varepsilon _{r,\,dyn}} \over {\varepsilon _{re}}}}, $$
 $$f_a = \displaystyle{{2c} \over {3r\sqrt {\varepsilon _{re}}}}, $$
 $$f_p = \displaystyle{{Z(r/d,\,d,\,\varepsilon _{re} )} \over {2\mu _0 d}}$$
 $$Z\left( {\displaystyle{r \over d},\,d,\,\varepsilon _{re}} \right) = \displaystyle{{120\pi} \over {\sqrt {\varepsilon _{rf} (0)}}} \left[ {\displaystyle{r \over {\sqrt 3 d}} + 1.393 + 0.667\,\ln \left( {\displaystyle{r \over {\sqrt 3 d}} + 1.444} \right)} \right]^{ - 1}, $$
 $$\varepsilon _{rf} (0) = \displaystyle{{\varepsilon _{re} + 1} \over 2} + \displaystyle{{\varepsilon _{re} - 1} \over 2}\left( {1 + \displaystyle{{12d} \over {{r / {\sqrt 3}}}}} \right)^{ - 1/2}. $$
The ε r,dyn for this structure is computed from [Reference Wolff and Knoppik52] as
 $$\varepsilon _{r,\,dyn} = \displaystyle{{C_{dyn} (\varepsilon = \varepsilon _0 \varepsilon _{re} )} \over {C_{dyn} (\varepsilon = \varepsilon _0 )}},$$
where C dyn (ε) is the total dynamic capacitance of the condenser formed by the conducting patch and the ground plane separated by a dielectric of permittivity ε. It takes into account the influence of the fringing field at the edge of the patch. The C dyn (ε 0) is the total dynamic capacitance when ε = ε 0. The C dyn (ε) can be written as
 $$C_{dyn} (\varepsilon ) = C_{0,dyn} (\varepsilon ) + C_{e,dyn} (\varepsilon ),$$
here C e,dyn (ε) and C 0,dyn (ε) are the total dynamic fringe and main field capacitance respectively. The total dynamic fringe field capacitance C e,dyn (ε) for this structure is obtained from [Reference Wolff and Knoppik52] as
 $$C_{e,dyn} (\varepsilon ) = \displaystyle{1 \over 2}\left[ {\displaystyle{{Z\left( {r/d,d,\varepsilon _{re} = 1} \right)3r} \over {4cZ^2 \left( {r/d,d,\varepsilon _{re}} \right)}} - C_{0,stat} (\varepsilon )} \right].$$
In (33), C 0,stat is the static main field capacitance and may be obtained as
 $$C_{0,stat} (\varepsilon ) = \displaystyle{{\sqrt 3 \varepsilon _0 \varepsilon _{re} r^2} \over {4d}}.$$
The total dynamic main field capacitance C 0,dyn (ε) is taken for the structure under study as [Reference Wolff and Knoppik52]:
 $$C_{0,dyn} (\varepsilon ) = \gamma _{nm} C_{0,stat} (\varepsilon ),$$
γ nm = 0.3525, for n = 1; γ nm = 0.2865, for n = 2; γ nm = 0.2865, for n = 3.
The accurate computation of input impedance as a function of probe location is required for accurate computation of probe reactance as a function of probe location. The triangular geometry may be treated as a single resonant parallel R–L–C circuit as shown in Fig. 1(b). The input resistance and reactance seen by a coaxial probe located at a distance ρ from tip of the triangle may be computed as [Reference Biswas and Dam34]:
 $$R_{in} = \displaystyle{{R_r P_{nml}} \over {1 + Q_T^2 \left[ {(\,f_{r,\,nml} /f) - (\,f/f_{r,\,nml} )} \right]^2}}, $$
 $$X_{in} = X_f (\,f,\rho ) + \displaystyle{{R_r P_{nml} Q_T \left[ {(\,f_{r,\,nml} /f) - (\,f/f_{r,\,nml} )} \right]} \over {1 + Q_T^2 \left[ {(\,f_{r,\,nml} /f) - (\,f/f_{r,\,nml} )} \right]^2}}, $$
where R r is the input resistance at resonance and it is different for different mode [Reference Lee, Luk and Dahele20, Reference Richards, Lo and Harrison42–Reference Yano and Ishimaru43], Q T is the total quality factor, f r,nml is the mode depended resonant frequency is given by (13), f is the working frequency and P nml is the field factor defined in (3). This is the very simple expression. But the large and rigorous mathematical steps have been employed in [Reference Lee, Luk and Dahele20] for computing the R in and Xin.
Here we have employed a very simple and efficient expression to compute the mode-dependent R r as provided in [Reference Dam and Biswas40] as
 $$R_r = \left[ {\displaystyle{{(0.18 + 0.83^n )} \over {m + 0.6^{nm}}} - 1.6m\left( {n - m} \right)^2} \right]\left( {\displaystyle{{\eta d\lambda _{r,nm} \pi Q_T} \over {\alpha r^2 \sqrt {\varepsilon _{r,eff}}}}} \right).$$
The work reported in [Reference Lee, Luk and Dahele20] has employed different mode dependent value for different modes for computing the input impedance. Here we have also introduced mode dependent factor for computing the input impedance. The first term indicates the mode-dependent factor. The factor α is a constant. The value of α = 7 for right-angled isosceles triangular patch antenna [Reference Dam and Biswas40] and for ETPA we have taken α = √2. η is the intrinsic impedance of the medium, Q T is the total quality factor, λr,nml = c/f r,nml, f r,nml is the mode dependent resonant frequency is given by (13), ε r,eff is given by (25). n and m are the mode indices.
The Q T consists of a quality factor due to radiation loss (Q r), a quality factor due to dielectric loss (Q d), and quality factor due to conductor loss (Q c). The model reported in [Reference Lee, Luk and Dahele20] has been employed rigorous and large mathematical steps for computing the different losses. But here we have proposed very simple formulas to compute the loss factors. The Q T is defined as
 $$Q_T = \left( {\displaystyle{1 \over {Q_r}} + \displaystyle{1 \over {Q_d}} + \displaystyle{1 \over {Q_c}}} \right)^{ - 1}. $$
The accurate computation of Q r is very important because it determines the radiation efficiency. The computation of Q r is very complex for triangular patch antenna due to its geometry. The Q r depends on mode and field configuration under the mode [Reference Garg1]. Here we have taken a very simple and efficient expression to compute Q r as proposed in [Reference Abboud, Damiano and Papiernik53, Reference Derneryd54] and added a mode dependent correction factor. So, the final expression of Q r as
 $$Q_r = \left[ {\left\{ {2(n + 0.6nm) - 1} \right\}^{0.6} - \displaystyle{{1.31(n - 1)} \over {(n - 0.6)}}} \right]\displaystyle{{\beta D(\delta )\varepsilon _{re}} \over {\mu _0 f_{r,nml} d}},$$
where the first term is the mode-dependent factor. The factor β is a constant. The value of β = 21.15 for circular patch antenna [Reference Abboud, Damiano and Papiernik53, Reference Derneryd54] and we have employed β = 30 for ETPA. ε re is defined in (19), f r,nml is given by (13), D(δ) is the directivity and n and m are the mode indices.
Here we have proposed a new curve fitting formula for computing the directivity of the structure under study based on simulation and experimental results as
 $$\eqalign{D(\delta ) = &3.194 - 0.482\delta + 3.042\delta ^2 - 3.213\delta ^3 + 4.924\delta ^4 \cr &- 1.526\delta ^5,} $$
where
 $$\delta = \displaystyle{{\pi f_{r,\,nml}} \over {2f_{0,\,nml} \sqrt {\varepsilon _{re}}}}, $$
and
 $$f_{0,nml} = \displaystyle{{2c} \over {3r\sqrt {\varepsilon _{re}}}} (n^2 + nm + m^2 )^{1/2}. $$
The quality factor due to conductor loss Q c, can be expressed as
 $$Q_c = \displaystyle{{\pi \sqrt {\varepsilon _{r,eff}}} \over {\lambda _{r,nml\,} \alpha _c}} $$
α c is the conductor loss and obtained from [Reference Pozar55] as
 $$\alpha _c = \displaystyle{{R_s} \over {Z\left( {\displaystyle{r \over d},d,\varepsilon _{re}} \right)r/\sqrt 3}}, $$
 $$R_s = \sqrt {\displaystyle{{\pi \,f_{r,nml} \mu _0} \over \sigma}}, $$
where σ is the conductivity and other variables have usual meaning. Q d for this structure can be computed as
 $$Q_d = \displaystyle{1 \over {\tan \,\delta _e}}, $$
where tanδ e is the equivalent loss tangent of a triangular patch on two dielectric layers may be defined as
 $$\tan \delta _e = \displaystyle{{h_1 \varepsilon _{r1} \tan \delta _1 + h_2 \varepsilon _{r2} \tan \delta _2} \over {h\varepsilon _{re}}}. $$
Results and discussions
Antenna design and experimental tests
A number of prototypes of different r has been etched on different substrates like (i) Rogers with ε r2 = 2.4, d 2 = 0.8265 and 1.58 mm, tanδ 1 = 0.0022; (ii) Glass epoxy with ε r2 = 4.4, d 2 = 1.63 mm, tanδ 1 = 0.02; and (iii) Arlon with ε r2 = 10.0, d 2 = 1.63 mm, tanδ 1 = 0.0035. One of the fabricated prototypes is shown in Fig. 3. The patch was excited with a coaxial probe whose diameter g = 1.24 mm. To validate the models developed in the “Theory” section, we have performed a series of experiments using Network Analyzer Agilent- E5071B. Here, we have presented the theoretically predicted, simulated, and measured results for the feed reactance, resonant frequency, and input impedance of an ETPA.
Snapshot of a fabricated prototype of the tested antenna.

Probe reactance
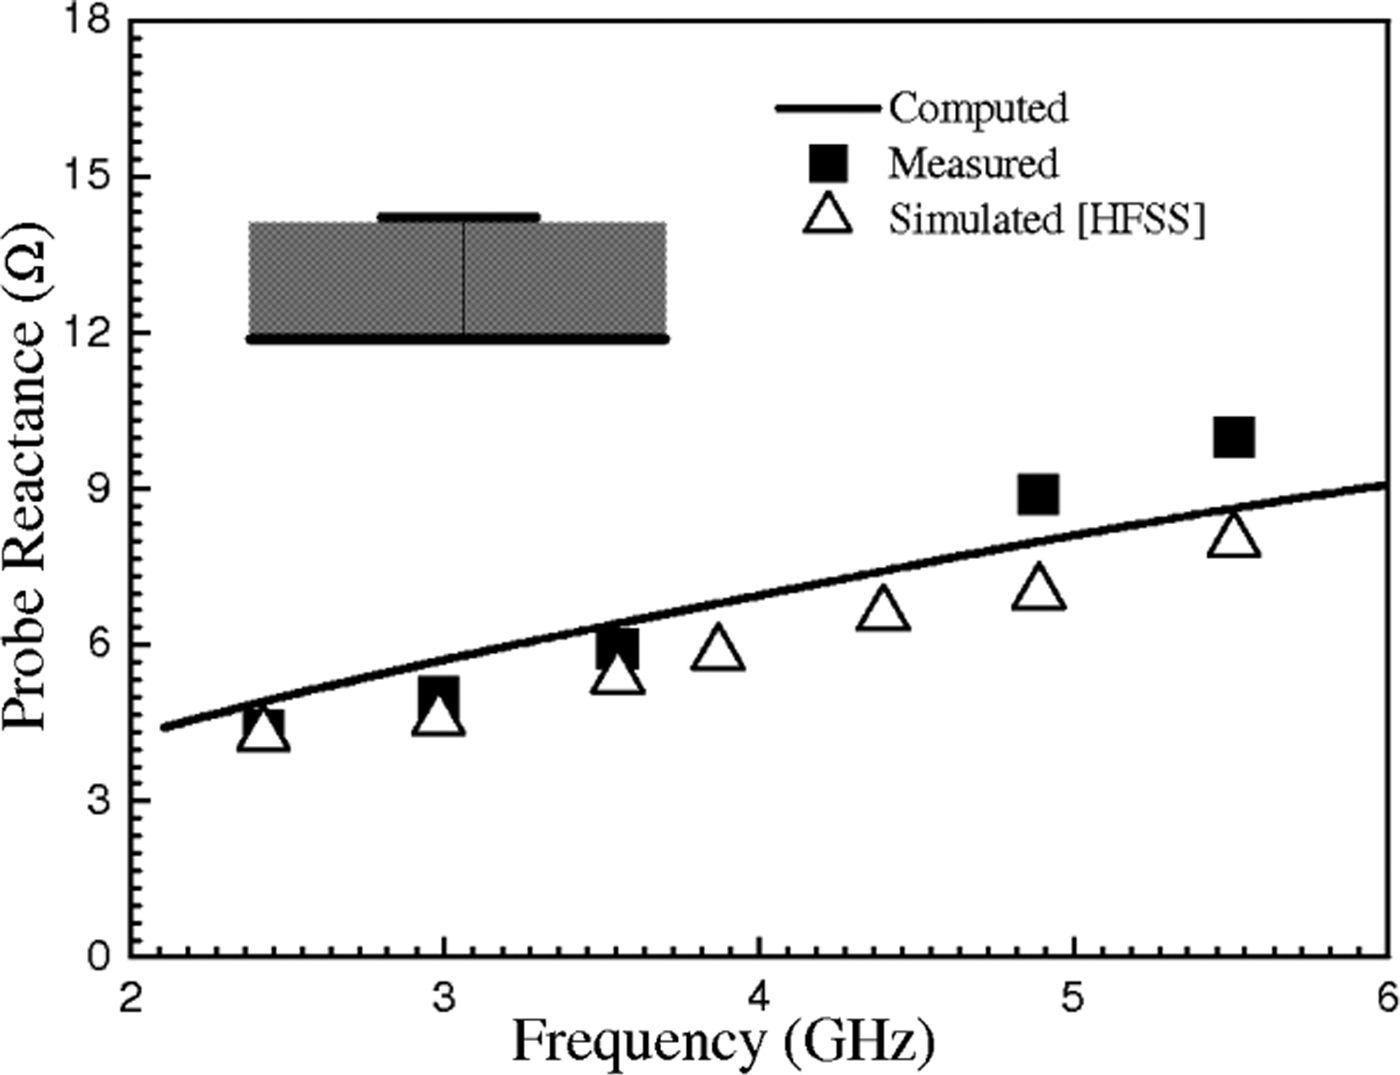
In Fig. 4, we have compared the computed probe reactance X f as a function of frequency employing the model with our experimental and simulation [56] results for an equilateral patch on single substrate and close agreement is revealed between them. The theoretical frequency is obtained by employing (13). The change in resonant frequency is obtained by changing side length r keeping all the antenna parameters unchanged. For each frequency, we have estimated the corresponding r. The 50 Ω probe location under the patch for every r is determined by employing (36). The probe reactance increases with the increase of frequency.
Experimental, simulation and theoretical variation of probe reactance as a function frequency. ε re = ε r2 = 2.4, tanδ e = tanδ 2 = 0.0022, d = d 2 = 0.8265.
The variation of X f as a function of probe position ρ for an equilateral patch on a single substrate having different r is depicted in Fig. 5. Here we have compared the computed X f with simulation and our experimental results. The computed reactance curves well agree with the measured and simulated results. This study shows that the probe reactance increases with the decrease of r. When the side length r of the patch increases then the frequency of that patch decreases, as a result the probe reactance X f decreases.
The effect of probe reactance X f on input impedance is depicted in Fig. 6. Here measured input impedance is compared with the computed input impedance curve employing the model with and without probe reactance. From this study, a discrepancy is observed between measured and computed input impedances when probe reactance X f is not considered but the close agreement is seen between measured and computed input impedances when probe reactance X f is considered.
Computed, measured and simulated variation of probe reactance as a function of probe location for different side length. ε re = ε r2 = 2.4 tanδ e = tanδ 2 = 0.0022, d = d 2 = 0.8265. # Antenna I (r = 22 mm); # Antenna II (r = 35 mm); # Antenna III (r = 70 mm).

Theoretical and experimental input impedance of an ETPA. r = 35 mm, d = d 2 = 0.8265, ε re = ε r2 = 2.4, ρ = 16.8, tanδ e = tanδ 2 = 0.0022.

In Fig. 7, authors present the variation of X f as a function of probe location ρ under the patch for an equilateral patch on a single substrate having different substrate thickness d. Here we have compared the computed X f with simulated [56] and close agreement is revealed between them.
Computed and simulated variation of probe reactance as a function probe location for different substrate thickness. r = 42 mm, ε re = ε r2 = 2.4, tanδ e = tanδ 2 = 0.0022. # Antenna I (d = d 2 = 0.79 mm); # Antenna II (d = d 2 = 1.58 mm); # Antenna III (d = d 2 = 3.16 mm).

The variation of X f as a function of d for an equilateral patch is visualized in Fig. 8. In this study first we have determined the 50 Ω probe position under the patch for every d and then calculate the X f. The X f increases with increase of d. If the thickness of the substrate d increases, the length of the probe increases, the spurious radiation from the probe increases, the surface wave power increases and thus the probe reactance increases. Here the computed curve is compared with the HFSS simulated results. The slight discrepancy is observed for higher thickness. This is due to the fact that the Harrington's formula is well valid for small d/λ 0.
Computed and simulated variation of probe reactance as a function substrate thickness. Parameters as in Fig. 7.

The variation of X f with the variation of ρ for different ε re of an equilateral patch on a single substrate is depicted in Fig. 9. In this study, we have compared the computed X f curves with HFSS [Reference Abboud, Damiano and Papiernik53] simulation results. The computed curves well support the simulation results.
Computed and simulated variation of probe reactance as a function feed location for different dielectric constant. r = 42 mm, d = d 2 = 1.58 mm, tanδ e = tanδ 2 = 0.0022. # Antenna I (ε re = 2.4); # Antenna II (ε re = 9.8).

In Fig. 10, we present the variation of X f as a function of ε re. The X f decreases with the increase of ε re. Here we have first estimated the 50 Ω probe position under the patch and then calculate the probe reactance. If the relative permittivity of the substrate ε re increases, fringing field effect decreases, unwanted radiation from the probe decreases, and surface wave power decreases as a result the probe reactance decreases. The computed curve compared with the simulated curve and very close agreement is observed between them for all values of ε re.
Computed and simulated variation of probe reactance as a function of the dielectric constant of the substrate. Parameters as in Fig. 9.
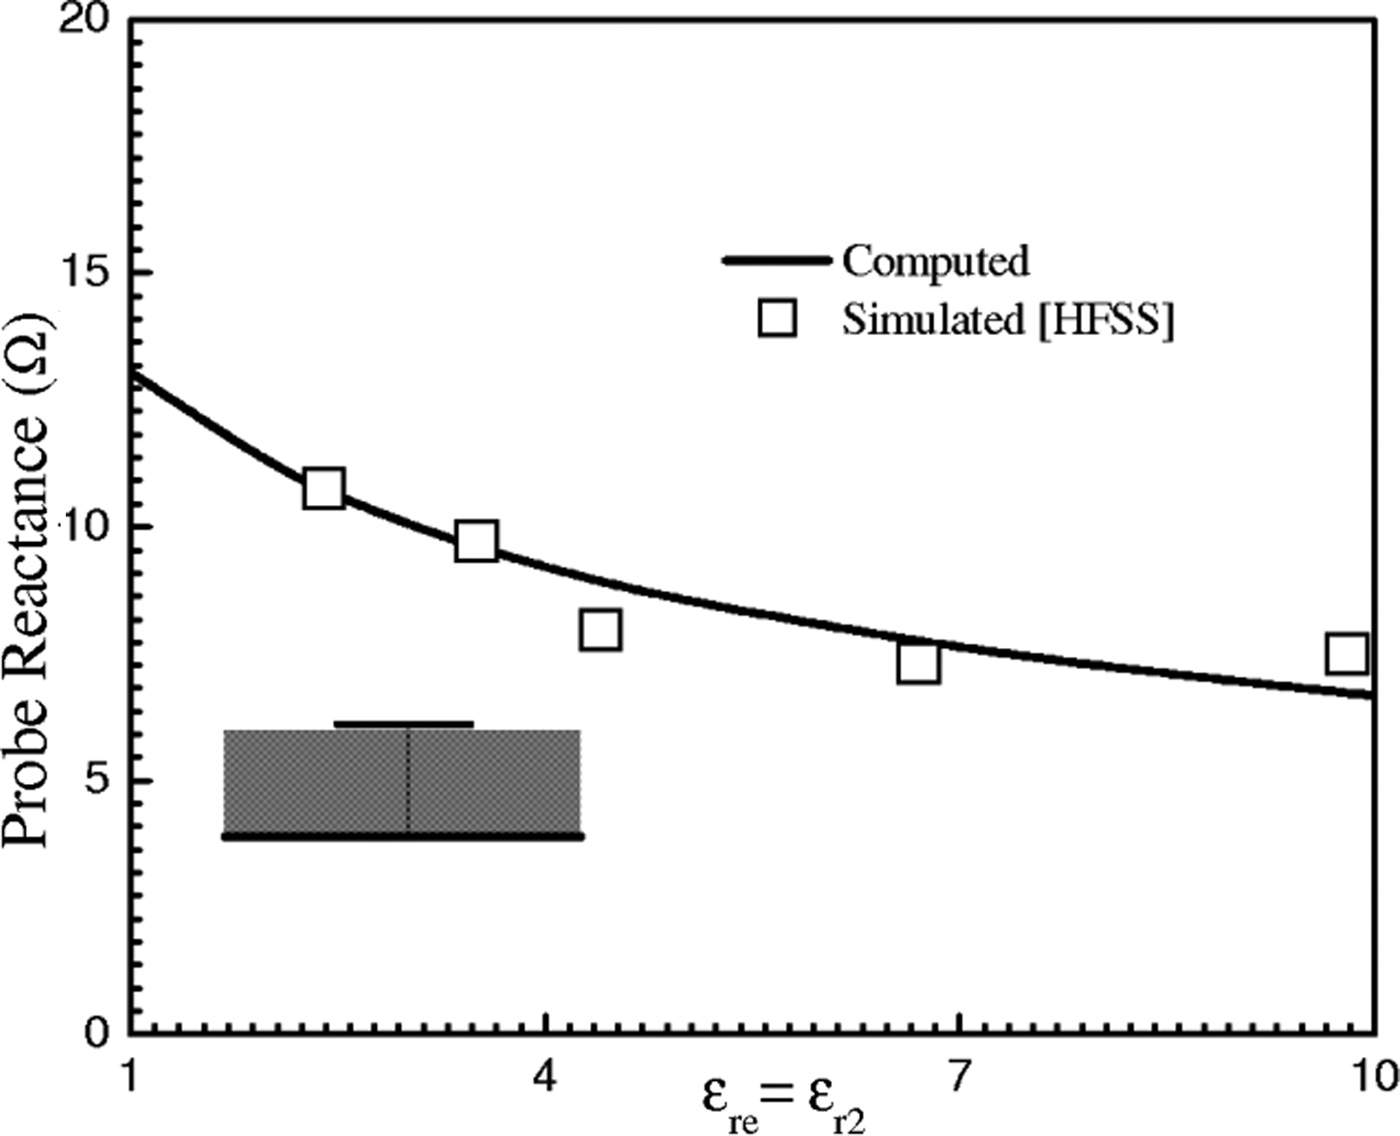
Figure 11 shows the variation of X f as a function of r. The X f decreases with the increase in r. The computed X f is compared with simulated and our measured results. The close agreement is observed between them. Thus, the model is valid for a patch whose side length is varied from low to high value.
Computed, simulated and measured variation of probe reactance as a function of side length r. ε re = ε r2 = 2.4, d = d 2 = 0.8265 mm, tanδ e = tanδ 2 = 0.0022.

The effect of composite and suspended substrate on X f is depicted in Fig. 12. For suspended substrate, the X f is increased with the increase of d 1 whereas X f decreases with the increase of d 1 for the composite substrate. The computed curves well support with the simulated results for all d 1/d. The effective permittivity for a composite substrate is enhanced, fringing field effect decreases, surface wave power decreases so the probe reactance decreases. The exactly opposite phenomena occur for the suspended substrate.
Computed and simulated variation of probe reactance as a function of suspended (ε r1 = 1.0, tanδ 1 = 0.000) and composite (ε r1 = 9.8, tanδ 1 = 0.0035) substrate thickness. r = 42 mm, ε r2 = 2.4, tanδ 2 = 0.0022.

Now it is clear from the above studies in Figs 4–12 that X f increase with the increase of thickness d and frequency f. X f decreases with the decrease of side length r and relative permittivity ε re. This information is very useful for practical implementation of the ETPA.
Validity of resonant frequency
In Table 1, we have compared the computed resonant frequencies employing the present model with simulation [56, Reference Mittra and Yu57] and our experimental results for an equilateral patch on two dielectric layers operated in dominant and higher order modes. The total average error of the present model is computed against the simulated and measured results. The total average % errors are 1.782, 0.697, and 1.313 against experimental, HFSS, and CFDTD simulation results, respectively. From this comparison we observe that the error in the model against experimental results is slightly high. This is due to the fact that a tiny air gap may be present between two dielectric layers and this cannot be avoided.
Theoretical, software computational, and experimental resonant frequencies for an equilateral triangular patch on two layers composite substrate operated in different modes. 

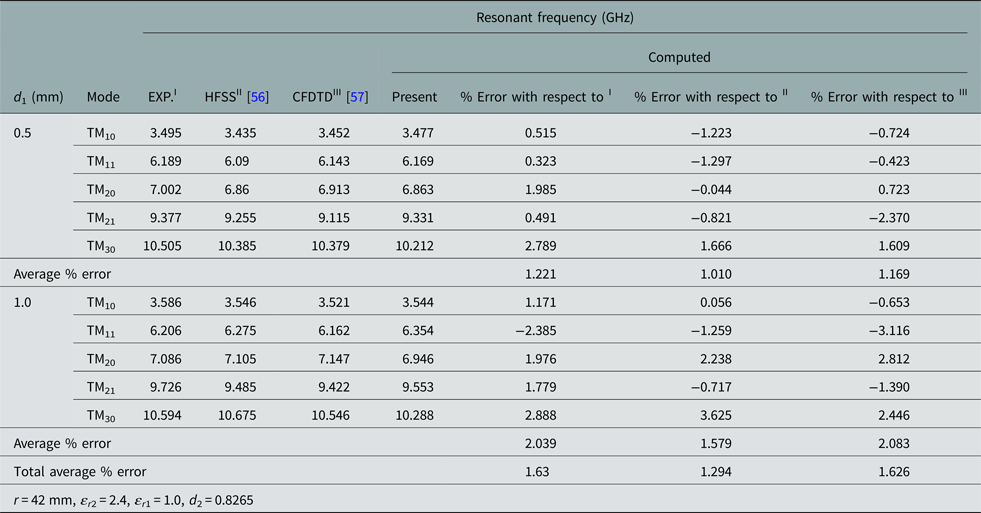
A comparison of simulated [56, Reference Mittra and Yu57] and our measured resonant frequencies with computed values for an equilateral patch on suspended substrate operated in dominant and higher order modes is presented in Table 2. The total average percentage errors are 1.63, 1.294, and 1.626 against experimental, HFSS, and CFDTD simulation results, respectively.
Theoretical, software computational and experimental resonant frequencies for an equilateral triangular patch on suspended substrate operated in different modes. 
In Table 3, we compare the computed resonant frequencies employing the model with simulated and our measured results for an equilateral patch printed on a single substrate operated in dominant and higher order modes. The total average percentage errors are 0.864, 0.930, and 0.922 against experimental, HFSS, and CFDTD simulation results, respectively.
Theoretical, software computational and experimental resonant frequencies for an equilateral triangular patch on single substrate operated in different modes. 

I Experiment.
II HFSS.
III CFDTD.
From Tables 1–3, we conclude that the present model very accurately computed the resonant frequencies against HFSS, CFDTD simulation, and our experimental results.
Now the accuracy of the present model is verified against the other measured results [Reference Dahele and Lee18] in Table 4. Here the measured resonant frequencies obtained from [Reference Dahele and Lee18] are compared with different theoretical models reported in [Reference Gang19, Reference Chen, Lee and Dahele21, Reference Karaboğa24, Reference Guha and Siddiqui27, Reference Nasimuddin and Verma28, Reference Olaimat and Dib31] and in this work for an equilateral patch printed on a low dielectric constant substrate operated in dominant and higher order modes. This comparison shows that present model more accurately computed the resonant frequencies.
Theoretical and experimental values of resonant frequencies of an ETPA on single substrate operated in different.  r = 100 mm, ε re = ε r2 = 2.32, d = d 2 = 1.59 mm, ρ = 3 mm.

From the above comparison in Tables 1–4 it is clear that the present formulae based on cavity model are valid for a wide variation of substrate permittivity; patch side length and substrate thickness. But the slight discrepancy is observed for a patch having very smaller side length or larger substrate thickness. Because the accuracy of the present model mainly depends on the value of h/λ 0 and it is well suitable for a small value of h/λ 0. This is not the limitation of the present model but it is the inherent limitation of the cavity model.
Validity of input impedance
A comparison of theoretically predicted input impedance with our measured results for an equilateral patch printed on a suspended substrate is depicted in Fig. 13. The computed curve for input impedance is close to the measured results.
Measured and computed dominant mode input impedance as a function of frequency for a probe-fed equilateral triangular patch on suspended substrate having d 1 = 0.45 mm d 2 = 1.58 mm, r = 42 mm, ε r1 = 1.0, ε r2 = 2.4, tanδ 1 = 0.0, tanδ 2 = 0.0022, ρ = 19.20 mm.

The accuracy of the model is further verified with other measured results [Reference Lee, Luk and Dahele20] in Table 5. Here we compare the computed input impedance employing the present model and model reported in [Reference Lee, Luk and Dahele20] with experimental results [Reference Lee, Luk and Dahele20] for an equilateral triangular patch operated in dominant and higher order modes. Here we consider an equilateral patch having side length r = 100 mm printed on a substrate whose d = 1.59 mm, ε re = 2.32, tanδ e = 0.0005, d/λ r = 0.0068 and probe is located as a distance ρ = 3.0 mm from the tip of the triangle. The present model shows very less error compared to the model reported in [Reference Lee, Luk and Dahele20].
Experimental theoretical values of resonant frequency and input impedance of an ETPA on single substrate operated in different modes.  r = 100 mm, ε r2 = 2.32, d = d 2 = 1.59, ρ = 3.0 mm.

Conclusion
The radiated power and impedance bandwidth of an ETPA mainly controlled by the input impedance. For probe-fed patch antenna, the total input impedance consists of the probe reactance in series with the patch impedance. Good models for calculating patch impedance are available, but to the best of our knowledge no model is available to compute probe reactance of an ETPA. For the first time, a very simple and efficient formula is proposed to accurately predict the probe reactance of an ETPA. To overcome the drawback of earlier models as discussed detail in the “Introduction” section, we have introduced the field factor in the Harrington's formula. This efficient formula is capable of predicting accurately the probe reactance for a wide variation of substrate electrical parameters, antenna dimension, and probe position under the patch. Present theoretical analysis shows excellent agreement with our measured results. We have also employed electromagnetic software to validate the model.
 Manotosh Biswas was born in West Bengal, India, in 1976. He received his B.Tech., M.Tech., and Ph.D. degrees in Radiophysics and Electronics from the University of Calcutta, India, in 2001, 2003, and 2008, respectively. Dr Biswas obtained the Young Scientist Award from URSI in 2005 and is a senior member of IEEE. He started his carrier in the Department of Electronics, West Bengal State University, India as a Reader in February 2009. In July 2010, he joined as a Reader in the Department of Electronics & Tele-Communication Engineering, Jadavpur University, India and currently he is serving as an Associate Professor at the same University. His research interest includes Planner Antennas, Dielectric Resonator Antennas, and metamaterials. He has published more than 26 technical journal articles and 50 technical conference proceedings articles.
 Mihir Dam was born in Kolkata, India, on January 1, 1983. He received the M.Sc. degree in Electronic Science in 2006 and the M.Tech. degree in Radiophysics and Electronics in 2007 from Calcutta University, India. He is currently working toward the Ph.D. degree at Jadavpur University in the field of Microstrip patch antennas. At the same time, he is also working as an Assistant Professor in the Department of Electronics, Vidyasagar College for Women. He has published more than five technical journals and more than 14 technical conference articles.



