1. Introduction
Liquefied natural gas (LNG) is currently a favoured energy choice by many industries owing to LNG not only producing negligible NOx and SOx emissions but also offering a reduction in CO2 emissions of around 20% when compared with residual fuel oil (Calderón et al., Reference Calderón, Illing and Veiga2016). These characteristics make LNG a significant player in the global energy mix (Economides and Wood, Reference Economides and Wood2009; Aguilera, Reference Aguilera2014) with LNG demand forecasts projecting an estimated 40% increase in the next 20 years (International Energy Agency, 2018). At the same time, the global LNG trade has been steadily increasing, with 2017 seeing a 12% year-on-year growth in trading (International Gas Union, 2018). This has been driven largely by environmental issues, low production costs of LNG, and addition of emerging markets (Varahrami and Haghighat, Reference Varahrami and Haghighat2018).
Based on the growth forecast for the global natural gas trade, it is expected that the LNG carrier (LNGC) fleet will grow significantly in the coming decades (International Energy Agency, 2018; Shaton et al., Reference Shaton, Hervik and Hjelle2019). This will make the LNGC fleet a significant and relevant segment of maritime transport (UNCTAD, 2018). As of the end of 2018, the LNGC fleet consisted of 525 ships with a projected order book of 128 newbuilds from January 2020 (International Gas Union, 2019; Information Handling Services Markit, 2020). The LNGC fleet is unique in having a diversity of propulsion systems, ranging from conventional steam turbines that provide propulsive and auxiliary power (accounting for 47% of the LNGC fleet in 2018) to modern two-stroke dual-fuel engines with gas injection (Chang et al., Reference Chang, Rhee, Nam, Chang, Lee and Jeong2008; Lin et al., Reference Lin, Yu and Guan2014; Ekanem Attah and Bucknall, Reference Ekanem Attah and Bucknall2015).
LNG is transported at −162°C and slightly above atmospheric pressure, occupying a volume 600 times smaller than at standard temperature and pressure, resulting in a higher energy density. Although LNGC cargo tanks are thermally insulated, a certain amount of heat is transferred to the tank, resulting in a continuous evaporation process that increases the tank pressure (Dobrota et al., Reference Dobrota, Lalić and Komar2013; Krikkis, Reference Krikkis2018). To control the tank pressure the evaporated LNG is vented off, known as boil-off gas (BOG). The BOG can be used as fuel to cover the energy demand or disposed of by producing steam dumped to the main condenser. The steam turbine propulsion system (STPS) has historically been the preferred choice for LNGCs due to its simplicity and associated safety in terms of cargo management (Chang et al., Reference Chang, Rhee, Nam, Chang, Lee and Jeong2008; Afon and Ervin, Reference Afon and Ervin2012; Ekanem Attah and Bucknall, Reference Ekanem Attah and Bucknall2015). The boilers on an STPS can operate simultaneously on residual oil (RO) or distillate oil (DO), and use BOG fed through centrifugal compressors (Fernández et al., Reference Fernández, Gómez, Gómez and Insua2017). The steam produced is fed to the main turbine for propulsion, to turbo-generators and feed pumps for auxiliary demand, and to evaporators for fresh water (Mrzljak et al., Reference Mrzljak, Poljak and Medica-Viola2017).
Studies focusing on operating profiles and energy performance are found to overlook the nuanced differences of the LNGC, leading to some inaccuracies. One example is the quantification of ship emissions from automatic identification system (AIS) data, which is a widely accepted method based on ship activity (Kano and Namie, Reference Kano, Namie, Ehlers, Asbjornslett, Rodseth and Berg2014; Coello et al., Reference Coello, Williams, Hudson and Kemp2015; Jalkanen et al., Reference Jalkanen, Johansson and Kukkonen2016; Smith et al., Reference Smith, Raucci, Haji Hosseinloo, Rojon, Calleya, Suarez de la Fuente, Wu and Palmer2016; Olmer et al., Reference Olmer, Comer, Roy, Mao and Rutherford2017; Yu et al., Reference Yu, Zhou and Wang2018; Moreno-Gutiérrez et al., Reference Moreno-Gutiérrez, Pájaro-Velázquez, Amado-Sánchez, Rodríguez-Moreno, Calderay-Cayetano and Durán-Grados2019). Models based on AIS data approximate ship operational and energy performance using technical assumptions. The variability in the quality of these assumptions produces a diverse set of results from ship performance studies (Nunes et al., Reference Nunes, Alvim-Ferraz, Martins and Sousa2017; Merien-Paul et al., Reference Merien-Paul, Enshaei and Jayasinghe2018).
Continuous monitoring (CM) systems record sensor data and handle the ship performance information coming from different on-board systems. They measure performance parameters to a high level of accuracy transparently. Normally, CM data from a single ship is used as the basis to create predictive performance models that allow for more efficient ship operation (Petersen et al., Reference Petersen, Jacobsen and Winther2012; Coraddu et al., Reference Coraddu, Oneto, Baldi and Anguita2017; Soner et al., Reference Soner, Akyuz and Celik2018; Gonzalez and Lara Arango, Reference Gonzalez, Lara Arango and Bertram2019). At the fleet level, the analysis and mining of CM datasets can extract valuable information and relationships regarding fleet operation and performance (Dalheim and Steen, Reference Dalheim and Steen2020). Moreover, the high levels of telemetry are helpful towards improving management and deployment of the fleet (Wang et al., Reference Wang, Yan, Yuan, Jiang, Lodewijks and Negenborn2017). Christensen et al. (Reference Christensen, Thomas, Calleya and Nielsen2018) characterised operational factors, such as trim and crew, from six container ship CM systems to gain a better understanding of their impact on fuel consumption.
This work aims to provide a deep understanding of how STPSs operate. It does so by analysing the main performance characteristics of 40 STPSs for over a year. The studied sample consisted of about 16⋅5% of the fleet as of 2018 (International Gas Union, 2019). This work represents an important empirical contribution to the field of marine engineering as it is, to the best of our knowledge, the only comprehensive work on the steam-powered LNGC fleet. The results obtained from this study will become the empirical basis for future research work in modelling and simulation on LNGC, improving the quality of technical assumptions and unlocking future improvement on energy efficiency and emission inventories.
2. Methodology
2.1. General overview
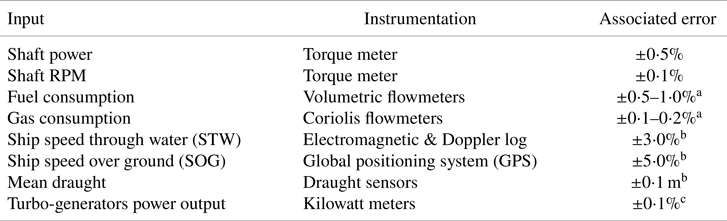
The methodology analysed CM data from steam-powered LNGCs, collected by different on-board sensors (Table 1), coupled with operative assumptions that allow the study of how these ships operate. This work is built on more than 350,000 hourly observations between the end of 2016 and the beginning of 2018 from 40 LNGCs.
Instrumentation used for measuring the inputs in this study

Notes
a Hunsucker et al. (Reference Hunsucker, Przelomski, Bashkoff and Dixon2018).
b International Organization for Standardization (2016).
c Datum Electronics Limited (2018).
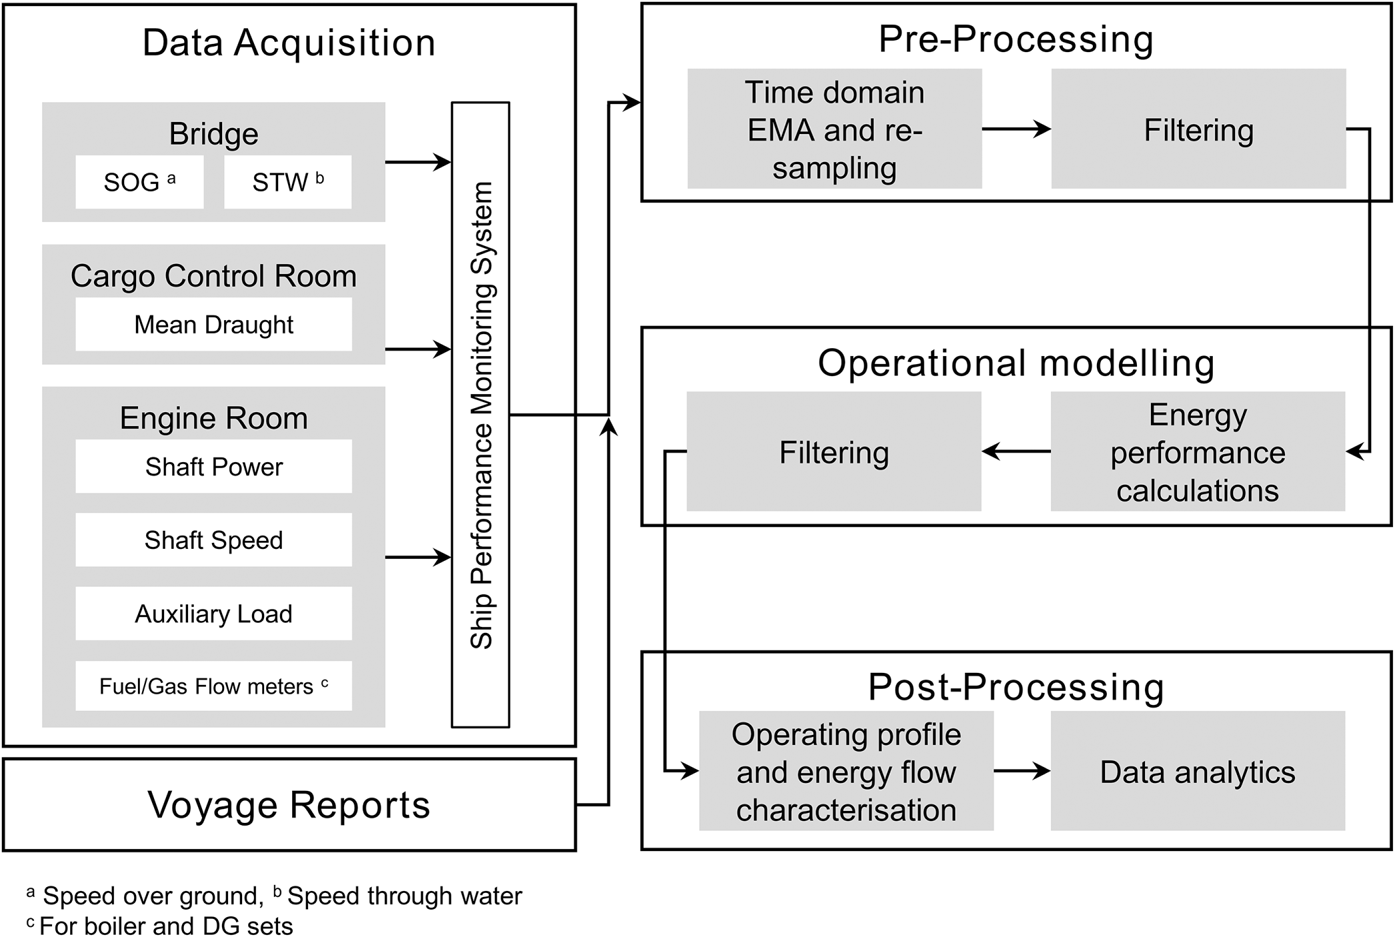
As depicted in Figure 1, the methodology can be divided as follows: data acquisition, voyage reports, pre-processing, operational modelling and post-processing.
Data acquisition and processing flowchart

2.2. Data acquisition
Data acquisition involved the recording and storage of data produced by the sensors, as shown in Table 1. The CM system receives data from the different systems and averages it every 15 seconds, applying an exponential moving average between loggings.
2.3. Voyage reports
It was detected from the mean draught data that draught sensors recorded severe fluctuations due to the ship movements (e.g. pitch), type of sensors – normally pressure strain sensors – and their location, seasonal changes and lack of maintenance (Zheng et al., Reference Zheng, Huang and Ye1999). Voyage reports containing dates and loading condition from the Information Handling Services (IHS) database were merged with the CM data to improve voyage definition (Information Handling Services Markit, 2018).
2.4. Pre-processing
During the pre-processing stage, data collected by CM were averaged for one-hour periods (arithmetical average). This generated a total of 357,315 hourly observations per input (e.g. shaft power) (Supplementary data) . The resulting dataset was then cleaned with primary filtering (e.g. abnormal hourly fuel consumption and speeds above 30⋅0 kn), which eliminated 1⋅60% of the initial CM dataset with the largest filtering, 10⋅62%, for abnormal mean draught readings. For certain voyages, it was not possible to determine loading condition or there was very poor AIS coverage, which led the authors to eliminate the whole voyage.
2.5. Operational modelling
2.5.1. Power
Steam-powered LNGCs mainly use steam to supply energy to the different consumers on-board such as turbo-generators. Additionally, auxiliary combustion engines, that operate with fuel oil (FO), support the on-board electrical demand. The main boiler's power input  $({\dot{W}_{in,b}})$ can be provided by the different fuels available on-board. The following equations are used to estimate
 ${\dot{W}_{in,b}}$:
 \begin{align} {{\dot{W}}_{in,b}} &= \dfrac{{A + B + C + D}}{{3,600}} \end{align}
 \begin{align} A &= {M_{FO}} \cdot [{LH{V_{FO}} + C{P_{FO}} \cdot ({{T_{FO}} - T{A_{in}}} )} ] \end{align}
 \begin{align} B &= {M_{SA}} \cdot ({{h_{SA}} - {h_{cs}}} ) \end{align}
 \begin{align} C &= {M_a} \cdot ({{h_{a1}} - {h_{a0}}} ) \end{align}
 \begin{align} {M_a} &= 15.5 \cdot ({{M_{FO}} + {M_{BOG}}} ) \end{align}
 \begin{align} D &= {M_{BOG}} \cdot [{LH{V_{BOG}} + C{P_{BG}} \cdot ({{T_{BG}} - T{A_{in}}} )} ] \end{align}
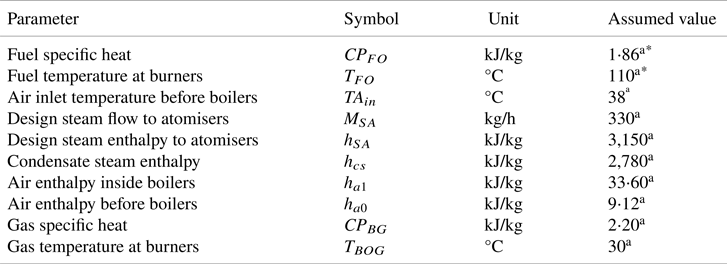
where A is the energy input by the combustion of the liquid fuel, B is the energy added by the steam for atomising the fuel in the boiler's burners, C is the amount of air needed for the combustion process, and D is the energy added by the BOG combustion. From Equations (2)–(6), MFO is the boiler's hourly liquid FO – RO or/and DO – consumption given by the CM, LHVFO is the fuel's lower heating value (LHV) according to Table 2. The specific heat of FO is represented by CPFO, TFO is the fuel temperature at the boiler's burners, TAin is the air inlet temperature before entering the boilers, MSA is the assumed design steam flow to the atomisers. The air consumed inside the boilers is represented by Ma, hSA is the design steam enthalpy at the atomisers, hcs corresponds with the condensate steam enthalpy, ha0 and ha1 are the air enthalpies before and inside the boilers respectively. The total BOG mass burnt is represented by MBOG. LHVBOG is the LNG's LHV, CPBG is the boiler's exhaust gas specific heat and TBOG is the gas temperature at the boiler's burners. It is important to highlight that LHVBOG has been assumed constant since the general composition of the cargo at the moment of loading and unloading was not recorded. A BOG composition model such as the one seen in Dimopoulos and Frangopoulos (Reference Dimopoulos and Frangopoulos2008) is outside the scope of this work. The assumed values used in the previous equations are presented in Table 3.

Additional values assumed for fuels and ship systems

In an STPS there are two ways of warming up the air before it enters the boilers: (1) steam air heaters, which are heat exchangers that use steam to heat the air, and (2) gas air heaters (GAH) where the air is heated up by the exhaust gases. For this reason, Equation (3) is set to zero when the steam vessels use GAH – only four ships are equipped with GAH.
The power input from the diesel generators (DG) is given by the following expression:
 \begin{equation}{\dot{W}_{in,DG}} = \frac{{\sum\nolimits_i {{M_{FO - DG,i}}\cdot LH{V_{FO,i}}} }}{{3,600}}\end{equation}
where  ${\dot{W}_{in,DG}}$ is the DG power input, MFO-DG is the FO consumed by the DG (provided by the CM) and i represents the type of FO being consumed (i.e. residual or distillate).
The power consumption  $({\dot{W}_{out}})$ is captured by the following equation:
 \begin{equation}\begin{array}{* {20}{c}} {{{\dot{W}}_{out}} = {{\dot{W}}_s} + {{\dot{W}}_{TG}} + {{\dot{W}}_{DG}} + {{\dot{W}}_{FPT}}} \end{array}\end{equation}
where  ${\dot{W}_s}$,
 ${\dot{W}_{TG}}$ and
 ${\dot{W}_{DG}}$ are the power take-off by the steam turbine, turbo-generators and DG, respectively, as provided by the CM. The turbo-feed pump power consumption
 $({\dot{W}_{TFP}})$ is the power required to supply the boilers with water. For this variable, there are no sensors on-board to measure the power consumed, hence a simplified method based on quadratic fits – developed from several steam turbines’ heat balances at different loads – was used (Kyma, Reference Kyma2018):
 \begin{equation}\begin{array}{* {20}{c}} {{{\dot{W}}_{TFP}} ={-} 0.28 \cdot \%MCR_s^2 + 57.68 \cdot \%MC{R_s} + 990.46} \end{array}\end{equation}
where %MCRs refers to a steam turbine's maximum continuous rating (MCR) percentage. The MCR for the ship's power systems is given by the following general equation:
 \begin{equation}\begin{array}{* {20}{c}} {\%MC{R_i} = \dfrac{{{{\dot{W}}_{out,i}}}}{{{{\dot{W}}_{MCR,i}}}} \cdot 100} \end{array}\end{equation}
where %MCR is the system's loading,  ${\dot{W}_{out,i}}$ is the on-board system's delivered power and i represents the particular ship system. The maximum output power is represented by
 ${\dot{W}_{MCR,i}}$ and obtained from IHS (Information Handling Services Markit, 2018).
Steam at lower pressures and temperatures is fed to other auxiliary systems such as deaerators and desuperheaters, among others (Mrzljak et al., Reference Mrzljak, Prpić-Oršić and Senčić2018; Mrzljak and Poljak, Reference Mrzljak and Poljak2019). These auxiliary systems are outside the scope of this work.
2.5.2. Overall efficiency
The overall efficiency (ηT) of the STPS is described by the following equation:
 \begin{equation}\begin{array}{* {20}{c}} {{\eta _T} = \dfrac{{{{\dot{W}}_{out}}}}{{{{\dot{W}}_{in,b}} + {{\dot{W}}_{in,DG}}}} \cdot 100} \end{array}\end{equation}
2.5.3. Operating modes
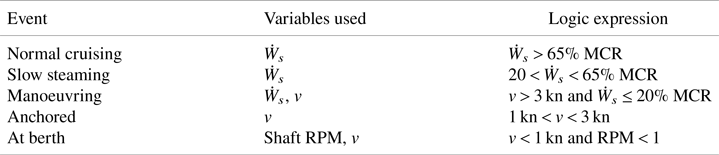
This work uses the definitions of operational modes from the Third IMO GHG Study (Smith et al., Reference Smith, Jalkanen, Anderson, Corbett, Faber, Hanayama, O'Keeffe, Parker, Johansson, Aldous, Raucci, Traut, Ettinger, Nelissen, Lee, Ng, Agrawal, Winebrake, Hoen, Chesworth and Pandey2014) to aggregate general aspects of ship operation. These operating modes are shown in Table 4, where v is the ship's speed over ground. In this paper, the term ‘while at sea’ groups together normal cruising, slow steaming and manoeuvring.
Logical expressions defining operating modes

2.5.4. Secondary filtering
Finally, 0⋅87% of the observations were eliminated due to ηT being larger than 80%. In total, 13⋅59% of the initial observations were removed through the filtering processes.
3. Results
3.1. Time distribution and speed profiles
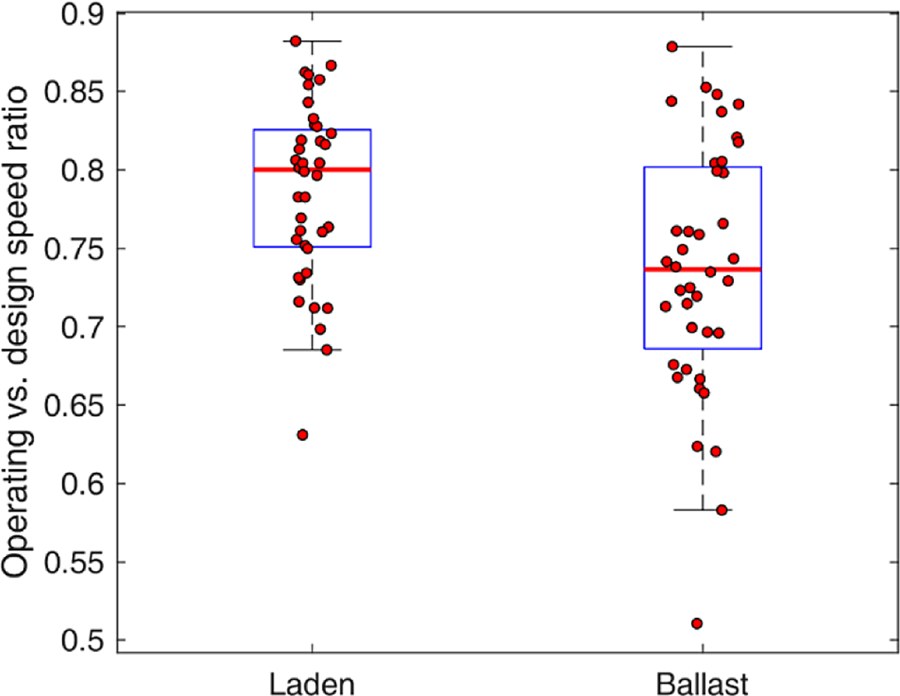
On average, and only considering while at sea operations, the LNGCs sailed for 10⋅9 days under laden conditions (i.e. 46% of the time), covering an average distance of 3,416 nm, and 12⋅8 days under ballast conditions (i.e. 54% of the time) with an average distance of 3,345 nm. For laden legs, the average speed was observed to be 15⋅5 kn, which gives a ratio of 0⋅78 between average operating speed and design speed, while for ballast legs the average speed was 15⋅4 kn with a ratio of 0⋅74 (see Figure 2).
Ratio of average operating speed and design speed under laden and ballast conditions

From Figure 2 it can be inferred that STPSs are being built with a high preference for slow steaming due to its associated fuel-saving potential. This is highly beneficial for low-efficiency propulsive systems such as the steam turbine (Ekanem Attah and Bucknall, Reference Ekanem Attah and Bucknall2015). The average total distance for a single voyage equated to 6,762 nm with 13⋅7 voyages per year.
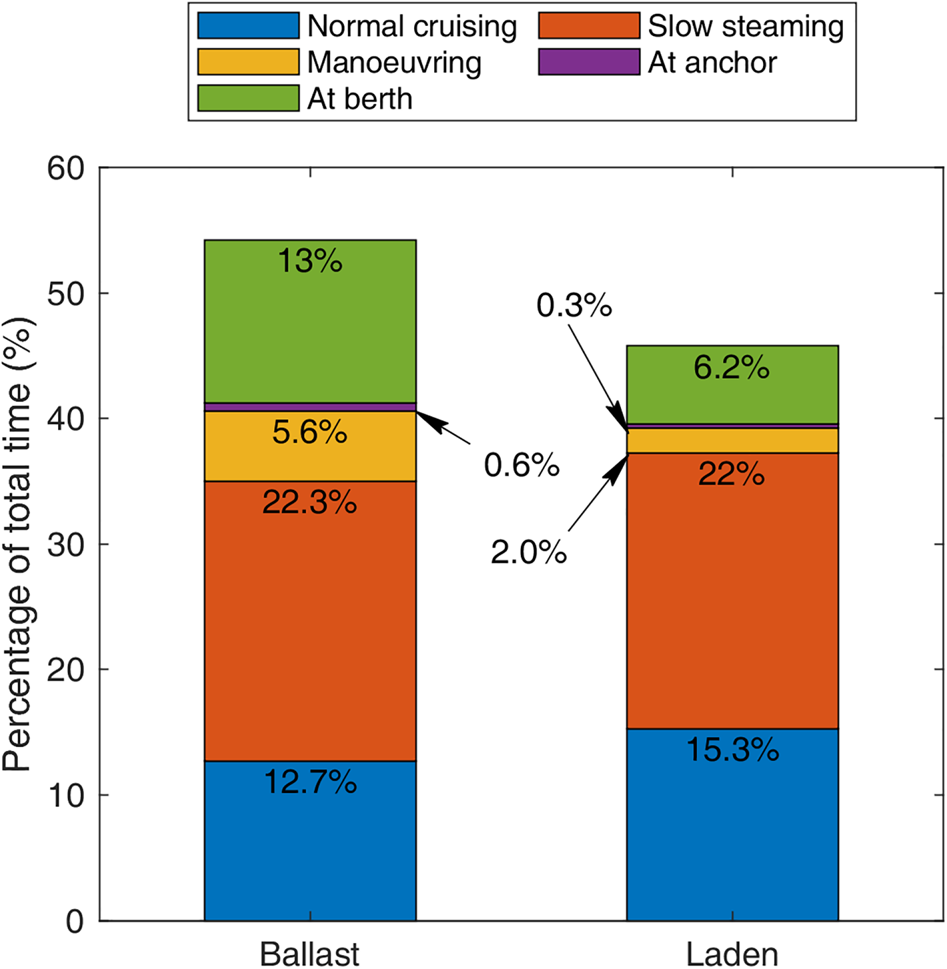
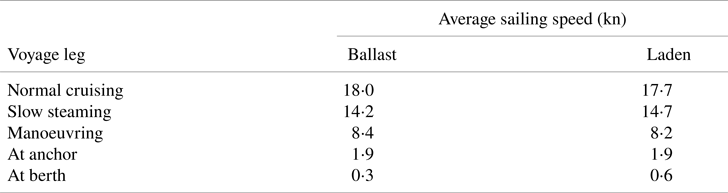
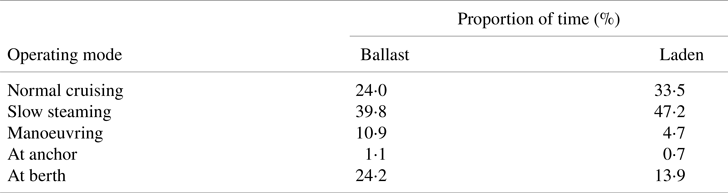
The addition of operational modes allows for the understanding of the differences between duration and distance for laden and ballast legs (see Figure 3 and Table 5). Activities near ports (i.e. anchor, berth and manoeuvring) required more time at ballast conditions (i.e. 19⋅1%) than laden (i.e. 8⋅4%). One plausible explanation is that, during the ballast legs, the temperature in the cargo tanks must be the correct one to receive LNG to minimise thermal stresses while minimising BOG generation (Lu et al., Reference Lu, Xu, Deng, Wu, Wu and Yang2016; Shao et al., Reference Shao, Lee, Kim and Kang2018). This cooling procedure adds time to the ballast leg, as seen in Figure 3, for the berthing time. The time spent while at sea in laden condition accounted for 39⋅4%, while the ballast legs represented 40⋅6%.
Time distribution for the LNGC sample aggregated by loading condition and events

Average operational speed for the steam-powered LNGC fleet

The Third IMO GHG Study (Smith et al., Reference Smith, Jalkanen, Anderson, Corbett, Faber, Hanayama, O'Keeffe, Parker, Johansson, Aldous, Raucci, Traut, Ettinger, Nelissen, Lee, Ng, Agrawal, Winebrake, Hoen, Chesworth and Pandey2014) gives an average speed while at sea of 14⋅9 kn for the liquefied gas tanker fleet of the same capacity range (i.e. 50,000–199,999 m3) for the year 2012. Olmer et al. (Reference Olmer, Comer, Roy, Mao and Rutherford2017) showed that the average operational speed reduced slightly between 2013 and 2015, and the Fuel Use Statistic and Emissions (FUSE) report gives an overall speed of 14⋅4 kn for the year 2016 (UMAS, 2016). The average while at sea speed for 2016 from the CM dataset – 26,122 observations – is found to be 15⋅0 kn. The difference in speeds between steam-powered LNGCs and the whole liquefied gas tanker fleet has important implications for the quantification of emissions and fuel consumption on bottom-up approaches since they tend to aggregate the whole fleet per ship classFootnote 1 under an average speed and ship/propulsion efficiency. With STPS, higher operational speeds coupled with lower propulsive efficiency (Tu et al., Reference Tu, Hongjun, Lei and Guoqiang2019) will tend to higher estimated CO2 emissions per ship than for LNGCs with an alternative propulsion system (e.g. dual-fuel four-stroke diesel engine).
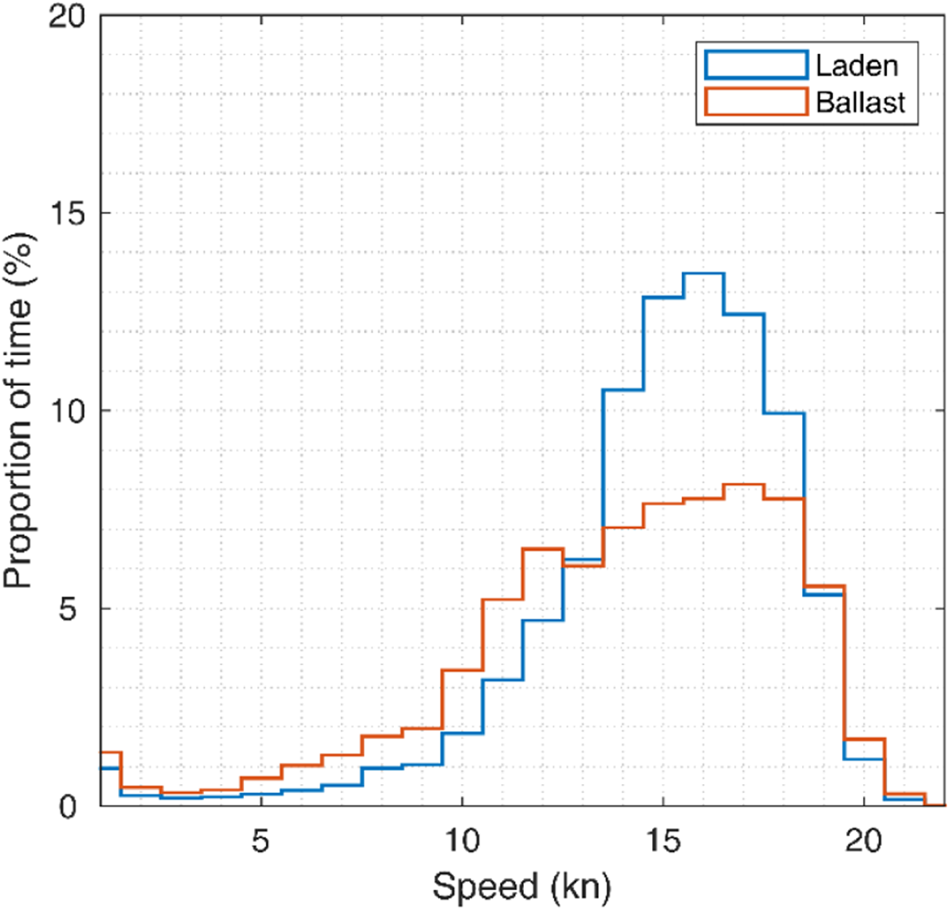
Figure 4 shows an operational speed preference of between 14⋅0 and 18⋅0 kn for both ballast and laden conditions, accounting for 47⋅3% of the time. Just 3⋅7% of the time is spent at speeds equal to or above 18⋅0 kn – 2⋅2% for ballast conditions and 1⋅4% laden – while speeds below 1⋅0 kn represented 19⋅5% of the total time observed.
Average speed distribution of the total time observed for the different vessels analysed

3.2. Fuel consumption and power generation
The fleet consumed 8⋅989 × 105 t of BOG, 3⋅294 × 105 t of RO and 1⋅227 × 104 t of DO. The most common burning modes are the dual (RO + BOG) and pure BOG modes. DO is used in a small number of vessels (i.e. 13 LNGCs) and it is seldom burned, normally in conjunction with BOG (see Table 6).
Power distribution per event and fuel type, and time distribution per fuel combination

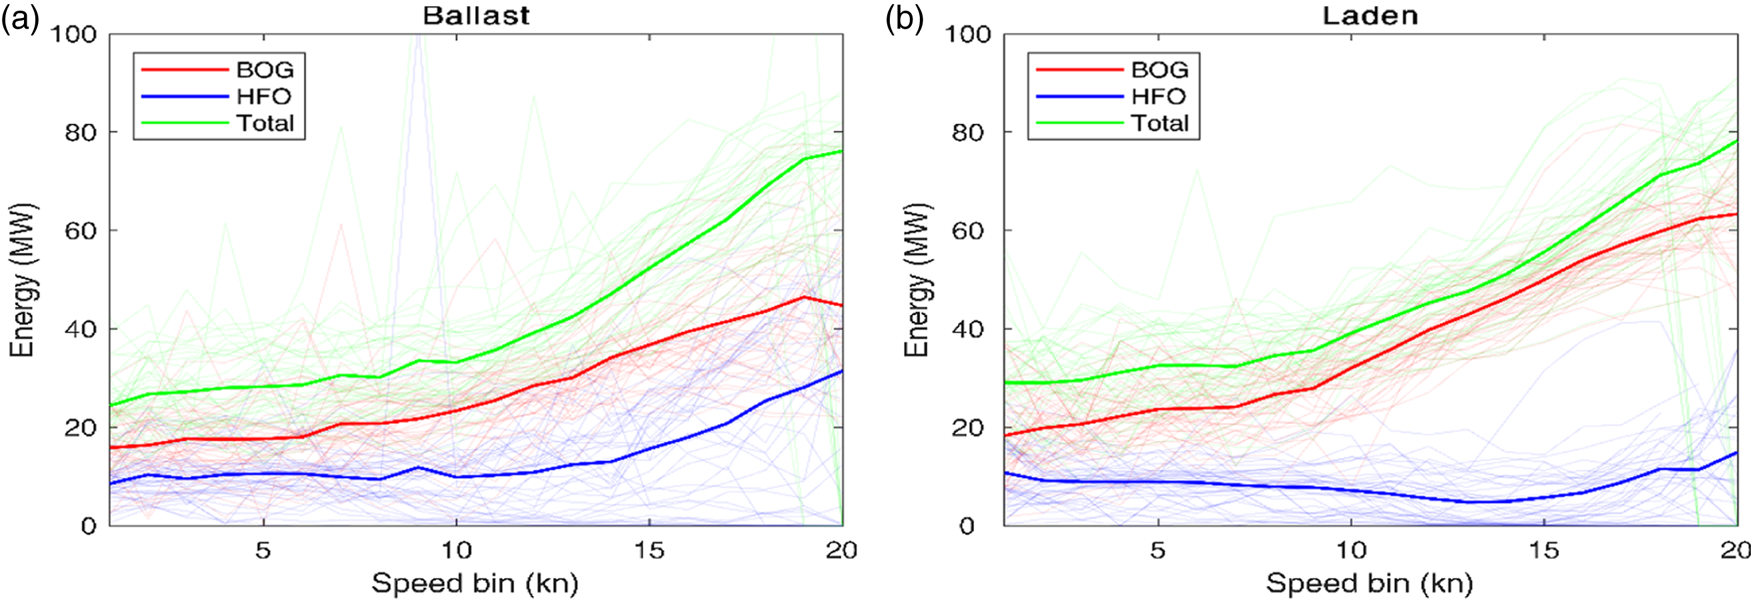
When converting fuel to power, the LNGC boiler average power input is 61⋅4 MW in laden conditions and 50⋅3 MW for ballast conditions. From Figure 5, it can be seen that the majority of the power was derived from BOG, albeit there is always a share of RO being burnt. At speeds between 0⋅0 and 7⋅0 kn, in both conditions, the boiler power output is dominated by the auxiliary systems with BOG making up a larger proportion of the fuel mix. Above 7⋅0 kn, the propulsive power demand guides the upward trend on the boiler power input. The additional boiler power required is sustained by additional BOG consumption up to above 13⋅0 kn when ballasted and 15⋅0 kn when laden. Above these speeds, the consumption of RO starts to increase. Under ballast conditions, the power obtained by burning BOG reaches a maximum of 41⋅9 MW at 19⋅0 kn to then decline. The boiler is complemented by RO with a maximum power input of 31⋅0 MW at 20⋅0 kn. For laden conditions, the power production due to BOG consumption reaches its maximum of 62⋅0 MW at a speed of 20⋅0 kn while for RO was 17⋅1 MW at the same speed. Regarding DO, the maximum power obtained was 1⋅2 MW for ballast legs and 1⋅9 MW for laden legs.
Average boiler power input represented by the fuel mix power input per operational speed (a) for ballast legs, and (b) for laden legs. Shaded lines represent the fuel mix power input for each ship

Power generation is relatively similar at berth, at anchor and manoeuvring, between 25⋅0 and 28⋅0 MW at ballast and between 33⋅0 MW and 37⋅0 MW at laden conditions. In slow steaming mode, the average power consumed is 52⋅3 MW at ballast and 58⋅5 MW at laden. However, for normal cruising, the power input is virtually the same, at 80⋅9 MW for ballast and 81⋅4 MW at laden. This has to do mainly with the higher operational speed at ballast in comparison with laden for this operational mode (see Table 5).
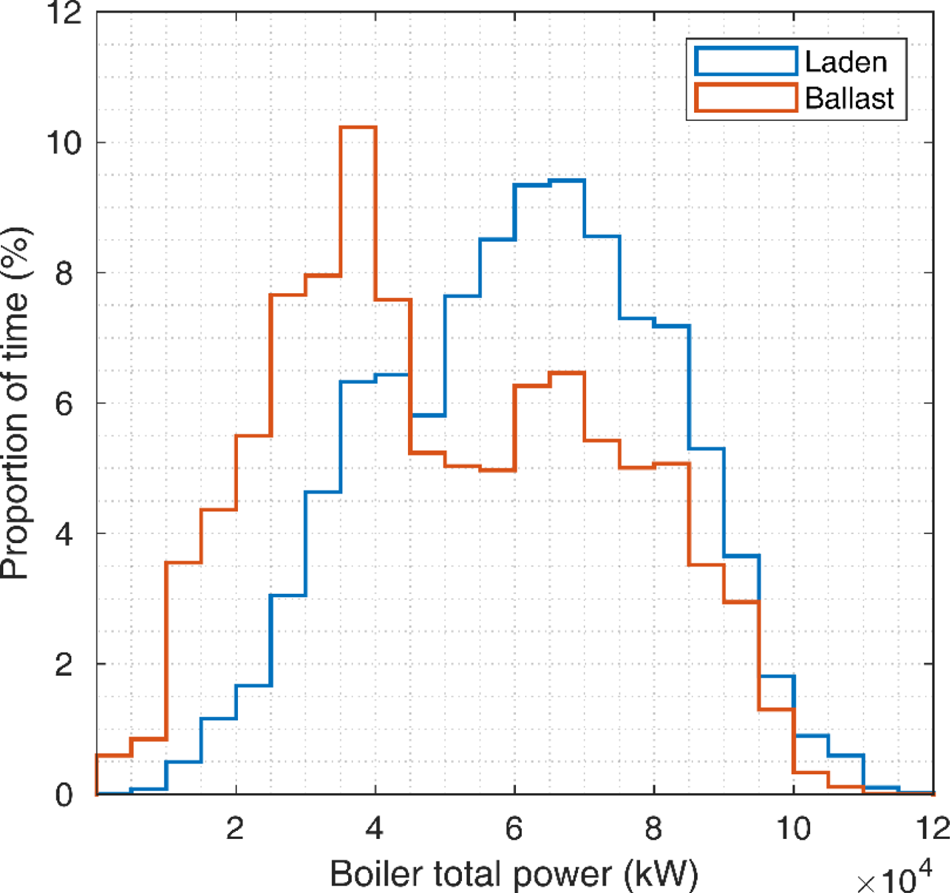
Figure 6 shows that the boiler power input distribution has two peaks: between 32⋅0 and 43⋅0 MW per hour and between 55⋅0 and 75⋅0 MW per hour. The first peak is due to an operational speed between 11⋅0 and 12⋅0 kn but also by the LNGC loading and unloading its cargo, where the speed is 0⋅0 kn. The majority of the observations for this peak occur when the ship is in ballast condition (i.e. about 64⋅9% of the observations). The second peak in Figure 6 has to do mainly with speeds between 15⋅0 and 16⋅0 kn. In this peak, the majority of the observations happen while the LNGC is in laden condition (i.e. about 56⋅7%).
Boiler power input distribution for all data observed, split by loading condition

With regard to DGs, only seven of the 40 ships had sensors installed, which operated for 730 h, representing 0⋅9% of the time for the seven ships or 0⋅2% of all observations. Looking only into the seven LNGCs with DG sets, the largest average DG power input happens at berth with 2⋅4 MW (i.e. about 9⋅0% of the boiler power input for the same operational mode) for 24⋅2% of the ballast time and 13⋅9% of the laden time. The lowest DG power input is during slow steaming at 0⋅8 MW (i.e. about 1⋅4% of the boiler power input), covering 39⋅8% of the DG operational time during ballast and 47⋅2% during conditions (see Table 7). It can be concluded that the DG sets play a supportive or back-up role on-board the LNGC.
Proportion of time with DG operation (only considering the ships that had DG sets)

3.3. Power consumption
The power consumers covered in this work are the propulsion system, evaporators, feed pumps, turbo-generators (TG) and DG. The maximum power demanded by the LNGC is seen at the 20⋅0 kn bin with 27⋅1 MW when the ship is in ballast and 27⋅8 MW when it is laden, this difference is caused mainly by the difference in loading condition.
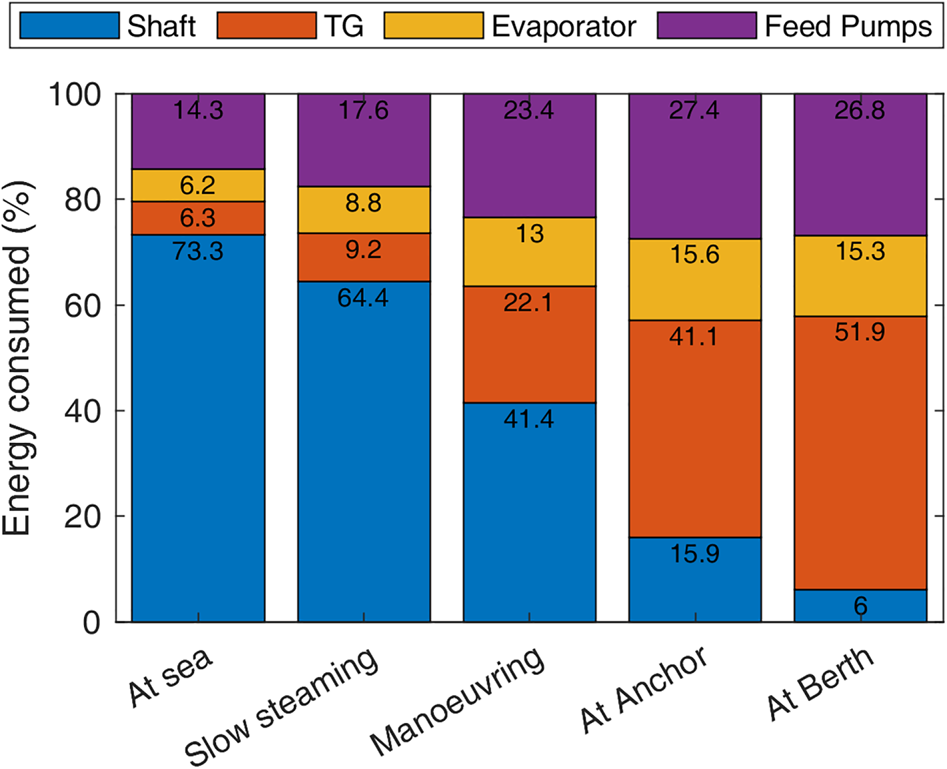
Figure 7 shows the power consumption percentage by operational mode. The major power consumer during normal cruising, slow steaming and manoeuvring is the propulsion system, while at anchor and at berth the TG is covering the hotel load.
Energy consumers during operation modes

3.3.1. Shaft power
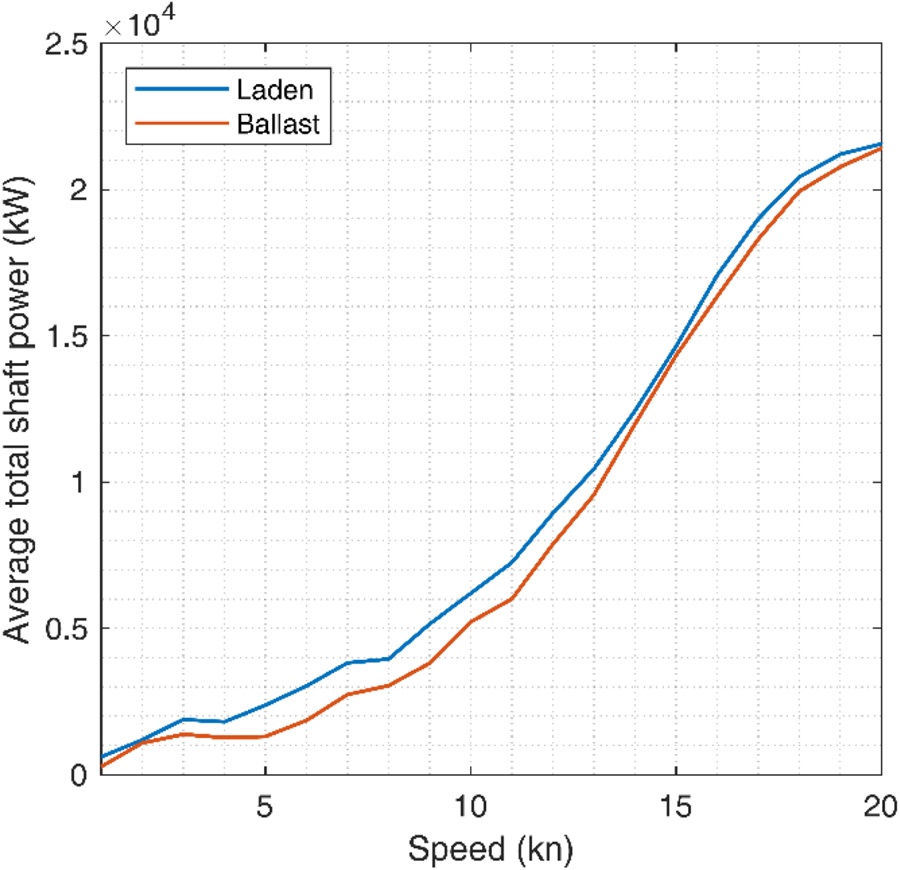
For all bin speeds, it is seen that the laden condition demanded the highest power, mainly due to this loading condition (see Figure 8). The average shaft power for laden conditions was observed to be 12⋅3 MW, while at ballast it was 9⋅1 MW. From Figure 8 it is seen that the average shaft power increases in an exponential behaviour as the operational speed increases, to then behave as an asymptote at around 18⋅0 kn. The expected behaviour is that the speed–power curve would keep growing in a cubic relationship (Woud and Stapersma, Reference Woud and Stapersma2012), but due to a reduced number of observations at speeds above 18⋅0 kn a data artefact is created, causing the asymptotic behaviour.
Average shaft power at different speed bins for both loading conditions

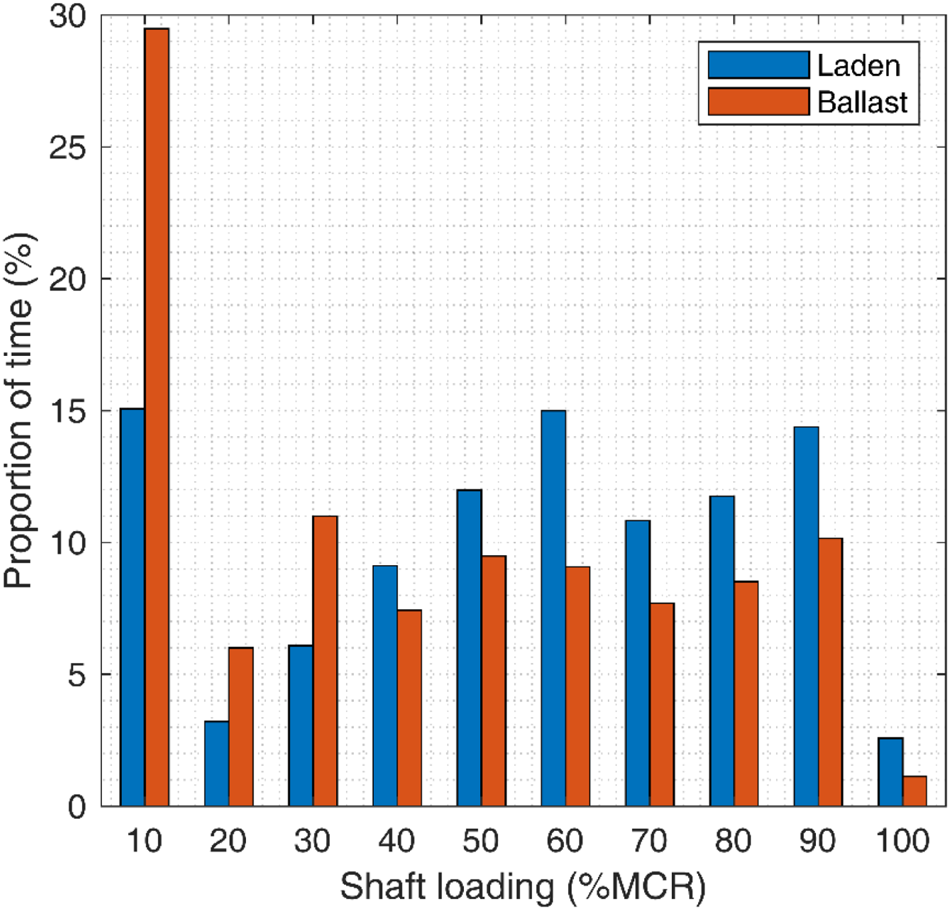
Figure 9 shows that MCR below 30% is more common in ballast conditions, with the greatest difference between loading conditions at the 10% MCR bin which is associated with the ship being at berth. Larger MCR bins tend to be more equally distributed for both loading conditions but they tend to be more common in laden conditions. The most common MCR bins are the 60% MCR bin – with about 12% of the observations – and the 90% MCR bin – with about 11% of the observations. The 60% MCR bin is associated with operational speeds between 15⋅0 and 17⋅0 kn for both loading conditions, while the 90% MCR bin has operational speeds of between 18⋅0 and 20⋅0 kn for ballast conditions and between 17⋅0 and 19⋅0 kn for laden conditions.
Distribution of the shaft's MCR observations. Each loading condition adds 100% and bin 10% MCR represents loadings between 0 and 10% MCR

The figure also shows that the LNGCs seldom operate at MCR larger than 90%, associated with speeds above 18⋅0 kn for both loading conditions. The intersection between different MCR bins but with similar operational speeds could be caused by different cargo loading, hull fouling, machinery maintenance and weather conditions, which are outside the scope of this work (Doulgeris et al., Reference Doulgeris, Korakianitis, Pilidis and Tsoudis2012; Prpić-Oršić and Faltinsen, Reference Prpić-Oršić and Faltinsen2012; Smith et al., Reference Smith, Jalkanen, Anderson, Corbett, Faber, Hanayama, O'Keeffe, Parker, Johansson, Aldous, Raucci, Traut, Ettinger, Nelissen, Lee, Ng, Agrawal, Winebrake, Hoen, Chesworth and Pandey2014).
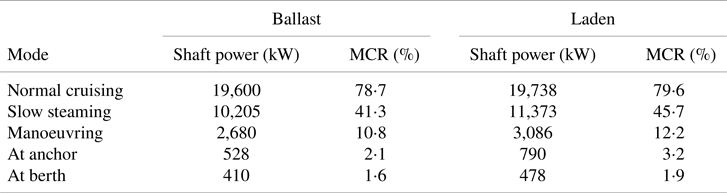
Table 8 shows that the highest average shaft power is seen for normal cruising at around 19,600 kW, while the lowest, i.e. 410 kW, is at berth where the speed is zero.
Averaged shaft power and MCR for the different operational modes

3.3.2. Auxiliary systems: electrical generation
The electrical load is normally supplied by two TGs. In the STPS there are also DGs, which are intended to be a back-up measure in case the TGs fail or any issue occurs in the steam generation, or for use in extended waiting periods without cargo on-board.
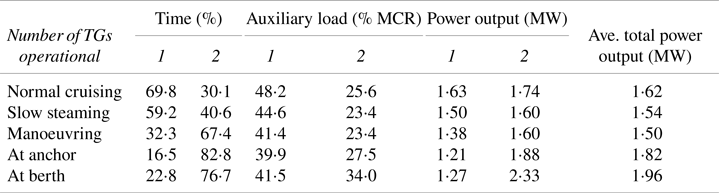
The installed power per TG ranges between 2⋅0 and 3⋅5 MW with an average of 3⋅2 MW. The total TG installed power is found between 5⋅4 MW and 6⋅9 MW with an average of 6⋅4 MW. From Table 9 it can be inferred that there is a distinct operational preference – around 80% of the time – for running two TGs for operational modes with low speed and activities around port that support the unloading of the cargo. During slow steaming and normal cruising, the preferred choice is to use a single TG (i.e. between 59% and 70% of the time, respectively).
Averaged TG usage time, loading and power output for each operational mode

Note: Averaged total power output shows the power delivered to the ship by either a single TG or both TGs installed.
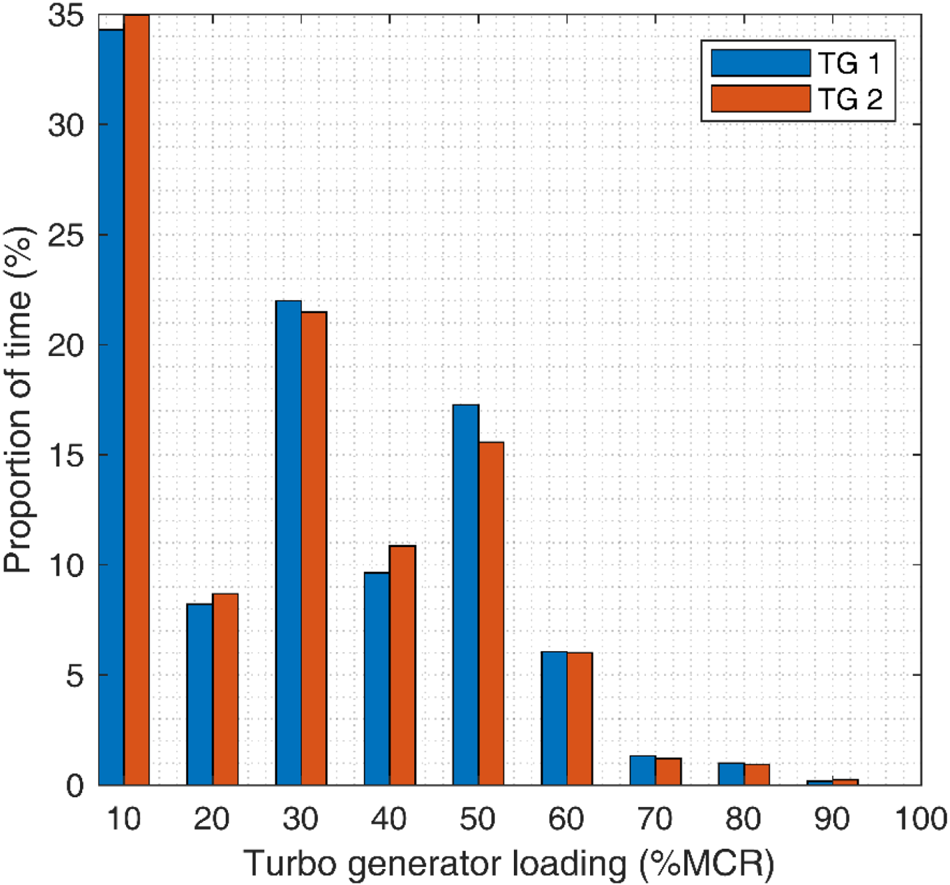
Table 9 also shows that as a single TG reaches a load between 40⋅0 and 50⋅0% MCR, a second TG engages. The loading window when both TGs are operating becomes between 20⋅0 and 35⋅0% MCR where, on average, the power outputs for both TGs are within 3⋅0% of each other. Looking at the load distribution for both TGs in Figure 10, it can be seen that for around a third of the time the TGs were idle, but also that there are another two distinct operational time peaks. The first peak is seen between a load of 15⋅0 and 25⋅0% MCR, which represents the time when both TGs covered the auxiliary load simultaneously. The second peak, between 35⋅0% and 45⋅0% MCR, shows the time when a single TG was operating.
Load distribution for both TGs on-board the LNGC

From a thermodynamical point of view, the most optimal operational window for TGs starts above 50⋅0% MCR (Mrzljak et al., Reference Mrzljak, Prpić-Oršić and Senčić2018). However, the data shows that the majority of the time (i.e. about 61%) the TGs operated at below 55⋅0% MCR. This shows that STPSs have excess installed auxiliary power, allowing for a few TGs to respond better to a wide range of electrical loads. Running at lower loads reduces the vibrations experienced by the TGs which could allow for longer periods between maintenance. Further, getting steam turbines running takes considerable time (Bachmann et al., Reference Bachmann, Nielsen, Warner and Kehlhofer1999; Banaszkiewicz, Reference Banaszkiewicz2014). Hence, in case a TG should suddenly fail, it could compromise the safety and operation of the LNGC, so operating two TGs simultaneously allows for more robust operation. All these aspects could outweigh the benefit of operating the TGs at higher efficiency (Adamkiewicza and Drzewienieckij, Reference Adamkiewicza and Drzewienieckij2013).
The average installed power per DG was 1,750 kW. The DGs operate 87⋅4% of the time alongside the TGs and for 58% of the DGs’ observed operational time only a single DG was in use. Contrary to the TGs, when both DGs are operating their load difference is around 23⋅2%.
3.3.3. Auxiliary systems: turbo-feed pump
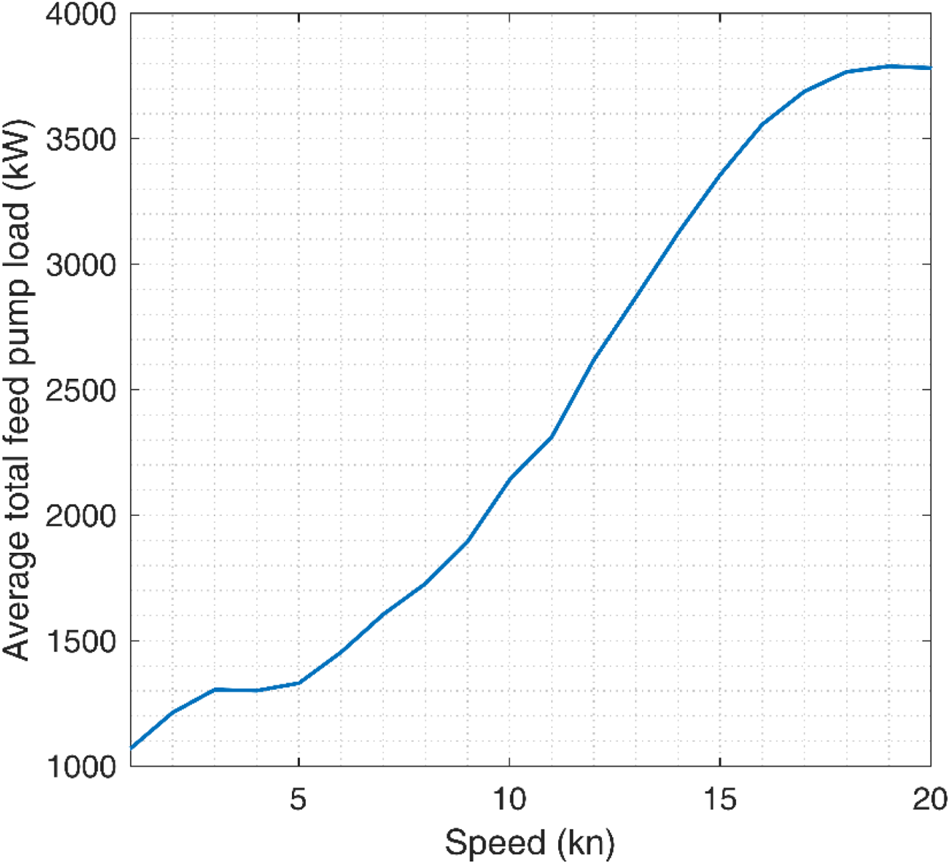
The turbo-feed pump (TFP) moves water/steam inside the boiler system; normally there are two to three pumps per boiler on-board. Due to the nature of Equation (9), there is a direct relationship between the total TFP power consumption and shaft power. Figure 11 shows that when the ship is idle, the TFP power output is on average 1,040 kW. As the LNGC increases its speed, and hence its shaft power output, the TFP demand increases, reaching a maximum of 3,820 kW at a bin speed of 20⋅0 kn.
Average power output from the TFP at different operational bin speeds

3.3.4. Steam dump
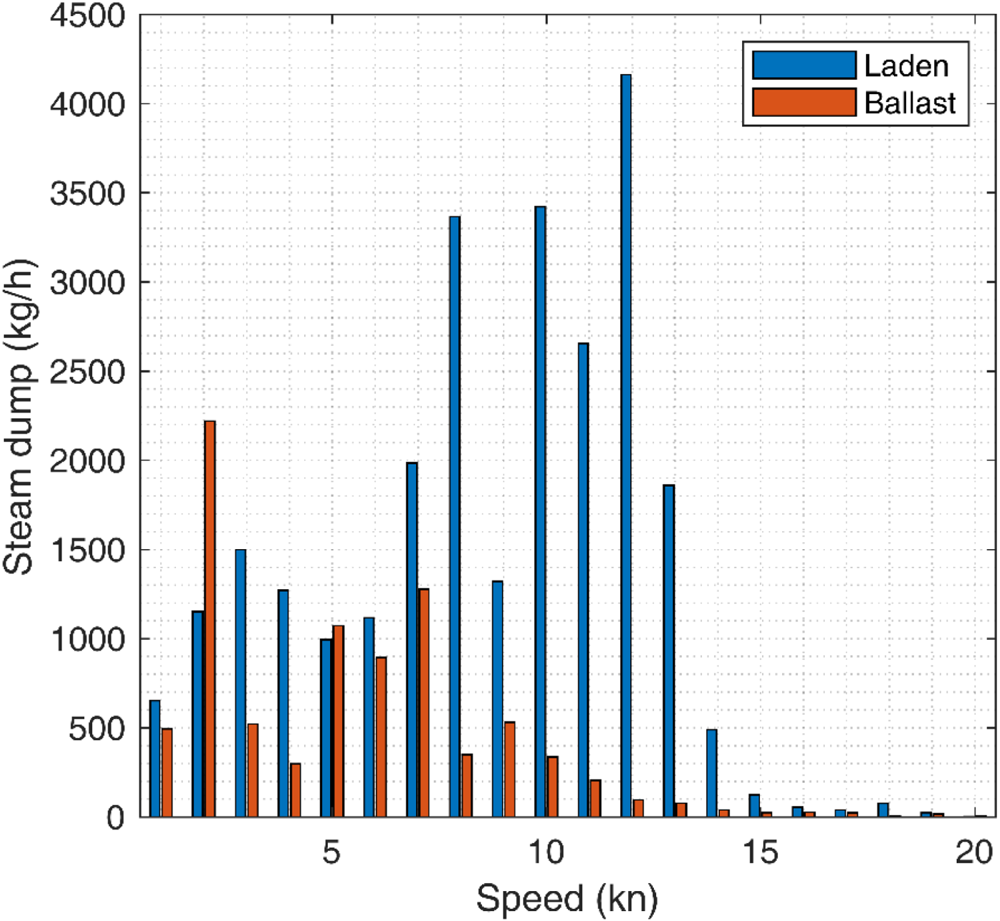
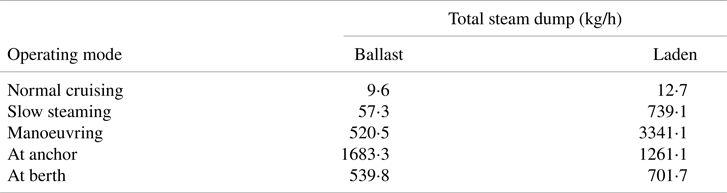
The LNGCs with steam plants have a dedicated steam line known as a dump line, which acts as a safety measure to evacuate the surplus steam generated by the main boilers (Mrzljak et al., Reference Mrzljak, Prpić-Oršić and Senčić2018). Figure 12 shows that the majority of the steam being dumped while the ship is in laden condition occurs between 6⋅0 and 12⋅0 kn – lower engine loads – with an average steam dump of 3,340 kg/h. The operational mode with the highest steam dump at laden condition is manoeuvring, with an average of 3,340 kg/h, followed by at anchor with 1,260 kg/h (see Table 10). At higher speed bins and laden conditions, steam dump is reduced since at higher speeds the BOG is consumed in its totality. Mrzljak and Poljak (Reference Mrzljak and Poljak2019) presented similar findings from measuring the steam flows on-board an 84,812 dwt LNGC. This behaviour is expected because, during laden conditions, the tanks are topped with the LNG cargo and heat leak into the tanks forms BOG at a rate of about 0⋅10% to 0⋅15% of the cargo volume per day (Mokhatab, Reference Mokhatab2014). The BOG causes an increment in the cargo tank internal pressure, which for safety reasons must be kept within certain limits. Therefore, the internal tank pressure is relieved by sending BOG excess to the main boilers, where it is burned and steam is generated. A lower, but still considerable, amount of steam dump is seen between 1⋅0 and 5⋅0 kn (i.e. anchoring and manoeuvring) when the ship is most likely waiting for its spot at the LNG terminal: near it or, depending on the terminal's safety protocols (e.g. against pirates), in deep waters. Under these modes, the power demanded is low and hence the need to dump steam.
Average steam dump per operational speed bin and loading condition

Average steam dump at the different operational modes

During ballast, the tanks are only carrying a small amount of LNG (heel) which is optimised to keep the tanks cold while the BOG generated is used as fuel, reducing considerably the amount of excess steam being dumped (as seen in Table 10). Under this condition, the largest average steam dump occurs at a speed of 1⋅0 kn with 2,280 kg/h. At this speed the ship is at anchor, probably waiting for port or the platform to be available, implying that if there is bad voyage planning, the LNGC will need to wait for long periods, requiring it to dump steam and diminishing the general voyage efficiency. The maximum steam dump during ballast legs and while navigating occurs when the LNGC is slow steaming at 7⋅0 kn with a dump of 1,683 kg/h. At berth, due to vapour displacement and heat leakage (Huang et al., Reference Huang, Hartono and Shah2007), steam dump is about 540 kg/h.
3.4. Thermal efficiency
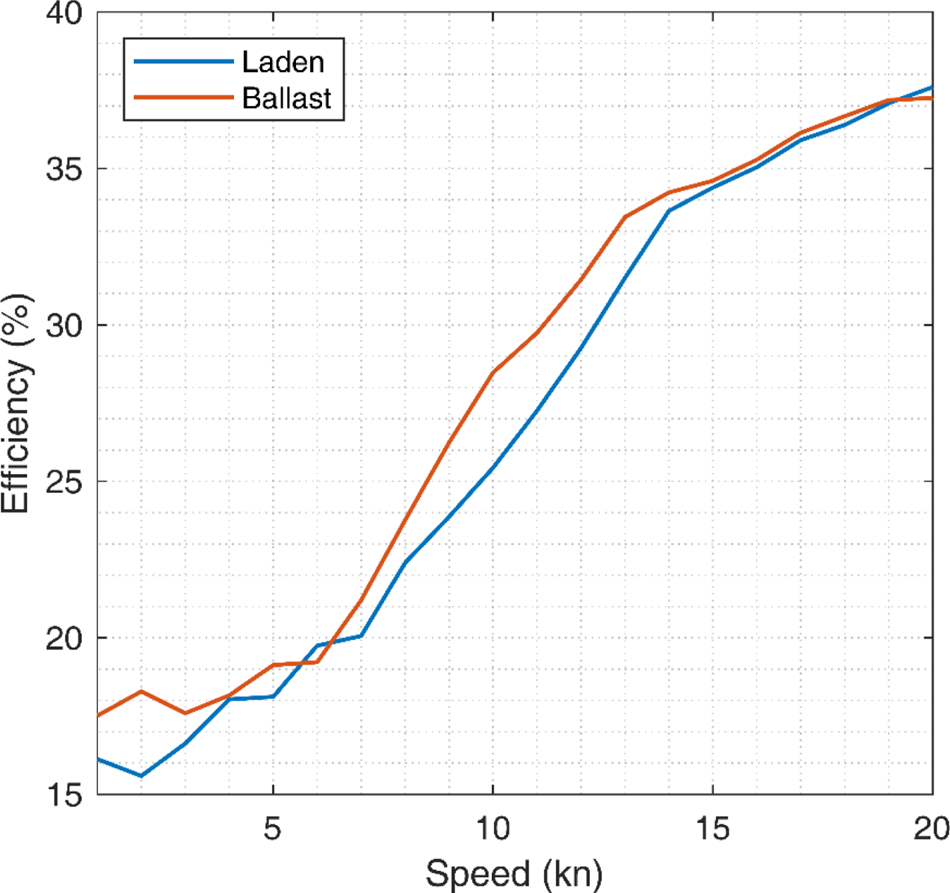
The total efficiency of the STPS is seen to increase with the ship's operational speed from about 13⋅9% at laden and 14⋅3% at ballast when idle to a maximum of 37⋅7% at laden and 37⋅2% at ballast when navigating at around 20⋅0 kn (see Figure 13). Sinha and Nik (Reference Sinha and Nik2012) give a similar maximum efficiency for a 157,000 m3 LNGC when fully loaded. At lower speed bins the ship's efficiency is at its lowest, caused by a low demand by the consumers (e.g. propulsion), extra steam being dumped (Figure 12), and not operating at the optimal efficiency window (Mrzljak et al., Reference Mrzljak, Poljak and Medica-Viola2017; Mrzljak and Poljak, Reference Mrzljak and Poljak2019). As the operational speed increases so does the overall efficiency in both loading conditions, thanks to the individual systems operating at higher thermal efficiencies.
Operational efficiency of LNGCs per operational speed bin size per loading condition

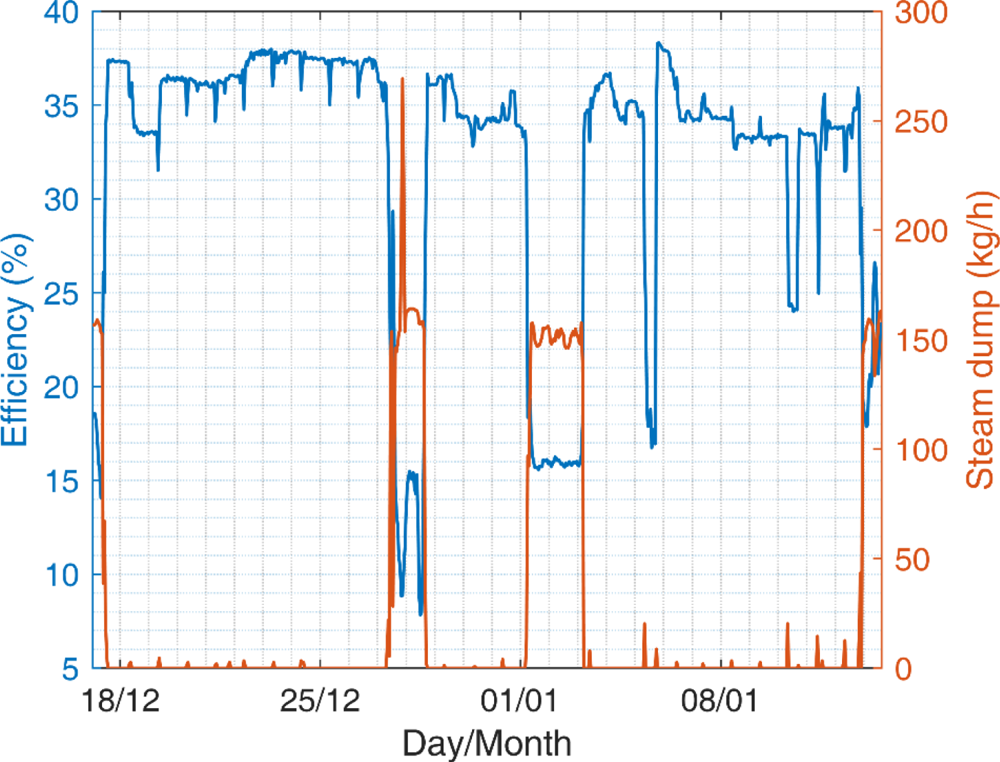
Another point to highlight is the influence of the steam dump on efficiency, represented in Figure 14 for a single laden voyage. It is seen that the efficiency drops considerably, from about 34⋅0% to well below 10⋅0%, as steam is being dumped. As shown in Figure 12, steam dump happens predominantly at speeds lower than 14⋅0 kn, at which the average efficiency for both loading conditions reaches about 30⋅5%. During ballast voyages, LNGCs performed, on average, three percentage points above laden voyages between bin speeds 6⋅0 and 13⋅0 kn, where the largest amount of steam is being dumped at laden conditions. Where the difference in steam dump between loading conditions is reduced and under similar operating speed, the LNGCs’ efficiencies become relatively similar – an average difference of 0⋅4 percentage points.
Typical LNGC voyage efficiency against steam dump

3.5. Data heterogeneity and uncertainty
Due to the large dataset in this work, the results are presented in an aggregated form which covers the heterogeneity of the data being recorded by the CM system. Figures 6 and 14 illustrate this variation, which is expected as it is seen in all similar studies, even those comparing sister vessels on similar operating profiles (Christensen et al., Reference Christensen, Thomas, Calleya and Nielsen2018). While some of the fluctuations are caused by the recording uncertainty of the CM's sensors (Table 1), there are important factors which could not be accounted for due to confidentiality restrictions or lack of data collection. These missing data points can be characterised as: vessel-related (hull, propeller and machinery condition; hydrodynamic retrofits or energy efficiency interventions), operational (maintenance routine, fuel quality, cargo utilisation, weather, trade routes) and commercial (chartering regimes and freight rates) factors.
All of these could contribute to part of the heterogeneity and there is not enough information to determine the degree of their effects on the outcomes observed.
4. Conclusions
This work analyses the high-frequency in-service monitoring data of 40 steam-powered LNGCs, representing about 16⋅5% of the LNGC fleet. The paper provides clarity in understanding the energy consumption of the STPS. It provides clarity on LNG transport by STPS ships, without the use of general assumptions for critical parameters, thanks to the use of high-frequency data. The evidence of this work offers a solid basis for future modelling and simulation studies and provides a precise and in-depth operational profile for LNGCs, capturing important complexities relevant to their operational efficiency and CO2 inventories.
It was found that, on average, the studied LNGCs spent 56% of their time in ballast conditions with an average operational speed 26% lower than the fleet design speed. For laden conditions, the average speed was 22% lower than at the design point, showing the preference for slow steaming. In contrast, some bottom-up studies tend to assume an even lower operational speed, affecting the quantification of CO2 inventories.
At all operational speeds and loading conditions, the LNGCs mainly consumed BOG and RO. In comparison, DO was consumed in small quantities by DG sets. The main power consumer, at high operational speed bins, was the shaft, which consumed 73⋅0% of the power; while at low speeds, TG and TFP represented 84⋅0%. It was shown that TGs operated below their thermal efficiency peak due to operational flexibility, maintenance and safety considerations.
The STPS shows the best efficiency at high speeds, at 37⋅0%. However, dumping steam reduces efficiency, with a particular case where it goes from 34⋅0% to 10⋅0%. Steam dump occurs mainly while the ship is in laden conditions at between 6⋅0 and 12⋅0 kn to relieve the cargo tank pressure while power demand is low. Steam dump is also seen in ballast conditions when the LNGC is anchored, waiting for the port and platform to become available.
Supplementary material
The supplementary material for this article can be found at https://doi.org/10.1017/S0373463320000612.