


Introduction
Sea-ice thickness and roughness are important variables in the air-ice-ocean system. Changes in ice thickness affect energy exchange between ocean and atmosphere, and salt balance and light penetration of the upper ocean. Ice roughness modifies the air/ice and ice/ocean interfaces and affects ice drift and turbulent transfers of heat and momentum. Changes in thickness and ice mass can be used as signals for climate change.
Drilling holes is a reliable way to measure Antarctic sea-ice thickness and derive its roughness (e.g. Reference Andreas, Lange, Ackley and WadhamsAndreas and others, 1993; Reference AdolphsAdolphs, 1999), but it is laborious and limited to a small number of samples. Electromagnetic induction (EM) sounding, which makes use of the large difference in electrical conductivity between sea ice and sea water to detect the ice/water interface, provides a more efficient method to measure Antarctic sea-ice thickness (Reference HaasHaas, 1998; Reference Worby, Griffin, Lytle and MassomWorby and others, 1999). EM sounding can be used on the ice surface, or its coverage can be improved by suspending the instrument from an aircraft or ice-breaker. The laser altimeter, which can also be operated from an airborne platform, has been used to describe the frequency and height distributions of Antarctic pressure ridge sails (Reference Granberg and LepparantaGranberg and Leppäranta, 1999; Reference Haas, Martin and LiuHaas and others, 1999). However, it is not possible to derive ice thickness directly from altimetry measurements. With the projected launches of NASA’s Ice, Cloud, and land Elevation Satellite (ICESat) and the European Space Agency’s Cryosat, it will be possible to derive sea-ice elevation and roughness data of high resolution, and wide spatial and temporal coverages will be available. However, the ability to derive ice thickness from these and other airborne altimetry measurements depends on our knowledge of the relations between surface elevation, roughness and ice thickness.
Since ice thickness cannot be measured directly by laser altimeters, a number of studies have been conducted to infer ice thickness from quantities measured from the surface, primarily over Arctic sea ice. Using data obtained by drilling in multi-year ice, Reference Ackley, Hibler, Kugzruk, Kovacs and WeeksAckley and others (1976) compared the ability of three isostatic models to predict ice thickness from surface elevations and reported that the error in the estimated thickness was only 10% greater than drilling-based operations. Reference Wadhams, Tucker, Krabill, Swift, Comiso and DavisWadhams and others (1992) studied concurrent laser profiling and submarine sonar records, and found that the probability density functions of snow elevation and ice draft could be related by a ratio of the density of ice plus snow and the density of water.
In the Antarctic, there have been recent studies of the ratio between snow and ice thickness (Reference Worby, Jeffries, Weeks, Morris and JañaWorby and others, 1996), and between snow elevation and ice draft (Reference AdolphsAdolphs, 1998). The present study augments those studies based on data obtained from drilling profiles with new drilling data obtained in autumn 1998 and summer 1999 in the Ross Sea, Antarctica. The focus of this paper is the operational feasibility of estimating ice thickness and ice bottom surface roughness from snow surface measurements. Snow surface elevation is an obvious parameter, but its measurement by laser altimeters generally contains errors arising from uncertainty of flight altitude and estimation of sea levels (Reference Ishizu, Mizutani and ItabeIshizu and others, 1999). Hence we also examine snow surface roughness as a parameter for predicting ice thickness and ice bottom surface roughness, as roughness measures fluctuations about a mean value and is not affected by the accuracy of absolute snow elevation. With the new data, we are able to examine interannual (autumn 1995 and autumn 1998) and interseasonal (autumn 1995, 1998 and summer 1999) variations in sea-ice roughness, and variations in the relationships between the snow surface and ice thickness and ice bottom surface roughness.
Study Area and Field Methods
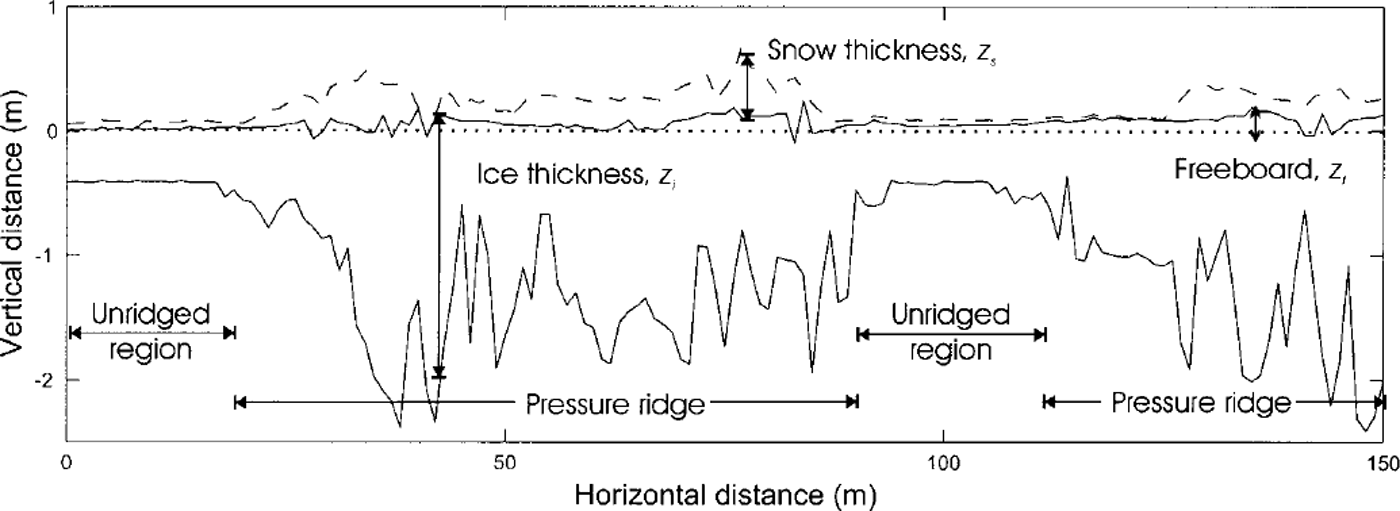
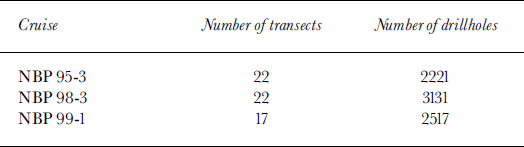
The data used in this study were obtained during three cruises on the R.V. Nathaniel B. Palmer (Fig. 1). Cruises NBP 95−3 and NBP 98−3 were in the western Ross Sea during austral autumn 1995 and 1998, respectively, and parts of their cruise tracks overlapped. NBP 99−1 was in the eastern Ross Sea during austral summer 1999. In all three studies, data were collected by drilling at lm intervals along 50−150 m long transects. Only transects >100m in length were analyzed. The number of transects and the total number of drillholes on each cruise are summarized in Table 1. At each drillhole, snow thickness (zs), ice thickness (zi) and freeboard (zf) were measured (Fig. 2). From these data, snow elevation (hs = zs + zf) and draft (zd = zi - zf) were calculated.
Cruise tracks of NBP 95-3 (×), NBP 98-3 (°) and NBP 99-1 (Δ) in the Ross Sea.

A typical snow-depth and ice-thickness profile obtained during nbp 98−3, annotated to show quantities and features described in the text.
Summary of drilling operations
Data and Analysis
Roughness variance
Roughness of the ice surface can be quantified by the roughness variance,  (Reference Andreas, Lange, Ackley and WadhamsAndreas and others, 1993). The roughness variance defined for an elevation variable, hxn
(where "x" can be replaced by "s" to denote snow surface, "t" for ice top surface or "b" for ice bottom surface) is defined as

where  is the mean elevation (distance from sea level) of surface x, n is the number of points on the transect and σ×
is the root-mean-square (rms) elevation roughness.
Data reduction
Ridges on each floe were distinguished from unridged ice (Fig. 2) using methods similar to those applied to submarine sonar profiles under Arctic ice (Reference Wadhams and HomeWadhams and Home, 1980). Modifications were made for the NBP Ross Sea datasets as they were shorter in length, contained thinner ice and contained more high-frequency fluctuations. A ridge was defined by the presence of a ridge keel underwater (Fig. 2). The Rayleigh criterion defines a pressure ridge keel as one where the draft minima (troughs) on either side of the focal maximum (crest) descend at least halfway toward the local level ice. In the present analysis, overlapping keels were considered as part of the same ridge. Local level horizon was defined using the D2 definition (Reference Wadhams and HomeWadhams and Home, 1980). A level ice point is one whose draft differs by < 0.25 m from every point within 10 m on either side. A ridge keel must also be deeper than a minimum draft, called the cutoff value; 5 and 9 m cut-offs were frequently used for the Arctic sonar profiles. These values were inappropriate for the NBP Ross Sea dataset, since the maximum draft measured was only 2.5 m and the mean draft was 0.80 m. The size difference between Arctic and Antarctic ridges was also noted by Reference Worby, Jeffries, Weeks, Morris and JañaWorby and others (1996), who reduced the cut-off heights for ridge sails to 0.5 m from the usual values of 0.75−1 m to allow for the smaller ridges in the Amundsen and Bellingshausen Seas. We tested the NBP Ross Sea dataset with cut-off values of 1, 0.75 and 0.5 m for ridge keels. We found that cut-off values of 0.75 and lm missed a significant portion of ridges (72% and 55%, respectively), while a cut-off value of 0.5 m captured 80% of the ridges. Hence, we adopted the definition that a ridge keel is an underwater feature which satisfies the Rayleigh criterion and is at least 0.5 m deep.
Each identified ridge is represented as an individual data point in the following analysis. Once the ridges were removed, each one of the remaining regions is classified as unridged ice (Fig. 2) and is represented as an individual data point.
Results
Mean thickness and roughness
The mean thickness and roughness values were reasonably similar for the two autumn cruises (NBP 95−3 and NBP 98−3), and these cruises were dissimilar to the summer cruise (NBP 99−1) (Table 2). Summer ice was thicker and had a deeper snow cover. As a result of the heavy snow load, the summer snow/ice interface was often submerged below sea level, and mean summer freeboard was −0.04 m. The roughness of the summer ice and snow surfaces was around twice as great as that of autumn ice. For the autumn cruises, there was slightly thicker ice, thinner snow and rougher surfaces in 1998 than in 1995.
Mean values of snow and ice thickness and roughness of ice floes for each ross sea dataset
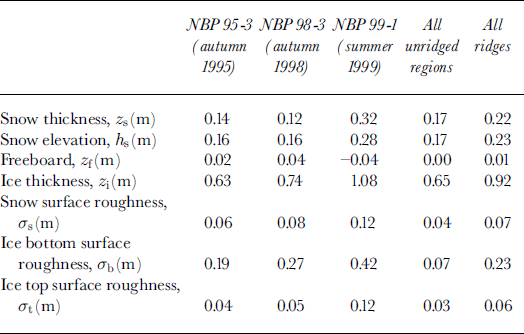
Ridges contained thicker ice, deeper snow and rougher ice bottom surfaces than unridged regions (Table 2). At the ice bottom surface, ridges were nearly four times as rough as unridged regions, but ice top surface and snow surface were similar in roughness. Mean freeboards of both ridges and unridged regions were at or close to zero.
Linear regressions
Linear regressions were performed between mean snow elevation, hs, and mean ice thickness, z-× (Fig. 3a-f); snow surface roughness, σs, and mean ice thickness, z-× (Fig. 4a-f); snow surface roughness, σS, and ice bottom roughness, σh (Fig. 5a-f); and snow surface roughness, as, and ice top surface roughness, σt (Fig. 6a-c). The majority of correlations are significant at the 99% confidence level.
Linear regression between mean snow elevation (hs) and mean ice thickness (z-j. (a-c) roughnesses averaged over each entire profile for individual cruises; (d) linear regression of all cruise data combined; (e,f) roughnesses over individual unridged regions and ridges, respectively. the correlation coefficient (r), the significance level ( % sig) and the standard error (se) of the slope of the regression are given in each graph. plus/minus 2se corresponds to 95% confidence interval of the regression.

Linear regression between snow surface roughness (as) and mean ice thickness ( zi). (a-c) roughnesses averaged over each entire profile for individual cruises; (d) linear regression of all cruise data combined; (e,f) roughnesses over individual unridged regions and ridges, respectively.

Linear regression between snow surface roughness (as) and ice bottom roughness (ah). (a-c) roughnesses averaged over each entire profile for individual cruises; (d) linear regression of all cruise data combined; (e,f) roughnesses over individual unridged regions and ridges, respectively.

Linear regression between snow surface roughness (as) and ice top surface roughness (<rt). (a) linear regression of all cruise data combined; (b, c) roughnesses over individual unridged regions and ridges, respectively.

Cruises varied in the strength of correlation between each pair of variables. For example, correlation between hs and z; was considerably stronger in NBP 99−1 than in NBP 95−3 or NBP 98−3 (Fig. 3a-c); correlation between as and z, was stronger in NBP 95−3 and NBP 98−3 than in NBP 99−1 (Fig. 4a-c); and scatter between as and ah was considerable on all three cruises (Fig. 5a-c). However, for each pair of variables, the data points from all three cruises converge relatively well along a linear trend (Figs 3d, 4d and 5d). The strongest correlation was between hs and zi (R ∼ 0.85; Fig. 3d), while the correlations between as and zi (Fig. 4d) and between as and ah (Fig. 5d) were slightly weaker and similar in strength (R ∼ 0.71). Despite the similarity in correlation coefficients, scatter between as and ah was considerably greater than between as and zi.
Regressions for ridges and unridged regions differed among the variable pairs. There was stronger correlation between hs and zi for both ridges and unridged regions (Fig. 3e and f). Weaker correlation and large data scatter were found for both ridges and unridged regions between <rs and zh σs and σb, σs and σt (Figs 4e and f, 5e and f and 6b and c), with the correlation being considerably stronger for ridges than for unridged regions.
Discussion
Mean thickness and roughness
Interseasonal, regional and interannual variations were observed in the thickness and roughness of Ross Sea ice. Ice and snow were thicker and surfaces were rougher in NBP 991 than in NBP 95−3 and NBP 98−3. The autumn ice in NBP 953 and NBP 98−3 contained a higher fraction of thin, new ice than the summer ice in NBP 99−1. By the summer, the ice cover had had time to thicken both dynamically and thermodynamically, and to accumulate snow. NBP 99−1 took place in the eastern Ross Sea where winds are more variable and ice export is less effective than in the western Ross Sea (Reference Marshall and TurnerMarshall and Turner, 1997), where katabatic winds of high directional constancy and the cyclonic circulation of the Ross Sea maintain efficient ice export Reference Jacobs and ComisoJacobs and Comiso, 1989). Consistently high concentrations of sea ice (Reference Sturman and AndersonSturman and Anderson, 1986) and variable winds (Reference Marshall and TurnerMarshall and Turner, 1997) in the eastern Ross Sea promote dynamic thickening and roughening of ice surfaces. The snow surface in this region could also roughen as a result of variable winds, floe rotation (Reference Massom, Drinkwater and HaasMassom and others, 1997) and increased ice deformation. Interannual variability was observed between NBP 95−3 and NBP 98−3, which took place in the same season and similar geographical locations, with 1998 being a year of less snow accumulation and greater ice thickness and roughness.
Ridges and unridged regions exhibited different characteristics, with ridges having a rougher ice bottom, greater ice thickness and accumulating more snow. Despite the differences in snow loading and ice stresses, isostatic balance was maintained across both ridges and unridged regions, as reflected by their mean freeboards of zero.
Comparison of surface roughness with other Antarctic regions
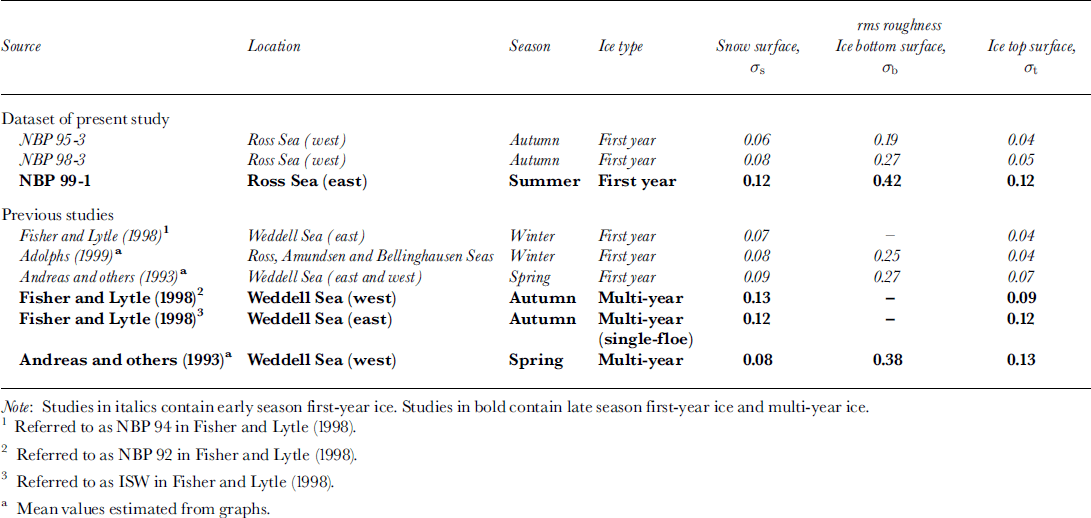
Sea-ice roughness values from various studies were compared according to geographical location, season and ice type (Table 3). Roughness values fell into two categories according to the age of ice floes. Early season (autumn to spring) first-year ice was low in roughness (Table 3). Late season (summer) first-year ice was similar to multi-year ice (Table 3) where roughness was up to three times that of early season first-year ice. From NBP 95−3, NBP 98−3 and NBP 99−1, we observed interannual, regional and interseasonal variability in sea-ice roughness (Table 2). When the comparison was expanded to include eight other cruises from previous studies in other parts of Antarctica, we found that interseasonal variations stood out over interannual and regional variability for first-year ice (Table 3). For the multi-year ice in the western Weddell Sea, roughness values were consistent among measurements made in different years and seasons (Table 3). This suggests that processes which create sea-ice roughness are independent of year and location, and that ice-floe age and deformation history are the most important factors in determining roughness.
Comparison of rms snow and sea-ice roughness values (m) in antarctica
Linear regression
In the linear regressions between hs and zi; σs and zi; and σs and σb, we observed variations between cruises and over ridges and unridged regions (Figs 3a-f, 4a-f and 5a-f). Despite the differences in data scatter and linear regression, a good linear trend emerged for each pair of variables when all profiles from the cruises were combined. This suggests that processes maintaining the relationships between snow elevation and ice thickness; snow surface roughness and ice thickness; and snow surface roughness and ice bottom roughness, are independent of season, year, location and deformation history of the ice floes.
Correlation between hs and zi over ridges and unridged regions (Fig. 3e-f) was stronger than correlations between <rs and zi (Fig. 4e and f), and <rs and ah (Fig. 5e and f). This difference is primarily due to the different mechanisms that determine hs and as.
Mean snow elevation, hs
The stronger correlation between hs and z× in NBP 99−1 than in NBP 95−3 and NBP 98−3 can be attributed to the presence of slush. Slush is the layer of saturated snow between the snow/ice interface and the sea level on a flooded ice floe, where zf < 0. As explained below, slush enhances the capability of predicting zi from hs by separating hs from zi, and by making little contribution to buoyancy.
The isostatic balance of a non-flooded ice floe (zf ≥ 0) is as follows:

where ρs is the density of snow, pi is the density of sea ice (assumed to be 900 kg m−3; Massom and others, 1998) and pw is the density of sea water (1024 kg m−3). Mean ρs values for NBP 95−3, NBP 98−3 and NBP 99−1 were 340, 320 and 520 kg m−3, respectively (Reference Sturm, Morris, Massom and JeffriesSturm and others, 1998; Reference Morris and JeffriesMorris and Jeffries, 2001). Isostatic balance in a non-flooded ice floe is maintained between hs(= zs + zf), which contains snow and some ice, and zd. Translation between zd and zi also depends on the isostatic balance, and the multiple dependencies make the relationship between hs and zi complex and scattered.
The isostatic balance of a flooded ice floe (zf < 0) is as follows:

where zf indicates the thickness of the slush layer and ρs] is density of slush, which is estimated to be close to that of sea water (0.96 kg m−3) (Reference AdolphsAdolphs, 1998), although field measurements arrive at lower values (0.70 kg m−3) (Reference AdolphsAdolphs, 1998) as sea water is invariably lost during the measurement procedure. The small difference between ρs] and ρw means that the effect of slush on buoyancy is small. As a result, the isostatic balance is maintained between hs and zi, allowing zi to be predicted effectively from hs.
Variability in the ratio zi : hs can be explained by the differences in the relative densities and proportions of ice and snow above sea level. We observed a higher zi : hs ratio in NBP 99−1 (4:1) than in NBP 98−3 (3:1), which was, in turn, higher than in NBP 95−3 (2:1) (Fig. 3a-c). Snow density in NBP 99−1 was highest, being 1.5 times greater than in NBP 95−3 and NBP 98−3. For the same hs, the heavier load in NBP 99−1 required a greater buoyancy force created by a larger ice volume below the sea level. Hence the ratio of zi:hs was greatest in NBP 99−1. Between NBP 95−3 and NBP 98−3, there was only 6% difference in ρs, and hs was the same for both years. However, there was 0.02 m more ice freeboard in NBP 98−3 than in NBP 95−3, and since the ice was three times more dense than snow, the load for the same hs increased. An increased load required a larger ice volume to provide the buoyancy force, and hence the zi : hs ratio was greater in NBP 98−3 than in NBP 95−3.
Snow surface roughness, σs
Snow surface roughness is primarily determined by ice top surface topography and wind redistribution. Snow preferentially collects in depressions. Winds at speeds of > 6−8 m s"1 are able to redistribute the snow (Reference Andreas and ClaffeyAndreas and Claffey, 1995), building it up in the lee of sails, filling in between sails and keeping the tops of sails bare (Reference Lange and EickenLange and Eicken, 1991). A snow surface with a hard crust would require higher winds to initiate redistribution (Reference Andreas and ClaffeyAndreas and Claffey, 1995). Snowdrifts on ice floes are often omnidirectional because of floe rotation and changes in prevailing wind direction (Reference Massom, Drinkwater and HaasMassom and others, 1997). The snow surface amplifies the roughness of the ice top surface, and the amplification is stronger in unridged regions than in ridges (Fig. 6a-c). Analysis of the frequency of snow surface roughness reveals that, although the magnitude of ice roughness has been amplified, the frequency of roughness features has been decreased, resulting in a smoothing effect over the ice top surface (Reference Andreas and ClaffeyAndreas and Claffey, 1995; Reference Massom, Drinkwater and HaasMassom and others, 1997).
The poor correlation between as and zi and σb over unridged regions (Figs 4e and 5e) can be attributed to the large discrepancy between σs and σt decoupling the snow surface from the processes determining zi and ah. Why does a large discrepancy between σs and σt exist in the unridged regions and not in ridges (Fig. 6b and c)? We suggest that the modification of ice top surface roughness, effects of nearby ridges and nucleation of roughness features on the snow surface are possible reasons. After the snow cover has been laid down, ice top surface can be smoothed by formation of snow ice. Snow ice is formed by the freezing of snow and floodwater at the interface between snow and ice, and this new ice layer smooths out small perturbations on the ice top surface, thereby reducing at. Hence, <rt that is measured subsequent to snow-ice formation has a lower value than when the snow cover was first laid down (Reference Worby, Jeffries, Weeks, Morris and JañaWorby and others, 1996). In ridges, at is dominated by the crest of the keel or sail, with its large deviation from the mean surface. Flooding and subsequent smoothing of troughs by the growth of snow ice has a relatively small effect on the <rt over the entire ridge.
Wind redistributes snow so that it builds up in the lee of ridge sails, and snowdrifts have been observed up to 10 m away from a ridge (Reference Sturm, Morris, Massom and JeffriesSturm and others, 1998). The roughness of this wind-drifted snow is independent of the ice top surface roughness. As a result, <rs and <rt are decoupled close to ridges, and unridged regions can have a disproportionately large <rs. On flat level ice surface, <rs can also be decoupled from <rt, as small icy nodules with sub-centimeter diameters can act as the foci for the formation of extensive dune features which can be up to lm high and 35 m long (Reference Massom, Drinkwater and HaasMassom and others, 1997; Reference Sturm, Morris, Massom and JeffriesSturm and others, 1998).
Conclusions
Interseasonal, regional and interannual variations were observed in the thickness and roughness of Ross Sea ice. Variability was reduced to season, or age of ice floe, when sea-ice roughness values from around Antarctica were compared. This suggests that processes which create sea-ice roughness are independent of year and location, and that ice-floe age and deformation history are the most important components in determining roughness. We found statistically significant correlations between mean snow elevation and mean ice thickness; snow surface roughness and mean ice thickness; and snow surface roughness and ice bottom roughness, over profiles >100m in length. The correlations appeared to be independent of season, location and deformation history of ice floes. The predictive capability of snow elevation and snow surface roughness is promising. The presence of slush improves the capability to predict ice thickness from snow surface elevation by keeping all ice below sea level and by making little contribution to buoyancy.
To improve and further understand the predictive capability of snow elevation and snow surface roughness, more data in the high thickness and roughness range (mean ice thickness > 1.5m, snow surface roughness > 0.15 m and ice bottom roughness > 0.75 m) is needed. Monitoring the effects of wind on snow surface roughness and the modification of the ice top surface through the season will improve our understanding of the mechanisms which determine snow surface roughness. Finally, similar studies in other parts of the Southern Ocean can tell us whether a single relationship of snow elevation and snow surface roughness with ice thickness and ice bottom roughness can be applied for all ice-covered waters in Antarctica. The bottom surface of Antarctic sea ice has only been studied by moored upward-looking sonars (Reference Strass, Fahrbach and JeffriesStrass and Fahrbach, 1998) or by drilling profiles (e.g. Reference Lange and EickenLange and Eicken, 1991; Reference Worby, Jeffries, Weeks, Morris and JañaWorby and others, 1996), and data are limited in spatial coverage. Unless autonomous underwater vehicles or civilian submersibles become available for research under the Antarctic sea-ice cover, the established methods are the only ways to directly obtain information on ice thickness, ice bottom roughness and ice bottom topography. The ability to predict subsurface quantities from airborne or even spaceborne measurements will provide us with an indirect method that has good spatial and temporal coverage to study the thickness and underside of Antarctic sea ice.
Acknowledgements
This work was supported by U.S. National Science Foundation grants OPP-9316767 and OPP-9614844. We are grateful to the many members of the science teams and Antarctic Support Associates personnel who dug snow, drilled holes and made measurements. We also thank Captain J. Borkowski and the officers and crew of R.V. nathaniel b. palmer for their vital contribution. Thanks also to reviewers G. Haas and S. Ackley and editor T. Tucker for providing invaluable suggestions that helped to improve the paper.



