I. INTRODUCTION
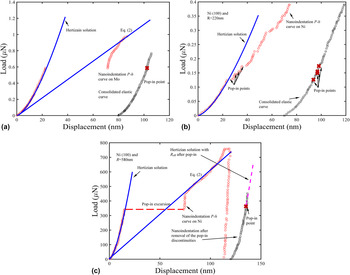
Nanoindentation testing has gained considerable popularity as a powerful tool to investigate material properties at small length scales. Many useful material parameters can be obtained from the quantitative information of the indentation load P and indenter displacement h, such as elastic modulus, hardness, flow behavior (e.g., hardening exponent), viscoelasticity, creep, and fracture toughness. Reference Oliver and Pharr1–Reference Gao, Larson, Lee, Nicola, Tischler and Pharr8 When the indentation depth is several tens of nanometers, many tests on a variety of single crystals exhibit sudden displacement excursions, or “pop-ins”, on the P–h curves. Reference Page, Oliver and McHargue9–Reference Xia, Bei, Gao, Catoor and George14 As shown by the representative examples in Fig. 1, before the first pop-in, the P–h curve is found to be reversible and follows Hertzian contact theory, implying that deformation is purely elastic. Therefore, the maximum stress in the solid upon the first pop-in, denoted as pop-in stress, can be used to evaluate the elastic–plastic transition and thus the material strength at small scales. Although pop-ins can be caused by fracture of a surface oxide layer in some materials, Reference Venkataraman, Kohlstedt and Gerberich15,Reference Corcoran, Colton, Lilleodden and Gerberich16 for carefully prepared and polished single crystals with low dislocation densities, the first pop-in corresponds to a stress at or near the theoretical shear strength of the material, that is, in the range of μ/5–μ/30 where μ is the shear modulus. Reference Bei, Gao, Shim, George and Pharr10,Reference Schuh, Mason and Lund17 The pop-in arises from homogeneous dislocation nucleation inside the solid. Some of the variation or scatter of the pop-in stress is due to the thermal activation that overcomes the energy barrier and thus allows dislocation nucleation to take place slightly below the athermal theoretical strength. When the stressed volume contains pre-existing heterogeneous nucleation sources, such as the Frank–Read source, pop-in may occur at much lower stresses. In this case, the scatter in the pop-in stress arises from a statistical chance of finding such pre-existing defects. Reference Li, Bei, Morris, George and Gao13,Reference Morris, Bei, Pharr and George18 Consequently, the pop-in stress shows two clear limits, i.e., the theoretical strength as an upper limit and bulk yield stress as a lower one. The transition between these two mechanisms as influenced by the indenter tip radius and prestrain level has been addressed in previous work. Reference Li, Bei, Morris, George and Gao13,Reference Johanns, Sedlmayr, Sudharshan Phani, Mönig, Kraft, George and Pharr19–Reference Bei, Xia, Barabash and Gao22
Representative load–displacement (P–h) curves for nanoindentation tests on Mo(100) single crystal with indenter radius R = 220 nm in (a), on Ni(100) with R = 220 nm in (b), and on Ni(100) with R = 580 nm in (c).

A variety of observations have been reported for the P–h response after the first pop-in, but no systematic studies have been conducted to characterize the pop-in modes and to relate them to the pop-in displacement excursion, indenter radius, prestrain level, and crystalline type. The examples in Fig. 1 are for Ni and Mo single crystals (carefully grown with very low initial dislocation densities), indented with small radius indenters. Reference Shim, Bei, George and Pharr11,Reference Li, Bei, Morris, George and Gao13,Reference Wang, Bei, Li, Gao, George and Nieh23 All the first pop-in stresses in these materials are very close to the theoretical strength. As shown in Fig. 1(a), a single pop-in with a large displacement excursion is found in Mo, and the subsequent P–h response is smooth and can be described by continuum plasticity. This type of behavior is denoted as the single pop-in mode. In contrast, the P–h curve in Fig. 1(b) for Ni exhibits many pop-ins; each of which has small displacement excursion of a few nanometers. This type is denoted as the successive pop-in mode. Note that the same indenter was used to obtain the data in Figs. 1(a) and 1(b). Nevertheless, for the same material in Figs. 1(b) and 1(c), the increase of the indenter radius changes the pop-in mode from being successive to single pop-in. In summary, when the first pop-in is controlled by homogeneous dislocation nucleation, whether the P–h response is of the single or successive pop-in mode depends on indenter radius and material type. The dependence on material type is further supported by the observation of single pop-ins in NiAl, Reference Li, Gao, Bei and George12 Cr3Si, Reference Bei, George, Hay and Pharr24 and GaAs, Reference Bradby, Williams, Wong-Leung, Swain and Munroe25 all of which have complex lattice structures and large lattice resistances, and the observation of successive pop-ins in FCC (Face Centered Cubic) Al sample. Reference Durst, Backes, Franke and Göken26 On the other hand, the pop-in mode can also be single or successive when the first pop-in is governed by a heterogeneous dislocation nucleation mechanism, as will be addressed later in this paper. We also note that with an increase of the contact size or prestrain level or with a decrease of the indenter radius, the pop-in excursions become small and hard to observe due to the instrument resolution. Reference Ma and Clarke27,Reference Wang, Bei, George and Pharr28
Motivated by these experimental observations, the present work aims to investigate the key factors that determine the pop-in mode, including material type, indenter radius, pre-existing defect density, and others. We are especially concerned with the correlation between the pop-in mode transition and the transition of homogeneous-to-heterogeneous pop-in mechanisms, and their dependence on the stressed volume size. Another interesting issue to be addressed is the quantitative relationship between the pop-in excursion and the indenter tip radius, and the number of dislocations nucleated during a single pop-in excursion. The answers to these questions provide critical insights into the understanding of size dependent plastic deformation behavior of small scales.
This paper is organized as follows. In Sec. II, the mechanism for the competition between single and successive pop-in is investigated when pop-ins are governed by the homogeneous dislocation nucleation. Also some other important issues in the pop-in mode with homogeneous deformation were investigated including the actual radius, pop-in excursion length, and the number of nucleated dislocations in an individual pop-in. In Sec. III, we discussed the pop-in mode based on a statistical model that combines the homogeneous and heterogeneous nucleation mechanisms. Finally, concluding remarks are given in Sec. IV.
II. FIRST POP-IN BY HOMOGENEOUS DISLOCATION NUCLEATION
A. Pop-in modes
In Fig. 1(a), the P–h curve of a Mo(100) single crystal exhibits a very clear pop-in with a displacement excursion of about 50 nm. Reference Wang, Bei, Li, Gao, George and Nieh23 Before this pop-in, the P–h curve is purely elastic and can be described by the Hertzian contact theory,
 $$P = {4 \over 3}{E_{\rm{r}}}\sqrt {R{h^3}} \quad ,$$
where the reduced modulus E r is 262 GPa. After the first pop-in, the dislocation density increases immediately to accommodate the applied plastic strain fields which scale as a/R. Eventually, a fully plastic deformation stage is reached, and the corresponding applied load is proportional to the material hardness H,
 $$P = \pi {a^2}H \approx 2\pi HRh\quad {\rm{.}}$$
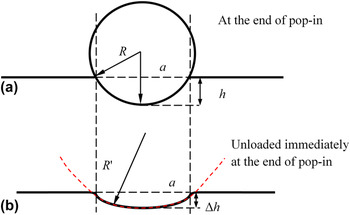
As shown in Fig. 2(a), the contact area can be approximated as πa 2 = 2πRh − πh 2 ≈ 2πRh if the higher order term in h is neglected. This indicates a linear relationship between the load P and indentation depth h in the plastic stage. However, a small section of the P–h curve immediately after the end of this first pop-in can still be described by the elastic contact, if shifted laterally to the start of the pop-in to produce a “consolidated elastic curve”. Reference Gouldstone, Koh, Zeng, Giannakopoulos and Suresh29,Reference Schuh and Nieh30
(a) Schematic illustration of spherical indentation. (b) At the end of the pop-in, the P–h response is still elastic but described by an effective indenter radius R eff, given by R eff = (1/R − 1/R′)−1, where R′ is the radius of the plastic contact impression.

Successive pop-ins are found in Ni(100) nanoindentation with a tip radius of 220 nm, as shown in Fig. 1(b), where four pop-ins in early stages of deformation are marked. Reference Wang, Bei, Li, Gao, George and Nieh23 The excursion, Δh, is about 5 nm. Again if the excursions are removed, the resulting P–h response appears to be elastic, as shown by the consolidated curve. However, if fitted to the Hertzian solution in Eq. (1), the resulting indenter radius is larger than 220 nm in this portion of the consolidated curve. This discrepancy will be addressed in Sec. II. B. The contact response after each pop-in appears to be still elastic, which might indicate that the highly stressed zone has pushed away the nucleated dislocations produced in each pop-in. Observations in NiAl and Cr3Si single crystals Reference Li, Gao, Bei and George12,Reference Bei, George, Hay and Pharr24 show single pop-ins similar to those in BCC (Body Centered Cubic) Mo in Fig. 1(a), while those in the Al sample Reference Durst, Backes, Franke and Göken26 show successive pop-ins like the FCC Ni in Fig. 1(b). The major difference between these two groups of observations is the lattice resistance, which is high in BCC Mo and intermetallic NiAl and Cr3Si, and low in FCC Ni and Al. Thus, it is suggested that the lattice resistance plays an important role in pop-in when the pop-in mechanism is homogeneous dislocation nucleation.
Using an indenter radius of 580 nm, Shim et al. found just one pop-in with an excursion of about 65 nm in Ni(100) single crystals, as shown in Fig. 1(c). Reference Shim, Bei, George and Pharr11 The samples used in Figs. 1(b) and 1(c) were prepared from the same single crystal rod using the same polishing method, so that the initial conditions (e.g., pre-existing defect density) should be identical. However, the pop-in behavior changes from successive to single mode. Thus, the pop-in mode is also governed by the indenter radius. Again the consolidated curve is elastic but with a fitted indenter radius larger than the nominal value of 580 nm.
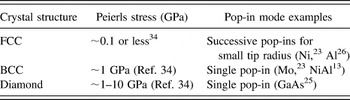
The dependence of pop-in mode on the indenter radius and the possible role played by the lattice resistance can be qualitatively explained as follows. In all the examples in Fig. 1, the pop-in shear stresses are about μ/7, which indicates that the first pop-in is due to a homogeneous dislocation nucleation mechanism. With a small indenter radius, the contact size and the size of the stressed volume are also small. Prior dislocation mechanics analysis has suggested that the nucleated dislocations will have higher probability to be pushed away from the highly stressed zone. Reference Lilleodden, Zimmerman, Foiles and Nix31,Reference Lodes, Hartmaier, Göken and Durst32 As a consequence, the stressed volume becomes defect free, and the subsequent deformation is elastic. However, the stress fields at the end of the pop-in are relaxed because the pop-in excursion reduces the effective indenter radius (details are given in Sec. II. B). Thus, additional forces are required to increase the stress fields to the theoretical stress that triggers the next pop-in, and such an additional load is small due to the previous small excursion so that the new pop-in occurs soon after the prior pop-in. In this scenario, the successive pop-in mode is more likely to take place for small indenters. Regarding the lattice type, it is known that dislocations in crystals with BCC or other complex structures experience much higher lattice resistance than dislocations in FCC crystals. Reference Hirth and Lothe33 The lattice resistance and pop-in modes are summarized in Table I for representative crystal structures including BCC, FCC, and diamond. Using the same indenter radius, it is thus more likely for the dislocations to be pushed away from the stressed volume for low-lattice-resistance crystals so that successive pop-ins take place (e.g., Ni in Fig. 1(b), Reference Wang, Bei, Li, Gao, George and Nieh23 Al in Ref. Reference Durst, Backes, Franke and Göken26), and more likely for dislocations to accumulate in the stressed volume for high-lattice-resistance crystals so that a single pop-in will occur (e.g., Mo in Fig. 1(a), Reference Wang, Bei, Li, Gao, George and Nieh23 GaAs in Ref. Reference Bradby, Williams, Wong-Leung, Swain and Munroe25 and NiAl in Ref. Reference Li, Gao, Bei and George12).
The lattice resistance and the pop-in modes for representative crystal lattice types.

In summary, the successive pop-in mode is probably less frequent because it requires two conditions to be met: (i) small indenter radius to limit the highly stressed zone to a small volume, and (ii) low lattice resistance so that the newly generated dislocations can easily escape from the stressed volume.
B. Effects of the actual radius of the contact impression
The consolidated curves in Fig. 1 lie slightly above the Hertzian prediction based on the P–h curve prior to the first pop-in because of the difference between the actual radius of the impression and the indenter radius. Following any pop-in, a permanent impression with a radius of R′ is made on the specimen surface, so that the Hertzian response should use an effective radius, R
eff = (1/R − 1/R′)−1.
Reference Johnson35
Consider the Ni(100) nanoindentation with R = 580 nm in Fig. 1(c) as an example. The pop-in occurs at an indentation depth of about 15 nm and the pop-in excursion Δh is about 60 nm. The procedure to estimate R′ is shown in Fig. 2. At the end of the pop-in in Fig. 1(c), the contact response is plastic, and the contact radius is related to the indentation depth by
 $a \approx \sqrt {2Rh}$
if the plasticity-induced pileup or sink-in near the contact edge is neglected. Immediately at the end of this pop-in, an elastic unloading will give rise to a permanent impression with a depth being approximately Δh (which is the pop-in excursion). The impression can be constructed geometrically by a fictitious spherical indentation with radius R′, leading to a contact size of
 $\sqrt {2R'{\rm{\Delta }}h}$
. The two states in Fig. 2 have the same contact radius, leading to hR = ΔhR′. From the data in Fig. 1(c), we find that R′ is about 2320 nm and R
eff is about 773 nm (or 1.33R). Since the indentation force scales as the square root of the effective indenter radius in Hertzian contact, this leads to the predicted magenta curve which is about 1.15 times larger than the blue curve based on R. The agreement in Fig. 1(c) validates the use of R
eff in the elastic response immediately after the end of the pop-in.
C. A pop-in excursion model
It has been noted that the pop-in excursion increases with an increase of the indenter tip radius in single pop-in mode. An approximate model can be constructed using the Hertzian contact solution in Eq. (1) and the hardness relationship in Eq. (2) at a given pop-in load. Immediately before the pop-in, the maximum shear stress under the elastic contact, i.e., the pop-in shear stress τpop-in, is related to the pop-in load, P pop-in by
 $${\tau _{{\rm{pop {{\hbox{-}} in}}}} = 0.31{\left( {{{6{P_{{\rm{pop {{\hbox{-}}} in}}}}E_{\rm{r}}^{\rm{2}}} \over {{\pi ^3}{R^2}}}} \right)^{{1 \mathord{\left/ {\vphantom {1 3}} \right. \kern-\nulldelimiterspace} 3}}}\quad .$$
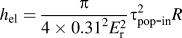
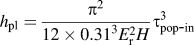
Substituting Eq. (3) into Eqs. (1) and (2), we obtain the indentation depth before and after 1st pop-in, corresponding elastic and plastic one, which are
 ${h_{{\rm{el}}}} = {\pi \over {4 \times {{0.31}^2}E_{\rm{r}}^{\rm{2}}}}\tau _{{\rm{pop {{\hbox{-}}} in}}}^2R$
and
 ${h_{{\rm{pl}}}} = {{{\pi ^2}} \over {12 \times {{0.31}^3}E_{\rm{r}}^{\rm{2}}H}}\tau _{{\rm{pop {{\hbox{-}} in}}}}^{\rm{3}}$
, respectively. Therefore an estimate of the pop-in excursion, Δh = h
pl − h
el, is given by
 $${\rm{\Delta }}h = \left( {{{{\pi ^2}} \over {12 \times {{0.31}^3}E_{\rm{r}}^{\rm{2}}H}}\tau _{{\rm{pop \hbox - in}}}^3 - {\pi \over {4 \times {{0.31}^2}E_{\rm{r}}^{\rm{2}}}}\tau _{{\rm{pop \hbox - in}}}^2} \right)R\quad .$$
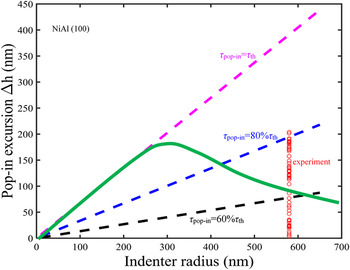
Although Eq. (4) predicts a linear relationship between Δh and R, we caution that actual experiments may not find such a relationship because of the dependence of τpop-in on R. The value of τpop-in depends on the dislocation nucleation mechanism: thermally activated, homogeneous dislocation nucleation near τth, or the heterogeneous dislocation nucleation that depends on a spatial statistics of the nucleation source distribution. At small indenter radii, the highly stressed volume is small and more likely to be defect free, so that the pop-in stress approaches the theoretical stress τth. However, the pop-in stress becomes much lower than τth when the stressed volume size increases, and eventually converges to the strength of the heterogeneous dislocation nucleation source. As will be discussed in Sec. III, both thermal activation and spatial statistics will lead to considerable fluctuations of τpop-in, so that Δh will scatter accordingly. To illustrate this further, we use the NiAl(100) pop-in data with R = 580 nm in Fig. 3. Reference Li, Gao, Bei and George12 The reduced modulus E r is 181 GPa, and the hardness H is 1.12 GPa. Predictions from Eq. (4) with different τpop-in are presented as dashed lines. Since the experiments used a large indenter, we see a considerable fluctuation below 80% of the theoretical strength. Based on previous studies for this set of experimental results, Reference Li, Bei, Morris, George and Gao13 the transition from homogeneous-to-heterogeneous dislocation nucleation happens around R = 280 nm, as shown by the green curve which predicts the trend of the average pop-in excursion as a function of the tip radius qualitatively.
Theoretical prediction of the pop-in excursion at different maximum shear stresses with respect to the theoretical stress. The green solid curve denotes the average excursion at different indenter radii due to two competing pop-in mechanisms. Experimental data (marked by red circles) are taken from NiAl(100) indentation tests in Ref. Reference Li, Gao, Bei and George12.

It should also be noted that the model in Eq. (4) may fail to agree with the experiments due to the nonspherical indenter geometry at larger indentation depths, or by the contribution from the machine stiffness to the measured indentation depth. In the former, many spherical indenters are based on blunt Berkovich indenters so that large indentation depths correspond to the pyramidal shape of the indenter. In this case, the measured pop-in excursion will be smaller than the prediction in Eq. (4). In the latter, because of the machine stiffness, a direct Hertzian fitting to obtain the indenter tip radius in the elastic contact stage may underestimate the tip radius—usually for large indenters with R larger than several micrometers, as demonstrated by using nominal radii of 2.55–100 μm for diamond indenters. Reference Li, Bei, Qu and Gao36 According to Eq. (4), an underestimate of R will lead to an underestimate of the pop-in excursion.
D. The number of nucleated dislocations in an individual pop-in
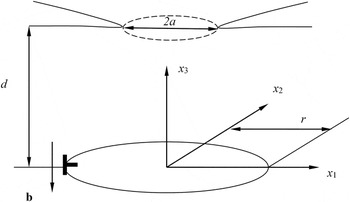
We now address the question of the number of dislocations nucleated in the substrate during one individual pop-in. A crude estimate is that one dislocation will lead to a sink-in of the faraway reference point of the indenter by an amount of Burgers vector b, so the number of nucleated dislocations will be Δh/b. As shown in the schematic illustration in Fig. 4, the nucleated dislocations are assumed to be prismatic dislocation loops under the contact. While it is true that a prismatic dislocation loop will lead to a sink-in of the faraway reference points (in the indentation direction) by b in an infinite solid, the existence of the free surface outside the contact will provide additional compliance of the system and thus relax the approaching of the reference point of the indenter toward the substrate. It is thus necessary to investigate the influence of the elastic relaxation due to free surface using a simple micromechanical analysis.
In this highly idealized pop-in model, a circular prismatic dislocation loop of radius r is assumed to be located at depth d. The presence of such a dislocation loop will generate a sink-in of the indenter, as calculated in Fig. 5.

In an infinite space, the stress field at x i caused by a dislocation loop shown in Fig. 4 is given Reference Hirth and Lothe33,Reference Gao and Larson37
 $${\sigma _{\alpha \beta }} = - {\mu \over {8\pi }}\oint_C {{b_m}{\varepsilon _{im\alpha }}{\partial \over {\partial {{x'_i}}}}{{\nabla '}^2}L{\rm{d}}{{x'_\beta} }} - {\mu \over {8\pi }}\oint_C {{b_m}{\varepsilon _{im\beta }}{\partial \over {\partial {{x'_i}}}}{{\nabla '}^2}L{\rm{d}}{{x'_\alpha} }} - {\mu \over {4\pi \left( {1 - \nu } \right)}}\oint_C {{b_m}{\varepsilon _{imk}}\left( {{{{\partial ^3}L} \over {\partial {{x'_i}}\partial {{x'_\alpha }\partial {{x'_\beta }}}}} - {\delta _{\alpha \beta }}{\partial \over {\partial {{x'_i}}}}{{\nabla '}^2}L} \right){\rm{d}}{{x'_k}}} \quad ,$$
where
 $L = \sqrt {{{\left( {{{x'}_1} - {x_1}} \right)}^2} + {{\left( {{{x'}_2} - {x_2}} \right)}^2} + {{\left( {{{x'}_3} - {x_3}} \right)}^2}}$
, ε
ijk
is the permutation tensor, and δ
ij
is the Kronecker delta. The line integral is carried out along the dislocation loop. The summation convention is implied for repeated indices. From Fig. 4, defining
 ${x'_1} = r\,\cos \,\theta$
and
 ${x'_2} = r\,\sin \,\theta$
, considering a prismatic dislocation loop b = −b
e
3, and because
 ${x'_3} = 0$
, we obtain
 $${\sigma _{33}} = {{\mu b} \over {4\pi \left( {1 - \nu } \right)r}}\sum\limits_{33} {\left( {{{{x_1}} \over r},{{{x_2}} \over r},{{{x_3}} \over r}} \right)} \quad ,$$
 $$\sum\limits_{33} {\left( {{{\bar x}_1},{{\bar x}_2},{{\bar x}_3}} \right)} = \int_0^{2\pi } {\left\{ {{{ - 1 + {{\bar x}_2}\,\sin \,\theta + {{\bar x}_1}\,\cos \,\theta } \over {{{\bar L}^3}}} + {{3\bar x_3^2\left( { - 1 + {{\bar x}_2}\,\sin \,\theta + {{\bar x}_1}\,\cos \theta } \right)} \over {{{\bar L}^5}}}} \right\}{\rm{d}}\theta \quad ,}$$
 $$\bar L = \sqrt {{{\left( {\cos \,\theta - {{{x_1}} \over r}} \right)}^2} + {{\left( {\sin \,\theta - {{{x_2}} \over r}} \right)}^2} + {{\left( {{{{x_3}} \over r}} \right)}^2}\quad .}$$
The introduction of the traction-free surface outside the contact in Fig. 4 is equivalent to the linear superposition of the dislocation loop solution in an infinite space in Eq. (5) and an external circular crack subjected to surface tractions that are opposite to those in Eq. (6). The latter problem leads to a relaxation of the faraway reference points of the two bodies in contact. Consequently, when a dislocation loop is nucleated, the faraway reference point sinks in by an amount of b − δ*, where δ* is the separation due to tractions acting on the crack surfaces so as to cancel the tractions due to a dislocation loop in an infinite body, given by
 $$\delta {\rm{^*}} = {b \over {2\pi }}\int_{{a \mathord{\left/ {\vphantom {a r}} \right. \kern-\nulldelimiterspace} r}}^\infty {{{{{\bar x}_1}} \over {{a \mathord{\left/ {\vphantom {a r}} \right. \kern-\nulldelimiterspace} r}}}\,{{\cos }^{ - 1}}\left( {{{{a \mathord{\left/ {\vphantom {a r}} \right. \kern-\nulldelimiterspace} r}} \over {{{\bar x}_1}}}} \right)\sum\limits_{33} {\left( {{{\bar x}_1},0,{d \over r}} \right)} {\rm{d}}{{\bar x}_1}} \quad .$$
The above integral is based on the basic solution of the faraway displacement caused by a circle of line forces on an external circular crack. Reference Lee, Gao, Johanns and Pharr6,Reference Tada, Paris and Irwin38
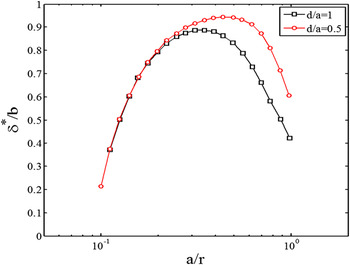
Numerical quadrature of Eq. (9) gives rise to the results in Fig. 5 for two representative values of the dislocation location. When the dislocation loop is close to the contact center and comparable in size to the contact radius, δ*/b is very close to unity, indicating that the elastic relaxation due to the free surfaces outside the contact brings the sink-in from b to a very small fraction of b. In this case, the prediction of Δh/b significantly underestimates the number of nucleated dislocations. When the dislocation loop is either much larger or much smaller than the contact radius, the elastic relaxation plays a negligible role, so that Δh/b becomes a fair prediction of the number of nucleated dislocations in an individual pop-in.
The relationship between the normalized separation δ*/b and the normalized contact radius a/r plotted for a prismatic dislocation loop that is located at two representative depths.

Unfortunately, this model is not capable of predicting the equilibrium position and size of the nucleated dislocation loop. Observations from prior microscopy work Reference Kwon, Brandes, Sudharshan Phani, Pilchak, Gao, George, Pharr and Mills39 and molecular dynamics simulations Reference Lilleodden, Zimmerman, Foiles and Nix31,Reference Lodes, Hartmaier, Göken and Durst32,Reference Ziegenhain, Urbassek and Hartmaier40 can shed light on this drawback. Although molecular simulations found that the nucleated dislocations lie close to the indenter center, it should be noted that these simulations are limited to very small indenter radii (usually on the order of several to several tens of nanometers). Kwon et al. showed that the use of an indenter radius larger than a few hundreds of nanometers will lead to dislocations quite far from the contact (usually >5 times of the contact radius), with the dislocation loop radius comparable to the contact radius. This will give only a small contribution of δ*/b. Reference Kwon, Brandes, Sudharshan Phani, Pilchak, Gao, George, Pharr and Mills39 Therefore, it is usually not necessary to take the elastic relaxation into consideration except for small indenter radii.
III. A STATISTICAL MODEL THAT COMBINES THE HOMOGENEOUS AND HETEROGENEOUS NUCLEATION MECHANISMS FOR THE FIRST AND SUCCESSIVE POP-INS
As discussed earlier, for large stressed volumes, both homogeneous and heterogeneous dislocation nucleation mechanisms contribute to the pop-in behavior. A unified model has been developed to combine both mechanisms.
Reference Li, Bei, Morris, George and Gao13
The homogeneous dislocation nucleation occurs when the maximum shear stress approaches but is slightly lower than the theoretical strength τth. Based on the transition state theory, the thermal nucleation rate per unit volume can be represented by
 $\dot n = {\dot n_0}\,\exp \left( { - {{{\rm{\Delta }}\Pi \left( {{\tau _{{\rm{appl}}}}} \right)} \mathord{\left/ {\vphantom {{{\rm{\Delta }}\Pi \left( {{\tau _{{\rm{appl}}}}} \right)} {{k_{\rm{B}}}T}}} \right. \kern-\nulldelimiterspace} {{k_{\rm{B}}}T}}} \right)$
, where
 ${\dot n_0}$
is an attempt frequency per unit volume, k
B is the Boltzmann constant, T is the absolute temperature, and the activation energy barrier ΔΠ(τappl) approaches zero when the applied stress τappl → τth. The form of ΔΠ(τappl) has been discussed in detail in Ref. Reference Li, Gao, Bei and George12, and will not be addressed here. The survivability for the first pop-in can be expressed as
 $${q_{{\rm{homo}}}} = \exp \left\{ { - {{\dot n}_0}\sum\limits_\alpha {\int_0^{{P_{{\rm{pop - in}}}}} {\int\!\!\!\int\!\!\!\int_\Omega {\exp \left( { - {{\Delta {\Pi ^{\left( \alpha \right)}}\left( {\tau _{{\rm{RSS}}}^{\left( \alpha \right)}} \right)} \over {{k_{\rm{B}}}T}}} \right){\rm{d}}\Omega } {{{\rm{d}}P} \over {\dot P}}} } } \right\}\quad ,$$
where the triple integral is conducted on the stressed volume Ω, and all slip systems (as numbered by α) are considered. The applied stress in Eq. (10) is the resolved shear stress on a given slip system
 $\tau _{{\rm{RSS}}}^{\left( \alpha \right)}$
. The survivability q relates to the cumulative probability f by f = 1 − q. The prediction from the above homogeneous dislocation nucleation model agrees well with indentation experiments in small stressed volumes and with low pre-existing defect density.
Reference Li, Gao, Bei and George12
For the heterogeneous dislocation nucleation mechanism, following Ref. Reference Morris, Bei, Pharr and George18, we assume that there exists a random distribution of pre-existing defects with a defect strength of τdefect. If the applied shear stress reaches this value, a pop-in phenomenon will occur by a heterogeneous mechanism. The variation of the pop-in stress arises from the probability to find such defects in the stressed volume. The probability of not finding a pre-existing defect in a stressed volume V d (in which the contact-induced shear stress is larger than τdefect) is assumed to follow a Poisson distribution, leading to the survivability of the heterogeneous pop-in mechanism expressed by
 $${q_{{\rm{hetero}}}} = \exp \left( { - {\rho _{{\rm{defect}}}}{V_{\rm{d}}}} \right)\quad ,$$
where ρdefect is the pre-existing defect density in units of [length]−3.
Upon combining the above two mechanisms, Reference Li, Bei, Morris, George and Gao13 we obtain the cumulative pop-in probability:
 $$\eqalign{ & f = 1 - {q_{{\rm{homo}}}} \times {q_{{\rm{hetero}}}} \cr & = 1 - \exp \left\{ { - {{\dot n}_0}\sum\limits_\alpha {\int_0^{{P_{{\rm{pop - in}}}}} {\int\!\!\!\int\!\!\!\int_\Omega {\exp \left( { - {{{\rm{\Delta }}{\Pi ^{\left( \alpha \right)}}\left( {\tau _{{\rm{RSS}}}^{\left( \alpha \right)}} \right)} \over {{k_{\rm{B}}}T}}} \right){\rm{d}}\Omega } {{{\rm{d}}P} \over {\dot P}}} } } \right\} \times \exp \left( {1 - {\rho _{{\rm{defect}}}}{V_{\rm{d}}}} \right)\quad . \cr}$$
The unified model in Eq. (12) is not limited only to the first pop-in, since the heterogeneous dislocation nucleation mechanism can be adjusted with the defect density, ρdefect. Upon the end of (n − 1)-th pop-in excursion, the n-th pop-in can again be described by Eq. (12) with the updated stressed volume, V
d,n−1 → V
d,n
, and the updated defect density, ρdefect,n−1 → ρdefect,n
. The successive increment of the stressed volume simply scales as the pop-in excursion, i.e.,
 $\Delta h_{n - 1}^3$
. The model in Sec. II. D suggests that the number of dislocations nucleated in the (n − 1)-th pop-in scales as Δh
n−1/b, so the increment of the dislocation density can be easily estimated. However, the defect density change is not just the change of dislocation density, since the defects in our above model are the heterogeneous nucleation sources. One example is that additional Frank–Read sources can be created after the increase of total dislocation density leads to more dislocation junctions, implying that the heterogeneous nucleation source density will be lower than the dislocation density. The above difference can be illustrated in Fig. 6. Nanoindentation pop-in tests on FCC single crystals of Fe–30Ni (in at.%) were conducted,
Reference Xia, Bei, Gao, Catoor and George14
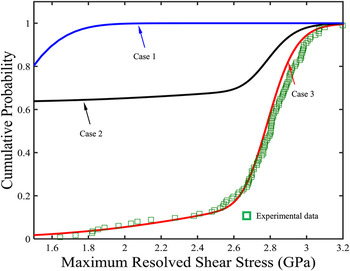
with our modeling result shown as the red curve. The indenter radius used in the tests was 400 nm. The theoretical strength of Fe–30Ni is 2.98 GPa. Key modeling parameters pertinent to our model in Fig. 6 include the pre-existing defect density, ρdefect = 3.1 μm−3, and the defect strength, τdefect = 0.04τth. Near the theoretical strength, the cumulative probability is governed by the homogeneous dislocation nucleation mechanism. The long tail extends from about 2.6 GPa to 1.6 GPa, which is governed by the stochastic nature of finding pre-existing defects.
The predicted cumulative probability of the first and second pop-in events. Experimental data are for Fe–30Ni single crystals with R = 400 nm in Ref. Reference Xia, Bei, Gao, Catoor and George14. The initial defect density used in the prediction is 3.1 μm−3.

Prediction of the second pop-in follows Eq. (12) with the following possible updates of the defect density, Δρdefect, or the defect number, Δn defect, at the end of the first pop-in:
-
• Case 1: If all the dislocations nucleated during the pop-in excursion transform into defect sources for the next pop-in in the stressed volume, we will have Δn defect = Δh n=1/b which can be calculated from Eq. (4). The cumulative probability for the second pop-in is shown by the blue curve in Fig. 6, most of which approaches 100%. In this case, the subsequent pop-ins will most likely occur right after the first pop-in, thus leading to a single pop-in mode and continuum plastic flow right after the first pop-in.
-
• Case 2: If we assume that after the first pop-in, the number of heterogeneous nucleation sources increases by one, there is a finite probability for the second pop-in to occur, as shown by the black curve. From Eqs. (11) and (12), the asymptotic limit at low pop-in stress will be 0.637 (= 1 − exp(−1)). Since there is a finite probability for the second pop-in to occur, the final load–displacement curve can display one, or two, or three, or more pop-ins, followed by the continuum plastic response.
-
• Case 3: In this extreme case, we assume that there is no new dislocation nucleation source generated in the first pop-in excursion. The cumulative probability curve for the second pop-in will be the same as that for the first pop-in. Similar to Case 2, the final load–displacement curves can have one or many pop-ins.
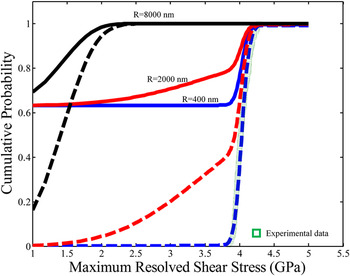
Using the nanoindentation pop-in data for FCC single crystals of Fe–15Cr–15Ni (in at.%) with R = 400 nm, Reference Xia, Bei, Gao, Catoor and George14 the change of indenter radius will lead to a transition from homogeneous dislocation nucleation mechanism (e.g., R = 400 nm), to the intermediate stochastic behavior (e.g., R = 2 μm), and to the heterogeneous mechanism (e.g., R = 8 μm), as shown in Fig. 7. The assumed theoretical strength is 4.17 GPa, and the pre-existing defect density is 0.03 μm−3. A question of interest is what the second pop-in behavior will be when the first pop-in is dominated by different mechanisms. Note that Cases 1 and 3 in Fig. 7 are quite obvious, so that we only illustrate the results of Case 2 for the second pop-in. When the tip radius is small, the first pop-in arises from the homogeneous dislocation nucleation mechanism, so that the pop-in stress is already very high. Thus, the second pop-in still occurs by the homogeneous mechanism, and the pop-in mode may be single or successive with comparable probabilities. When the tip radius is large, the first pop-in is governed by the heterogeneous mechanism with the pop-in strength approaching the bulk stress (on the order of about μ/100–μ/1000). Different from the single pop-in examples with long excursion in Fig. 1, here the pop-in is governed by the heterogeneous dislocation nucleation mechanism, meaning that there is pre-existing defect in the stressed volume which is easy to activate. In this case, the second pop-in behavior depends critically on how the dislocation structure and heterogeneous dislocation nucleation sources evolve under the contact. Since the total number of dislocations and nucleation sources are already high in the stressed volume, it is more likely to generate more nucleation sources. Consequently, the resulting pop-in behavior is more likely to be the successive mode with small excursions on each pop-in, and the load–displacement response very quickly becomes continuum plastic.
The cumulative probability of the first (dashed line) and second (solid line) pop-in at different indenter radii. Predictions are based on parameters for nanoindentation tests on Fe–15Cr–15Ni single crystals in Ref. Reference Xia, Bei, Gao, Catoor and George14.

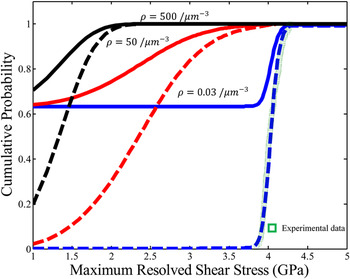
Effects of the pre-existing defect density are examined in Fig. 8, which shows a qualitative trend similar to the effects of R in Fig. 8, that is, when ρdefect is low (e.g., 0.05 μm−3), the second pop-in may be single or successive mode with comparable chances. When ρdefect is high (e.g., 500 μm−3), it is more likely to have successive pop-ins with small excursions. The change of ρdefect (which can be accomplished by pre-straining, e.g., Ref. Reference Bei, Xia, Barabash and Gao22) is equivalent to a change of R. Because of this, the pop-in behavior can be characterized by the dimensionless parameter,
 $R\rho _{{\rm{defect}}}^{{1 \mathord{\left/ {\vphantom {1 3}} \right. \kern-\nulldelimiterspace} 3}}$
.
The cumulative probability of the first (dashed line) and second (solid line) pop-in for different pre-existing defect densities. Other parameters are taken from nanoindentation tests on Fe–15Cr–15Ni single crystals in Ref. Reference Xia, Bei, Gao, Catoor and George14.

Based on the analysis above and the discussion in Sec. II. A, the pop-in modes which can be determined by
 $R\rho _{{\rm{defect}}}^{{1 \mathord{\left/ {\vphantom {1 3}} \right. \kern-\nulldelimiterspace} 3}}$
and lattice type, are summarized as follows.
-
• Small
 $R\rho _{{\rm{defect}}}^{{1 \mathord{\left/ {\vphantom {1 3}} \right. \kern-\nulldelimiterspace} 3}}$
: In this case, the pop-in mechanism is dominated by the thermally activated, homogeneous dislocation nucleation. It is more likely for single crystals with weak lattice resistance (such as pure FCC metals) to have the successive pop-in mode with small excursions, and each pop-in occurs near the theoretical stress. On the other hand, BCC-type behavior will lead to a single pop-in and a large excursion, followed by the continuum plastic response.
-
• Intermediate
$R\rho _{{\rm{defect}}}^{{1 \mathord{\left/ {\vphantom {1 3}} \right. \kern-\nulldelimiterspace} 3}}$
: In this case, the pop-in behavior results from a convolution of homogeneous dislocation nucleation and the stochasticity of finding heterogeneous nucleation sources, with latter dominating with an increase of
$R\rho _{{\rm{defect}}}^{{1 \mathord{\left/ {\vphantom {1 3}} \right. \kern-\nulldelimiterspace} 3}}$
. Whether and how the second pop-in occurs depends on the evolution of the heterogeneous dislocation nucleation sources. When additional dislocation nucleation sources can be easily generated (e.g., for materials in which dislocation junctions are easy to form), the pop-in behavior will resemble Case 1 in Fig. 7, and a single pop-in mode will be more likely to be observed. The pop-in excursion depends on τpop-in by Eq. (4), i.e., a higher (lower) pop-in stress will give a larger (lower) pop-in displacement excursion. When additional dislocation nucleation sources are difficult to generate and the first pop-in occurs at a small stress, the pre-existing defects that produce the first pop-in will operate again for the second pop-in, leading to the successive mode. -
• Large
$R\rho _{{\rm{defect}}}^{{1 \mathord{\left/ {\vphantom {1 3}} \right. \kern-\nulldelimiterspace} 3}}$
: In this case, the first pop-in stress is extremely low. It is equally possible to see one or a few pop-ins on the P–h curve, all of which have very small excursions. With an increase of
$R\rho _{{\rm{defect}}}^{{1 \mathord{\left/ {\vphantom {1 3}} \right. \kern-\nulldelimiterspace} 3}}$
, these excursions become too small to be detected, and the overall behavior becomes continuum-like.


IV. CONCLUSION
Two types of pop-in modes, single versus successive, are systematically studied in this work. The first pop-in critically depends on the normalized indenter radius,
 $R\rho _{{\rm{defect}}}^{{1 \mathord{\left/ {\vphantom {1 3}} \right. \kern-\nulldelimiterspace} 3}}$
. It is found that at small
 $R\rho _{{\rm{defect}}}^{{1 \mathord{\left/ {\vphantom {1 3}} \right. \kern-\nulldelimiterspace} 3}}$
, whether the pop-in mode is single or successive depends on the lattice resistance. At intermediate and large
 $R\rho _{{\rm{defect}}}^{{1 \mathord{\left/ {\vphantom {1 3}} \right. \kern-\nulldelimiterspace} 3}}$
, the pop-in mode depends on the generation rate of heterogeneous dislocation nucleation sources. We also provide quantitative models of the pop-in excursion and the number of the nucleated dislocations in an individual pop-in. These analyses provide critical insights needed to understand pop-in in a variety of single crystals tested with various indenter radii and at various prestrain levels.
ACKNOWLEDGMENTS
This work was sponsored by the U.S. Department of Energy, Office of Science, Basic Energy Sciences, Materials Sciences and Engineering Division (HB, GMP, YFG), and by a graduate fellowship from the Joint Institute for Advanced Materials, University of Tennessee (YZX).