Introduction
Strawberry (Fragaria × ananassa) is an economically important crop in the USA, with 17401 ha harvested during 2020, worth $2.1 billion (USDA National Agricultural Statistics Service, 2021). Two states, California (CA) and Florida (FL), dominate strawberry production. But from 2007 to 2017, CA and FL strawberry cropland decreased (by 941 and 1176 ha, respectively), while increasing by >40 ha for each of the following states: Indiana, Maine, Michigan, Minnesota, New York, Ohio, Pennsylvania, Washington, Wisconsin and North Carolina (USDA National Agricultural Statistics Service Census of Agriculture, 2007; USDA National Agricultural Statistics Service Census of Agriculture, 2017). Drought, increased urbanization and lack of labor contributed to declines in CA and FL, whereas increased consumer demand for locally-produced food contributed to increases in the other referenced states (Samtani et al., Reference Samtani, Rom, Friedrich, Fennimore, Finn, Petran, Wallace, Pritts, Fernandez, Chase, Kubota and Bergefurd2019).
Commercial strawberry production in many regions frequently uses annual hill production (AHP) systems—wherein berry plants are grown as annuals on raised beds covered by plastic mulch, with soil fumigation before planting to control diseases and drip fertigation to supply water and nutrients (O'Dell and Williams, Reference O'Dell and Williams2009). This system is highly effective because it conserves water, suppresses weeds and controls pathogens (Samtani et al., Reference Samtani, Rom, Friedrich, Fennimore, Finn, Petran, Wallace, Pritts, Fernandez, Chase, Kubota and Bergefurd2019), but is associated with negative environmental consequences. A growing body of evidence indicates that soil microplastics from plastic degradation negatively impact organisms that provide essential ecosystem services (de Souza Machado et al., Reference de Souza Machado, Kloas, Zarfl, Hempel and Rillig2018). Human health impacts of microplastic bioaccumulation in plants and animals are uncertain (Galloway, Reference Galloway, Bergmann, Gutow and Klages2015; Conti et al., Reference Conti, Ferrante, Banni, Favara, Nicolosi, Cristaldi, Fiore and Zuccarello2020). Plastic mulch may also cause economic hardships for producers, because the mulch must be removed and disposed. The cost of removing and disposing plastic mulch depends on the crop type, labor costs, transportation costs and landfill disposal fees—all of which vary widely by region (Velandia et al., Reference Velandia, Smith, Wszelaki, Galinato and Marsh2020). Examples of total disposal costs range from $250 ha−1 (Shogren and Hochmuth, Reference Shogren and Hochmuth2004) to a more recent estimate of $901 ha−1 (Fonsah and Shealey, Reference Fonsah and Shealey2019), calculated based on costs in Georgia, USA. Biodegradable plastic films exist, but are not allowable under the US National Organic Program (Dentzman and Goldberger, Reference Dentzman and Goldberger2020). Consequently, strawberry growers, especially organic producers, seek biodegradable alternatives to plastic mulch.
In many US regions, matted row production (MRP) systems once dominated, because the cost of establishment and maintenance is relatively low, and plantings can be productive for a number of years (Hancock et al., Reference Hancock, Goulart, Luby and Pritts1997). To establish MRP plantings, bare root plants are spaced farther apart compared to AHP, and clonal runners fill in the gaps between plants. After the establishment year straw is often applied before winter to protect strawberry plants from cold (Weber, Reference Weber2003), but this material is typically removed after the winter (Hoover et al., Reference Hoover, Rosen, Luby and Wold-Burkness2017). Therefore, during the establishment year, MRP plantings are vulnerable to interference from weeds that emerge in the large extent of bare soil between strawberry plants (Pritts and Handley, Reference Pritts and Handley1998; Weber, Reference Weber2003). Pritts and Kelly (Reference Pritts and Kelly2001) found strawberry yield was reduced by 5.5% for every 100 g m−2 of weed biomass. But hand weeding and cultivation for weed removal also damaged strawberry plants and negatively affected yield (Pritts and Kelly, Reference Pritts and Kelly2001). Few herbicides are approved for strawberry (Samtani et al., Reference Samtani, Weber and Fennimore2012), and evidence demonstrates that consumers increasingly prefer organic strawberries (Gu et al., Reference Gu, Guan and Beck2017). Consequently, growers in regions where MRP systems once dominated (primarily northern areas of the USA) are shifting to AHP systems, because plastic mulch addresses these weed management challenges (Hokanson and Finn, Reference Hokanson and Finn2000; Samtani et al., Reference Samtani, Rom, Friedrich, Fennimore, Finn, Petran, Wallace, Pritts, Fernandez, Chase, Kubota and Bergefurd2019). Because plastic mulch is not environmentally sustainable, finding new ways to suppress weeds in MRP systems might encourage producers to reconsider this traditional approach over plasticulture. As many northern US states are expanding strawberry production, switching back to the MRP system, which is well suited to this region, could substantially reduce plastic use.
Previous research focused on evaluating biodegradable mulches for establishment year weed management in MRP systems. Weber (Reference Weber2003) showed that Kraft paper coated with black biodegradable polymer suppressed weeds but did not allow runner establishment. Kraft paper coated with clear biodegradable polymer allowed runner establishment, but did not suppress weeds. Black paper non-coated mulch adequately suppressed weeds until it was degraded by wind. Another study demonstrated that wool-based fabric mulch provided both weed suppression and runner establishment (Forcella et al., Reference Forcella, Poppe, Hansen, Head, Hoover, Propsom and McKensie2003), but this material is no longer available. These results indicate that biodegradable mulches that suppress weeds effectively, resist tearing by wind and allow rooting by runners need further development for use in MRP.
Mulch consisting of hemp hurd (hereafter referred to as ‘hemp mulch’) may be a suitable mulch to use for weed suppression during strawberry establishment in MRP systems. Hurd is the soft, woody, inner core of the hemp (Cannabis sativa L.), composing 60–80% of the plant stalk (Pecenka et al., Reference Pecenka, Luhr and Gustovis2012). Hurd is a byproduct often requiring disposal, so finding uses for it will contribute to hemp production sustainability (Wang et al., Reference Wang, Wu, Wang and Zhang2011; Stevulova et al., Reference Stevulova, Cigasova, Estokova, Terpakova, Geffert, Kacik, Singovszka and Holub2014). Hemp hurd is used for animal bedding, paper products and building materials (Salentijn et al., Reference Salentijn, Zhang, Amaducci, Yang and Tringdale2014). Companies selling hemp hurd as mulch claim the material is durable, suppresses weeds, resists wind displacement, insulates soil from temperature extremes, and enhances soil micro and mega fauna (American Hemp Mulch, 2021; Hemp Technologies, 2021; Hemp Works, 2021). These properties might make hemp hurd mulch ideal for use in MRP systems, but need to be evaluated before recommendations can be made.
Nutrient and disease management can also be challenging in MRP, especially in organic systems, wherein fumigation and synthetic fungicides are not allowed. Biochar has been proposed as a soil amendment that could enhance crop nutrition and disease suppression. Biochar is a byproduct of biofuel production by pyrolysis, which refers to burning various organic feedstocks (e.g., wood or other plant dry matter) at high temperatures (Gravel et al., Reference Gravel, Dorais and Ménard2013). Biochar is a stable form of carbon with a high capacity for sequestering soil carbon and retaining soil nutrients; as such, it is of interest with regard to climate change mitigation and soil health improvement (Lehmann, Reference Lehmann2007; Atkinson et al., Reference Atkinson, Fitzgerald and Hipps2010). De Tender et al. (Reference De Tender, Haegeman, Vandecasteele, Clement, Cremelie, Dawyndt, Martine and Debode2016) demonstrated that adding 3% wood-derived biochar to a peat growth medium enhanced strawberry root formation, fruit production and fruit postharvest resistance against gray mold (Botrytis cinerea Pers.). Harel et al. (Reference Harel, Elad, Rav-David, Borenstein, Shulchani, Lew and Graber2012) also showed that 3% wood-derived biochar added to a peat growth media decreased strawberry infection by three fungal pathogens. Conversely, research conducted in the field on a sandy loam soil showed that various rates of wood-derived biochar did not influence strawberry yield, a result attributed to existing adequate soil fertility (Jay et al., Reference Jay, Fitzgerald, Hipps and Atkinson2015).
We conducted experiments at Absaraka and Dickinson, North Dakota during 2015 and 2016 to investigate the impacts of two biodegradable mulch materials (hemp mulch and commercial paper mulch) and soil-applied wood-derived biochar on weed suppression, strawberry growth and fruit yield in MRP. We also collected limited data to quantify mulch material impacts on soil moisture, soil temperature and soil nutrients; we furthermore assessed biochar impacts on soil moisture and soil nutrients. We hypothesized that hemp and paper mulch and biochar would be associated with enhanced weed suppression and beneficial effects on strawberry growth and fruit yield.
Methods
Experimental design
Field trials were conducted during 2015 and 2016 at the North Dakota State University (NDSU) Horticulture Research Farm in Absaraka, ND (46.987624, −97.352319) and at the NDSU Dickinson Research Extension Center in Dickinson, ND (46.893566, −102.819951). Soils were predominantly Warsing Loam at the Absaraka site and a Farnuf loam at Dickinson. At each site, experiments were designed as two (biochar vs no biochar) by three (paper mulch, hemp hurd mulch, or zero mulch) factorials arranged in randomized complete blocks with four replications, with no preregistration.
Field operations
Pelletized composted poultry manure 4-3-5 (Ag Resource, Inc.; Detroit Lakes, MN, USA) was applied at the Absaraka site to achieve 67.3 kg N ha−1 and dried beef cow manure (7-4-7) was applied at the Dickinson site to achieve 58.8 kg N ha−1. Based on testing, soils at both sites contained 35 kg N ha−1 prior to amendment. Considering the applied plus existing soil N, the suggested N application of 90 kg ha−1 recommended for growing strawberries was approximated (Hoover et al., Reference Hoover, Rosen, Luby and Wold-Burkness2017). Because of a history of manure application at both sites, soil tests indicated adequate phosphorus and potassium for strawberry production, but both these nutrients were also supplemented because the fertilizers we used provided N, P and K. Pine-derived biochar (Biochar Now, LLC, Loveland, CO, USA) was applied at 11.3 m3 ha−1 and all plots were rototilled. The biochar rate was chosen based on input from the supplier, who had knowledge about using the material in strawberry production.
‘Cavendish’ bare-root June-bearing strawberry plants (Ag Resource, Inc.) were transplanted during early June in a staggered double row arrangement with 30.5 cm spacing between all plants, resulting in 17 plants per 3.1 × 0.6 m plot. Beds were level with the soil surface because in colder climates raised beds are vulnerable to cold damage (Dalman and Matala, Reference Dalman and Matala1997). After planting, hemp mulch (Hemp Technologies, LLC, Asheville, NC, USA) was applied at 1165 m3 ha−1 (0.13 m3 per plot). We applied hemp mulch on the basis of volume and not weight because bales we received contained differing amounts of moisture, which interfered with measuring the weight of the material. The rate was chosen to provide approximately 4 cm mulch depth. We estimate that the rate of dry hemp mulch applied was approximately 182 tons ha−1, to allow comparisons with other published research. Water was added (1:1 by volume) and the material was firmly pressed down by hand to help prevent wind displacement during installation. Paper mulch (WeedGuardPlus; Sunshine Paper Co. LLC, Aurora, CO, USA) was applied by securing 46 cm diameter paper circles (each with 8 cm center holes) around each plant with wire staples. Paper mulch would normally be applied as a sheet before planting, but circles overlapped enough to approximate a paper sheet, with few gaps. We used paper circles due to logistics that necessitated planting before mulch application.
Plants were fertilized 27 and 66 days after planting (DAP) at each site during 2015 using a 5-1-1 fish emulsion liquid fertilizer (Alaska; Lilly Miller Brands, Walnut Creek, CA, USA) at 0.6 kg N ha−1. Irrigation is recommended for strawberry establishment, as plants are shallow rooted (Hoover et al., Reference Hoover, Rosen, Luby and Wold-Burkness2017). However, we lacked the ability to irrigate at Absaraka, therefore water was applied (0.5 L plant−1) by hand once after planting strawberries to ensure establishment. At Dickinson, 0.5 L plant−1 was applied once a week via overhead sprinklers during July and August (both years). Beds were winterized in early November by covering with polypropylene fabric (Supreme Row Cover; DeWitt Company, Inc., Sikeston, MO, USA); hay was placed on top as insulation and removed completely in the spring.
Data collection
During 2015, leaves were counted for four randomly selected plants per plot at flowering onset, and flowers were removed to encourage runner production (Pritts and Handley, Reference Pritts and Handley1998). Runners were counted then pruned at the end of 2015 to leave four runners per plant. The average numbers of leaves, flowers and runners per plant were calculated as response variables. During 2015, weed density and biomass were quantified via destructive harvests of entire plots (28 and 47 DAP at Absaraka; 34 and 70 DAP at Dickinson). Weed shoots were cut from each entire plot, separated by species and counted to quantify weed density, then dried at 70°C to a constant mass, and weighed. All weeds in each plot were removed in a timely manner (i.e., before they were >15 cm tall) so that strawberry plant establishment would not be negatively affected by weeds, to separate mulch effects on strawberry establishment not related to weed suppression. As discussed above, previous research has thoroughly documented strawberry yield loss via weed competition. We scouted strawberry plants and fruits on an ongoing basis for fungal pathogens associated with strawberry, such as B. cinerea Pers. (gray mold).
During 2016, weeds remained in the plot until after harvest. Strawberries were harvested four times at Absaraka and two times at Dickinson. The number of harvest times differed because the rate of berry production differed between sites. During June 2016, sweep netting revealed a population of tarnished plant bug (Lygus lineolaris Palisot de Beauvois) that negatively impacted berry development at Absaraka. Damaged and undamaged berries were separated to quantify marketable berry proportions. Following strawberry harvest, weed dry biomass was destructively quantified as described above.
At both sites, soil temperature sensors (HOBO Pendant® Temperature/Light 64 K; Onset; Bourne, MA, USA) were installed 10 cm deep in each plot without biochar to record soil temperature every 6 h. Several sensors malfunctioned at Dickinson, therefore data were not used. To calculate maximum soil temperatures, maximum daily temperatures recorded from 9 June to 31 August (both years) were averaged. This time period best represented the active strawberry growing season from planting to full establishment. To calculate minimum temperature, minimum daily temperatures recorded from 1 January 2016 to 31 January 2016 were averaged. This time period represented the time of year when the coldest temperatures of the year occurred. During strawberry establishment, a Decagon (now Meter Environment, Pullman, WA, USA) 5TE soil moisture probe was used to measure soil volumetric water content (VWC) in each plot. A soil auger was used to drill a cylindrical hole (9 cm diameter × 20 cm deep) and the 5TE probe was inserted horizontally into the side of this hole at 15 cm deep. At the study end, ten 2 × 15 cm soil cores were collected from each plot along a linear transect. Cores were mixed, and subsamples submitted to the NDSU Soil Testing Lab (Dept. 7660 P.O. Box 6050, Fargo, ND, USA), to quantify soil nutrients (NO3-N, P, K and organic matter content using water extraction, the Olson procedure, 1N ammonium acetate and loss on ignition methods, respectively) and soil pH. Hemp hurd and paper mulch samples were tested via gas chromatography/mass spectrometry to determine carbon:nitrogen ratios.
Statistical analyses
Data were assessed for homogeneity of variance and normality for each response variable. Analysis of variance (ANOVA) tests (α = 0.05) were performed using PROC GLIMMIX in SAS 9.4 (SAS Institute Inc., Cary, NC, USA) to understand the effects of site, mulch and biochar (fixed effects) and interactions on weed biomass, strawberry yield, maximum average summer soil temperature, soil nitrogen, soil phosphorous, soil potassium, soil pH and soil organic matter, assuming normal distributions. PROC GLIMMIX in SAS 9.4 was used to determine the fixed effects of site, mulch and their interactions on non-normally distributed response variables. For count data (number of flowers, runners, leaves and weed density), data were modeled with a negative binomial distribution and a log link function. Proportional data (VWC and proportion of undamaged berries) data were modeled using a β distribution and a log link function. Replication was a random effect in all models. The ‘slice’ option was used to assess interactions. Post-hoc multiple comparisons were made using Tukey's HSD (α = 0.05) for both simple effects and sliced interactions.
Results
Establishment year weed and crop responses
Dominant weed species at Absaraka, from most to least dominant in terms of dry biomass, were (1) common lambsquarters (Chenopodium album L.), (2) common purslane (Portulaca oleracea L.), (3) stink grass [Eragrostis cilianensis (All.) Vign. ex Janchen], (4) hairy vetch (Vicia villosa Roth) and (5) redroot pigweed (Amaranthus retroflexus L.). Dominant weed species at Dickinson, from most to least dominant in terms of dry biomass, were (1) green foxtail [Setaria viridis (L.) P. Beauv.], (2) barnyardgrass [Echinochloa crus-galli (L.) P. Beauv.], (3) field bindweed (Convolvulus arvensis L.), (4) common lambsquarters and (5) common purslane.
During 2015, weed biomass response to mulch type was influenced by a two-way interaction with biochar (Table 1). Biochar influenced weed biomass only within hemp mulch, with slightly more weed biomass associated with biochar compared to zero biochar (3.1 vs 0.4 g m−2, Fig. 1A). Zero mulch was associated with greater weed biomass than paper and hemp mulch (Fig. 1A). Within zero biochar only, hemp mulch was associated with less weed biomass compared to paper mulch (0.4 vs 6.4 g m−2, Fig. 1A). At both sites, zero mulch was associated with greater weed biomass compared to hemp or paper mulch (Fig. 1B). At Absaraka only, hemp mulch was associated with less weed biomass than paper mulch (2.4 vs 10.3 g m−2), whereas at Dickinson, weed biomass did not differ between hemp and paper mulch (Fig. 1B).
(A). Mean ( + standard error) dry weed biomass (g m−2) measured during 2015 as influenced by the interactive effects of mulch type (zero, hemp hurd or paper mulch) and biochar application (zero biochar, 0; biochar applied, +). Within each level of biochar, means denoted by different lowercase letters differed at α = 0.05. (B) Mean dry weed biomass (g m−2) as influenced by interactive effects of site (ABS, Absaraka; DCK, Dickinson) and mulch type (zero, hemp hurd or paper mulch). Within each site, means denoted by different lowercase letters differed at α = 0.05.

Numerator degrees of freedom (d.f.), F-values and P-values for ANOVA tests of treatment (i.e., sources of variation) effects on the following response measures: flower number, runner number, leaf number, 2015 weed biomass (denoted by §), 2015 weed density (denoted by §), 2016 weed biomass (denoted by □), berry number, berry yield, per berry mass, proportion of misshapen berries (measured at Absaraka only), soil NO3-nitrogen, soil phosphorus, soil potassium, soil organic matter, soil pH, 2015 soil maximum temperature (Max T), 2016 soil maximum temperature, 2016 soil minimum temperature (Min T), 2015 Absaraka volumetric soil water content (VWC ABS 2015), and 2015 Dickinson volumetric soil water content (VWC DCK 2015)

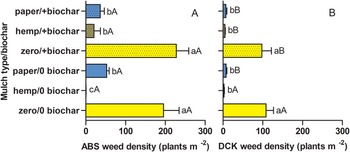
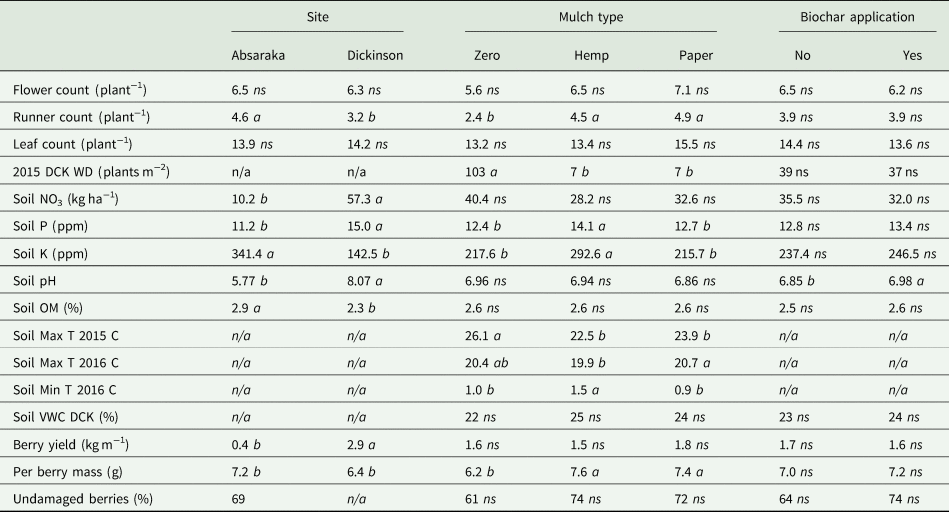
Weed density was influenced by a site × mulch type × biochar interaction (Table 1), therefore sites were analyzed separately to understand mulch type and biochar impacts on weed density (Fig. 2). At Absaraka, weed density was influenced by a mulch × biochar interaction (P = 0.0022, data not shown). Zero mulch was associated with increased weed density compared to both hemp hurd and paper mulch regardless of biochar (Fig. 2). Within zero biochar only, paper mulch was associated with greater weed density compared to hemp mulch (Fig. 2). At Dickinson, weed density was not influenced by a biochar × mulch interaction (P = 0.3036, data not shown), but zero mulch was associated with greater weed density than hemp and paper mulch (103 vs 7 plants m−2 for both mulch materials, Table 2). Mulch and biochar did not affect strawberry flower or leaf number, and biochar did not impact strawberry runner number (Tables 1 and 2). Fewer runners were produced at Dickinson compared to Absaraka (3.2 vs 4.6, respectively), and plants grown with hemp or paper mulch produced more runners than plants under zero mulch (4.5 and 4.9 vs 2.4, respectively; Table 2).
Mean ( + standard error) weed density (plants m−2), measured in 2015 at Absaraka (2.A.) and Dickinson (2.B.), as influenced by the interaction between mulch type (zero, hemp hurd and paper mulch) and biochar application (zero biochar, 0; biochar applied, +). Within each level of biochar application within each site, means denoted by different lowercase letters differed at α = 0.05. Within each mulch type × biochar application, means denoted by different uppercase letters differed at α = 0.05.

Mean univariate responses to site (Absaraka vs Dickinson), mulch type (zero, hemp hurd or paper mulch), biochar application (zero biochar, 0; biochar applied, +) for flower, runner, leaf count (all on a per plant basis), 2015 DCK (Dickinson) weed density (WD, plants m−2), soil nitrate nitrogen (NO3, kg ka-1), soil phosphorous (P, ppm), soil potassium (K, ppm), soil pH, soil organic matter (OM, %), soil maximum daily temperature at Absaraka during 2015 (Soil Max T 2015 C), soil maximum daily temperature at Absaraka during 2016 (Soil Max T 2016 C), soil minimum daily temperature during 2016 at Absaraka (Soil Min T 2016 C), strawberry yield (kg ha−1), per berry mass (g) and proportion of misshapen berries at Absaraka (%).

Within each treatment (i.e., within site, mulch type and biochar application) means labeled with different lowercase letter differed at α = 0.05. Blue text highlights significant means comparisons. Responses not shown in this table were influenced by higher-order interactions between treatments and those responses are shown elsewhere with figures.
Production year weed and crop responses
During 2016, weed biomass was impacted by a mulch type × site interaction (Table 1). At Absaraka, paper and zero mulch suppressed weeds poorly compared to hemp mulch (188 and 168 vs 36 g biomass m−2, respectively). Conversely, at Dickinson, hemp and paper mulch suppressed weeds well compared to zero mulch (21 and 11 vs 102 g biomass m−2, respectively; Fig. 3).
Mean (+standard error) dry weed biomass (g m−2) measured during 2016 as influenced by the interaction between site (Absaraka, ABS; Dickinson, DCK) and mulch type (zero, hemp hurd or paper mulch). Within each site, means denoted by different lowercase letters differed at α = 0.05.

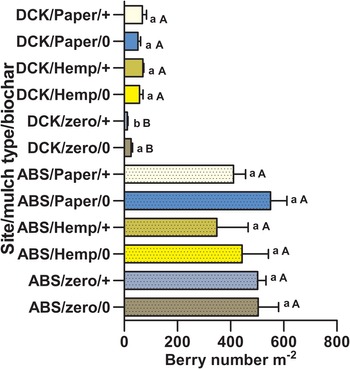
Berry number was impacted by a site × mulch × biochar interaction. Berry number was influenced by biochar only at Dickinson under zero mulch (P = 0.0099), wherein berry number decreased in association with biochar application (11 vs 25 berries m−2). At Dickinson, regardless of biochar treatment, zero mulch was associated with a decrease in berry number compared to hemp or paper mulch (Fig. 4). Berry number was not influenced by mulch type at Absaraka (Fig. 4). Berry number at Absaraka was 460 berries m−2 compared to 47 berries m−2 at Dickinson. Strawberry yield was greater at Absaraka compared to Dickinson (2.9 vs 0.4 kg m−2). Biochar application and mulch type did not influence berry yield by mass at either site (Tables 1 and 2). Zero mulch was associated with reduced per berry mass compared to hemp hurd or paper mulch (6.2 vs 7.6 and 7.4 g per berry, respectively). Per berry mass was greater at Dickinson compared to Absaraka (7.7 vs 6.4 g berry−1, respectively). Per berry mass was not influenced by biochar (Tables 1 and 2). At Absaraka, mulch type and biochar did not affect undamaged berry proportions (Tables 1 and 2).
Mean (+standard error) berry number m−2 as influenced by a three-way interaction between site (Absaraka, ABS; Dickinson, DCK), mulch type (zero, hemp hurd or paper mulch) and biochar application (biochar added, +; zero biochar, 0). Biochar impacts on berry number are denoted with each site/mulch combination by differing lowercase letters. Mulch impacts on berry number are denoted by differing uppercase letters within each site/biochar combination. All comparisons made at α = 0.05.

Soil moisture, temperature and chemical properties
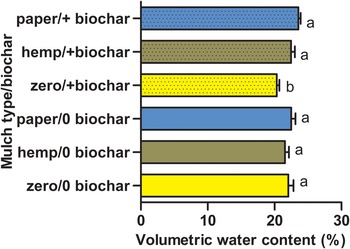
Without biochar, Absaraka VWC did not differ among mulch types, but with biochar, VWC associated with zero mulch was less than VWC associated with either hemp or paper mulch (20 vs 22 and 25%, respectively; Fig. 5). At Dickinson, VWC was not impacted by either mulch type or biochar application (Tables 1 and 2). During 2015 at Absaraka, maximum soil temperature associated with zero mulch (26.1°C) was greater than the maximum soil temperature associated with hemp and paper mulch (22.5 and 23.9°C, respectively, Table 2). During 2016 at Absaraka, maximum soil temperature associated with hemp hurd mulch was slightly lower than the maximum soil temperature associated with paper mulch (19.9 vs 20.7°C, respectively), but neither mulch differed from zero mulch (20.4°C). During winter 2016 at Absaraka, hemp mulch retained more heat compared to zero mulch and paper mulch (1.5 vs 1.0 and 0.9°C, respectively).
Mean (+standard error) volumetric soil water content (%, percent) measured at Absaraka, as influenced by mulch type (zero, hemp hurd or paper mulch) and biochar application (zero biochar, 0; biochar applied, +). Within each level of biochar, means denoted by different lowercase letters differed at α = 0.05.

At the end of the study, soil NO3-nitrogen was greater at Absaraka compared to Dickinson (57 vs 10 kg ha−1). Soil P was greater at Dickinson than Absaraka (15.0 vs 11.2 ppm). Hemp mulch was associated with greater soil P (14.1 ppm) compared to paper mulch or zero mulch (12.7 and 12.4 ppm, respectively). Soil K was greater at Dickinson than Absaraka (341.4 vs 142.5 ppm). Soil K associated with hemp mulch (292.6 ppm) was greater than soil K associated with paper mulch or zero mulch (215.7 and 217.6 ppm, respectively). Soil pH at Absaraka was greater than soil pH at Dickinson (8.1 vs 5.8). Biochar application was associated with a slight increase in soil pH compared to no biochar application (6.98 vs 6.85). Organic matter was greater at Absaraka compared to Dickinson (2.9 vs 2.3%, respectively), but was not impacted by biochar application or mulch type (Tables 1 and 2).
Discussion
Biochar impacts
Research about plant productivity in response to biochar application to soil has produced variable results, but a meta-analysis showed that biochar was often associated with enhanced plant aboveground productivity and crop yield (Biederman and Harpole, Reference Biederman and Harpole2013). Jay et al. (Reference Jay, Fitzgerald, Hipps and Atkinson2015) applied wood-derived biochar at rates of 0, 20 and 50 tons ha−1 and found no impact on strawberry yield or foliar nutrient content for N, P, K, Mg, S, Ca, B, Fe, Zn and Cu. De Tender et al. (Reference De Tender, Haegeman, Vandecasteele, Clement, Cremelie, Dawyndt, Martine and Debode2016) showed that wood-derived biochar was associated with enhanced strawberry growth for plants grown in a nutrient-poor peat-based potting medium. Previous research has demonstrated that wood-derived biochar suppressed fungal pathogens attacking strawberry (Harel et al., Reference Harel, Elad, Rav-David, Borenstein, Shulchani, Lew and Graber2012). These previous results suggest that wood-derived biochar may have positive benefits for strawberry growth and yield when nutrients are limited or when fungal diseases are present. However, in our study, fungal pathogens were absent (perhaps because of lack of regular irrigation) and macronutrients were adequate, which may explain the relative lack of biochar impact on strawberry shown by our study.
In contrast, biochar appeared to somewhat influence weed suppression when combined with hemp mulch, but only at Absaraka. During 2015 and in association with hemp mulch, both weed biomass (Fig. 1A) and density (Fig. 2A) increased slightly with biochar. At Dickinson, biochar impact on weed density was not significant (P = 0.22). This result suggests that biochar may have enhanced weed emergence from beneath hemp mulch at Absaraka. Both increased soil nitrogen and biochar application have been shown to increase weed seed germination for some species (Sweeny et al., Reference Sweeney, Renner, Laboski and Davis2008; Soni et al., Reference Soni, Leon, Erickson, Ferrell, Silveira and Giurcanu2014, respectively). Hemp and paper C:N ratios were high, 54:1 and 121:1, respectively. The C:N ratio of a material affects nutrient cycling by either immobilizing N (high C:N ratio) or providing N (low C:N ratio) to the system (USDA-NRCS, 2011). The high C:N ratio of the paper mulch was likely not a factor, because the mass applied was small. Conversely, greater mass of hemp was applied and the mulch was composed of small loose particles which mixed together with soil at depths relevant to emergence for small-seeded annual weed species (i.e., 1–3 cm). Therefore, if hemp mulch immobilized soil N, weed germination may have been reduced compared to paper or zero mulch. Hemp mulch effect on soil NO3-nitrogen was not significant (Table 1), but mean values suggest a possible trend of decreased N in association with the hemp mulch (Table 2). Moreover, nutrients were determined from 15 cm deep soil cores, thus possibly diluting the impact of the hemp mulch at shallow depths. Consequently, biochar may have provided an offset to these potential negative effects of hemp mulch on weed emergence at Absaraka, leading to increased weed biomass and density in hemp-mulched plots with biochar compared to hemp-mulched plots without biochar. However, the magnitude of this effect was small, and both paper and hemp mulch suppressed weeds relatively well during 2015 compared to zero mulch, with or without biochar (Figs 1A and 2A). We speculate that the small biochar effect was not shown at Dickinson because of a difference in weed community composition—at Dickinson, a greater proportion of weeds were grasses compared to Absaraka. In support of this explanation, Monaco et al. (Reference Monaco, MacKown, Johnson, Jones, Norton, Norton and Redinbaugh2003) showed that germination was not enhanced for several exotic grass species exposed to either ammonium or nitrate added to a soil medium.
Biochar application was associated with a slight increase in soil pH across sites, increasing from 6.9 in non-amended soil to 7.0 in amended soil (Table 2). A meta-analysis of biochar impacts on plant productivity and soil nutrients showed that soil pH tended to increase with biochar applications (Biederman and Harpole, Reference Biederman and Harpole2013). However, the relatively small pH increase shown by our study would probably not have substantial biological impacts. For example, phosphorous availability is influenced by soil pH, but pH levels ranging from 6 to 7 optimize plant available phosphorous (Penn and Camberato, Reference Penn and Camberato2019). Studies have shown some variability in weed seed germination in relation to broad pH ranges (Pierce et al., Reference Pierce, Warren, Mikkelsen and Linker1999; Burke et al., Reference Burke, Thomas, Spears and Wilcut2003; Singh and Singh, Reference Singh and Singh2009), but the narrow range of pH values shown here would likely not impact germination.
In biochar-treated plots, we observed reduced VWC associated with zero mulch compared to hemp hurd or paper mulch (Fig. 5), but no effect when biochar was absent. Although statistically significant, the magnitude of the effect is small. Also, previous results do not support the observed pattern, as most studies report increased soil moisture retention associated with biochar application, or no effect (Razzaghi et al., Reference Razzaghi, Obour and Arthur2020). However, this effect is most striking for coarse-textured soils, and biochar applications to fine-textured soils (more similar to soils at our study sites) were associated with slight (~5%) decreases in wilting point soil moisture content.
Mulch type impacts
During 2015, both mulches suppressed weeds adequately, compared to zero mulch, with respect to both weed dry biomass and density (Figs 1 and 2). However, at Absaraka (discounting the small impact of biochar on hemp mulch performance discussed above), the paper mulch did not suppress weeds as well as hemp mulch, both in terms of weed dry biomass (Fig. 1B) and weed density (Fig. 2A). Unlike paper mulch, hemp mulch is composed of loose particles containing open paths through which weeds can emerge. According to Teasdale and Mohler (Reference Teasdale and Mohler2000), the weed suppressive effects of mulches are governed by the proportion of soil surface covered. Uneven distribution of individual mulch elements, as seen with hemp mulch, leaves open sites for weed emergence, even at high application rates. Conversely, paper mulch continuously covers the soil, which should suppress weed emergence evenly. In our study, most weeds emerging in the paper mulch were in the open center holes, and a few weeds emerged though a few gaps caused by imperfect overlapping of paper mulch circles (observation), but this occurred at both sites. One reason for site differences with respect to paper mulch performance between sites could be differences in weed community composition. As discussed above, broadleaf weed species were more dominant at Absaraka compared to Dickinson. Perhaps broadleaf weeds were better able to emerge through the paper mulch or were better at finding emergence paths through the overlaps in the paper circles. But perhaps overall weed density was more of a factor than community composition. Weed density was greater at Absaraka compared to Dickinson, as shown in the zero mulch treatment (Fig. 2). Greater weed pressure at Absaraka may have increased the probability of weeds finding the open centers or small gaps in overlaps in the paper mulch treatment at Absaraka compared to Dickinson.
Another possible explanation for disparate paper mulch performance between sites could be increased paper mulch degradation at Absaraka compared to Dickinson because of environmental conditions. From 1 June to 31 October, Absaraka received more total precipitation than Dickinson (287 vs 236 mm), but considering the irrigation applied at Dickinson, total moisture received was probably roughly equivalent between sites. However, the number of large (>25 mm) rainfall events was greater at Absaraka than Dickinson (5 vs 3 events, respectively; Fig. 6). Additionally, average relative humidity (estimated from weather stations reporting dewpoint) from 1 June 2015 to 30 September 2015 was 72% at Absaraka but only 58% at Dickinson. We speculate that the combined effects of greater humidity (which would both decrease paper strength and increase degradation rate), combined with more large rainfall events (which would physically stress paper), may have contributed to faster degradation of the paper mulch at Absaraka compared to Dickinson, which subsequently led to increased weed emergence through the paper mulch. Finally, paper circles used in our study may have behaved differently than a continuous sheet, which probably would be more subject to tearing by wind than the paper circles, because these were each well-secured with wire staples.
Precipitation (mm) events recorded near the field sites located at Absaraka (blue circles) and Dickinson (olive brown squares) from 1 June to 7 November 2015. Events above the dashed line (>25 mm) are considered ‘large’ precipitation events. Zero precipitation events are not shown.

We observed that by spring of 2016, the paper mulch was no longer present at Absaraka and had completely degraded. The impact of paper mulch degradation continued into 2016, when hemp mulch suppressed weeds well at both sites, but paper mulch only provided suppression at Dickinson (Fig. 3). In contrast, individual particles of hemp hurd cohered together strongly to provide good weed suppression at both sites while still allowing water infiltration (observation). Hemp mulch was also subjected to high winds at Dickinson (45 days during 2015 summer with maximum wind speeds exceeding 15 m s−1, data not shown), but little hemp mulch was displaced from wind (observation). We speculate that the coherence of hemp mulch was increased by applying the material wet and firmly compacting it upon application, allowing the fibers to knit together and cohere. Thus, the hemp mulch resisted degradation over time, and provided weed suppression into the production year. Our results suggest that, especially over longer periods of time, hemp mulch may be somewhat more resilient to extreme weather than paper sheet mulch, which is prone to degradation when moist, as well as tearing by wind (Weber, Reference Weber2003; Cirujeda et al., Reference Cirujeda, Anzalone, Aibar, Moreno and Zaragoza2012).
Berry yield (kg m−1) was not impacted by mulch type, but per berry mass was greater when plants were grown under hemp or paper mulch compared to zero mulch (Table 2). Mitigation of water stress is an important mulch function that can affect strawberry growth and yield. A previous study showed that under water stress, both black polyethylene and wheat straw mulch were associated with increased berry size and mass compared to bare soil (Kirnak et al., Reference Kirnak, Cengiz, Higgs and Sihan2001). Our results revealed few differences in soil VWC associated with mulch type (Table 2, Fig. 5). At Absaraka, zero mulch with biochar had slightly lower VWC than paper and hemp hurd mulch with no biochar (Fig. 5), but this does not explain mulch effects on per berry mass across sites. Mulch type also impacted some soil nutrients (Table 2), but the patterns do not explain mulch impacts on per berrymass. Because weeds use water, plots with more weeds during 2016 may have been more water stressed. At Dickinson, zero mulch was associated with greater weed biomass compared to hemp hurd and paper mulch, but this pattern was not the same at Absaraka, where paper mulch suppressed weeds poorly during 2016 (Fig. 3). Therefore, weed biomass differences associated with mulches do not explain mulch impact on per berrymass. Runner number was greater under paper and hemp hurd mulch compared to zero mulch across both sites (Table 2), so the number of daughter plants differed across mulch treatments. Rindom and Hansen (Reference Rindom and Hansen1995) concluded that increased floral meristems, which are correlated with increased strawberry vegetative growth, result in smaller fruit. With fewer runners and thus fewer daughter plants, lack of intra-specific competition among strawberry plants grown with zero mulch may have led to increased vegetative growth and floral meristems, thus potentially reducing per berry mass (LóPez-Medina et al., Reference LóPez-Medina, Vazquez, Medina, Dominguez, Lopez-Aranda, Bartual and Flores2001).
Runner number has been shown to vary with air temperature, with the optimum for many varieties around 25°C (Smeets, Reference Smeets1956). Our study showed lower maximum soil temperatures associated with hemp hurd and paper mulch compared to zero mulch (Table 2). Kumar and Dey (Reference Kumar and Dey2011) showed that hay mulch was associated with lower soil temperature compared to no mulch in a strawberry production system. Gupta and Acharya (Reference Gupta and Acharya1993) observed that pine needle and grass mulches reduced soil maximum temperatures compared to black and clear plastic mulch. Neither of these studies quantified the impact of soil temperature on runner number, however. A growth chamber study involving June bearing cultivars showed that runner production was inhibited at a day/night temperature regime of 40/35°C compared to a 30/25°C regime (Kadir et al., Reference Kadir, Sidhu and Al-Khatib2006). How these temperature regimes affected soil temperature is unknown, and little research has focused on soil temperature impacts on strawberry growth. However, one study that compared strawberry growth at root zone temperatures of 10, 20 and 30°C showed that strawberry vegetative growth and reproductive measures such as runner number, fruit number and fruit size were inhibited by higher root zone temperatures (Sakamoto et al., Reference Sakamoto, Uenishi, Miyamoto and Suzuk2016). These findings lend support to the hypothesis that greater maximum soil temperatures associated with zero mulch (26.1°C in 2015) may have resulted in fewer numbers of runners compared to lower maximum soil temperatures associated with hemp and paper mulch (22.5 and 23.9°C, respectively).
Hemp and paper mulch were associated with slightly greater berry number compared to zero mulch (Fig. 4). One likely explanation is the increased number of runners associated with these mulches, as discussed above. Mulch effects on berry number at Absaraka were marked by high variability (Fig. 4), which was likely caused by insect damage. Due to tarnished bug infestation, some berries exhibited apical seediness, with characteristic large brown achenes, which led to misshaped smaller berries (Allen and Gaede, Reference Allen and Gaede1963). These impacts also explain greater per berry mass at Dickinson compared to Absaraka (Table 2).
Conclusions
Application of biochar did not benefit strawberry growth or yield, but results suggested a possible interactive impact of biochar with hemp mulch on weed emergence at Absaraka. In contrast, mulch type impacted several responses, especially weed biomass and density as well as strawberry runner number and per berry mass. During 2015, weeds were removed before crop-weed competition occurred, so mulch treatment effects on strawberry growth and development were due to other mulch impacts besides weed suppression (e.g., soil moisture retention, soil nutrient or temperature modification, or effects on other pests), or from biochar application. If removed weeds had been allowed to impact strawberry growth, then yield measures would likely have differed more among mulch types, because weeds are known to be detrimental to strawberry growth and yield (Pritts and Kelly, Reference Pritts and Kelly2001). Even so, hemp and paper mulch both were associated with greater runner production during the establishment year compared to zero mulch, which was correlated with greater per berry mass in the production year. Because only hemp mulch suppressed weeds well during both the establishment year and the production year at both sites, we conclude that this novel material shows promise for improving establishment year weed management in MRP systems. This biodegradable and renewable material could be an ecologically sound replacement for environmentally damaging plastic mulch, especially for certified organic production. Using hemp for mulch also increases the sustainability of hemp production, because the hurd portion of the stalk is often discarded.
Hurd availability and cost are obstacles to adoption. The US 2018 Farm Bill established a regulatory framework for hemp production, which by 2020 grew to >200,000 ha (Drotleff, Reference Drotlef2020), thus increasing hemp raw material availability. Hemp hurd sells for $1.25–$1.32 kg−1. At this price, using the rate we applied, hemp mulch material cost is 25 times paper mulch. However, this price refers to a commercial packaged product, for which the majority of cost is associated with transport and packaging. Farmers often reduce mulch costs by using locally available materials or materials produced on-farm (Merwin et al., Reference Merwin, Rosenberger, Engle, Rist and Fargione1995). In North Dakota, the value of hemp stalks is about $0.15 kg−1 (Jon Lowry, personal communication). At this price, hemp mulch could be a viable option for farmers living near areas of hemp production. Labor is also an issue, as applying the hemp mulch by hand was labor intensive, but automated application systems could be developed. Hemp mulch cost could be partially offset by weed removal labor costs occurring after the establishment year, as hemp provided good weed suppression into the second season. Hemp mulch might be an attractive option for small-scale growers, particularly organic producers seeking to reduce plastic mulch use. Future research should focus on evaluating hemp mulch rates for weed suppression, hemp mulch performance with drip irrigation systems and hemp mulch impacts on soil nutrient cycling and microbiology.
Conflict of interest
The authors declare no competing interests. The authors acknowledge USDA Hatch Project #ND01583 as a funding source.
Data availability statement
The data that support the findings of this study are available from the corresponding author, GG, upon reasonable request.