

BACKGROUND AND RESEARCH OBJECTIVES
During antiquity, ceramic oil lamps were a common portable light source, due to their small size and easy access to fuel, mainly olive oil (Bailey Reference Bailey1972, 10–11; Kimpe, Jacobs and Waelkens Reference Kimpe, Jacobs and Waelkens2001; Copley et al. Reference Copley, Bland, Rose and Horton2005). They were used to produce artificial light in domestic and public spaces. In sacred contexts, such as temples and sanctuaries, they were dedicated as votive offerings, while in tombs they were used as part of the burial furniture (e.g. Bailey Reference Bailey1972, 11–12; Parks Reference Parks1999, 338–44; Dimakis Reference Dimakis, Polychroniadis and Evely2015; Şoforoğlu and Summerer Reference Şoforoğlu, Summerer, Summerer and Kaba2016; Kelsall Reference Kelsall2018, 101–7).
Many lamps dating from the Hellenistic and Roman periods have been discovered across the Mediterranean and beyond, and it has been suggested that these were mass-produced objects, manufactured in various centres and distributed on a large scale (Bailey Reference Bailey1975, 10–12). Due to the abundance of lamps within archaeological contexts, and to their extensive distribution during ancient times, they can provide valuable insights into the communities that produced and used them. They can also shed light on regional and long-distance connections. However, research into the role of lamps in the economy of the Hellenistic and Early Roman world is still limited. Traditionally, studies have mainly focused on their typology, chronology and iconography, and a vast number of publications present lamps from private collections and museums, often lacking archaeological context. Researchers who combined traditional studies with macroscopic fabric analysis (Bailey Reference Bailey1975; Reference Bailey1980; Reference Bailey1988; Sussman Reference Sussman2009; Reference Sussman2012) suggested that lamps with very similar shapes and decorations were made in different workshops across the Mediterranean during the Hellenistic and Roman periods. This is important, since it implies that the identification of lamp origins cannot be based solely on typological and iconographic examination, but also requires the combined application of fabric analysis.
In response to this need, lamps have been subjected to mineralogical and elemental analysis. In most previous studies, lamps usually comprised part of the analysed samples, alongside other pottery categories (‘Amr Reference ‘Amr1987, 29–37; Daszkiewicz and Raabe Reference Daszkiewicz and Raabe1995; Oziol Reference Oziol1995, 240; Rautman Reference Rautman and Herbert1997; Schneider Reference Schneider2000a; Élaigne Reference Élaigne2002; Picon and Blondé Reference Picon and Blondé2002, 15; Rathossi, Tsolis-Katagas and Katagas Reference Rathossi, Tsolis-Katagas and Katagas2004; Dobbins Reference Dobbins, Berlin and Herbert2012, 109–10; Fenn Reference Fenn2016). There are, however, a few cases in which lamps were the focus of scientific analysis. A notable example is a programme of analysis carried out over many years by Schneider and his collaborators (Schneider and Wirz Reference Schneider, Wirz and Mery1992; Schneider Reference Schneider and Olcese1993; Reference Schneider, Brogiolo and Pietro Olcese2000b; Reference Schneider and Huld-Zetsche2014; Ceci and Schneider Reference Ceci and Schneider1994; Schneider and Daszkiewicz Reference Schneider and Daszkiewicz2019), focusing on lamps from the Western Roman provinces.Footnote 1 There is no such comprehensive project for the Eastern Mediterranean, but there are some noteworthy examples of scientific analysis of lamps from Western Anatolia (mainly Ephesus) (Hughes, Leese and Smith Reference Hughes, Leese and Smith1988), Sepphoris (Lapp Reference Lapp2016, 120–80) and Rhodes (Katsioti Reference Katsioti2017).Footnote 2 Nevertheless, there was no such study dedicated solely to Cypriot lamps. To fill this gap, and to create a new, comprehensive methodological approach for lamp studies, the assemblage unearthed at the Agora in Nea Paphos has been investigated. The interdisciplinary study of the Hellenistic and Roman lamps recovered during the systematic excavations in Nea Paphos (between 2011 and 2016) provides important new information about the production and circulation of this type of ceramic objects. Numerous lamps unearthed during the excavations have been studied through the combination of the traditional typological approach with macroscopic fabric examination and scientific analysis of selected samples.Footnote 3 This enabled the definition of distinct Production Groups (PG), with different typological (shape), stylistic (decoration), technological, and compositional attributes. In order to facilitate comparability with, and reassessment by, analogous contemporary or future interdisciplinary studies, this paper emphasises the detailed presentation of the whole analytical process and not only of the final results.
Ultimately, the purpose of this study has been to gain further understanding of the production and distribution patterns of lamps, and their transformation over time. This sets the foundations for a more informed discussion of the role of lamps in the local market – within the wider context of fine ware pottery manufacture and supply – tracing changes in consumer preferences, as well as the nature of contacts and trade relations of Nea Paphos during the Hellenistic and Early Roman periods.
FOLLOWING THE DEVELOPMENT OF CERAMIC OIL LAMPS
The oldest known ceramic vessels, possibly used as oil lamps, come from Greece and the Near East and date from the Neolithic period (e.g. Weinberg Reference Weinberg1962, 204; Kelsall Reference Kelsall2018, 16). They were hand-made, plain, shallow vessels. During the Bronze Age, they evolved in the Near East into hand-made and wheel-made bowls with pinched rims providing spouts for wicks (Kelsall Reference Kelsall2018, 20–2). On Cyprus, wheel-made open bowls with pinched rims were in continuous use from the Middle Bronze Age (2000–1600 bc) until the Early Hellenistic period (late fourth–mid-third century bc) (Oziol Reference Oziol1995).
An important step in lamp development took place in Greek workshops during the seventh century bc. The wheel-made lamps produced there had bridged nozzles (Howland Reference Howland1958, 5), which allowed control of the wick length and thus the size of the flame. From the turn of the fifth to the fourth century bc, the bodies of Greek lamps became more enclosed (Howland Reference Howland1958, 5), and as a result, the filling holes appeared at the top. Lamps produced in the new shape, usually covered with slip or gloss, spread across the Mediterranean. Various local production centres adopted this shape, because it was more efficient and provided protection of fuel from spillage, evaporation and rodents (Bailey Reference Bailey1972, 9; Kelsall Reference Kelsall2018, 31).
The next change in lamp manufacture was the introduction of a moulding technique. This technique was probably first employed in Egyptian workshops in the third quarter of the third century bc (Rotroff Reference Rotroff, Kazakou and Nestoridou2000, 499; Reference Rotroff2006, 368). The new technique involved the use of a two-piece mould (the upper part was usually decorated) and allowed rapid and easy multiplication of a single shape, thus facilitating mass production. The use of moulds became popular across the Mediterranean from the Late Hellenistic period (second–first century bc). However, in some production centres such as Knidos, wheel-made lamps continued to be manufactured until the first century bc (Howland Reference Howland1958, 5; Bailey Reference Bailey1975, 127–8). The Hellenistic mould-made lamps were characterised by a large filling hole and usually had decorated shoulders. By the Early Roman period (late first century bc–second century ad), the moulded lamps had become thin-walled and were characterised by the presence of a sunken discus with a very small filling hole. The discus frequently bore floral, geometric or figural decoration. During the Late Roman period, in the fourth and fifth centuries ad, mould-made lamps had thicker walls and sometimes bore religious motifs, such as a cross or menorah. Generally, lamps lost their roundness and more ovoid shapes were usually produced at that time.
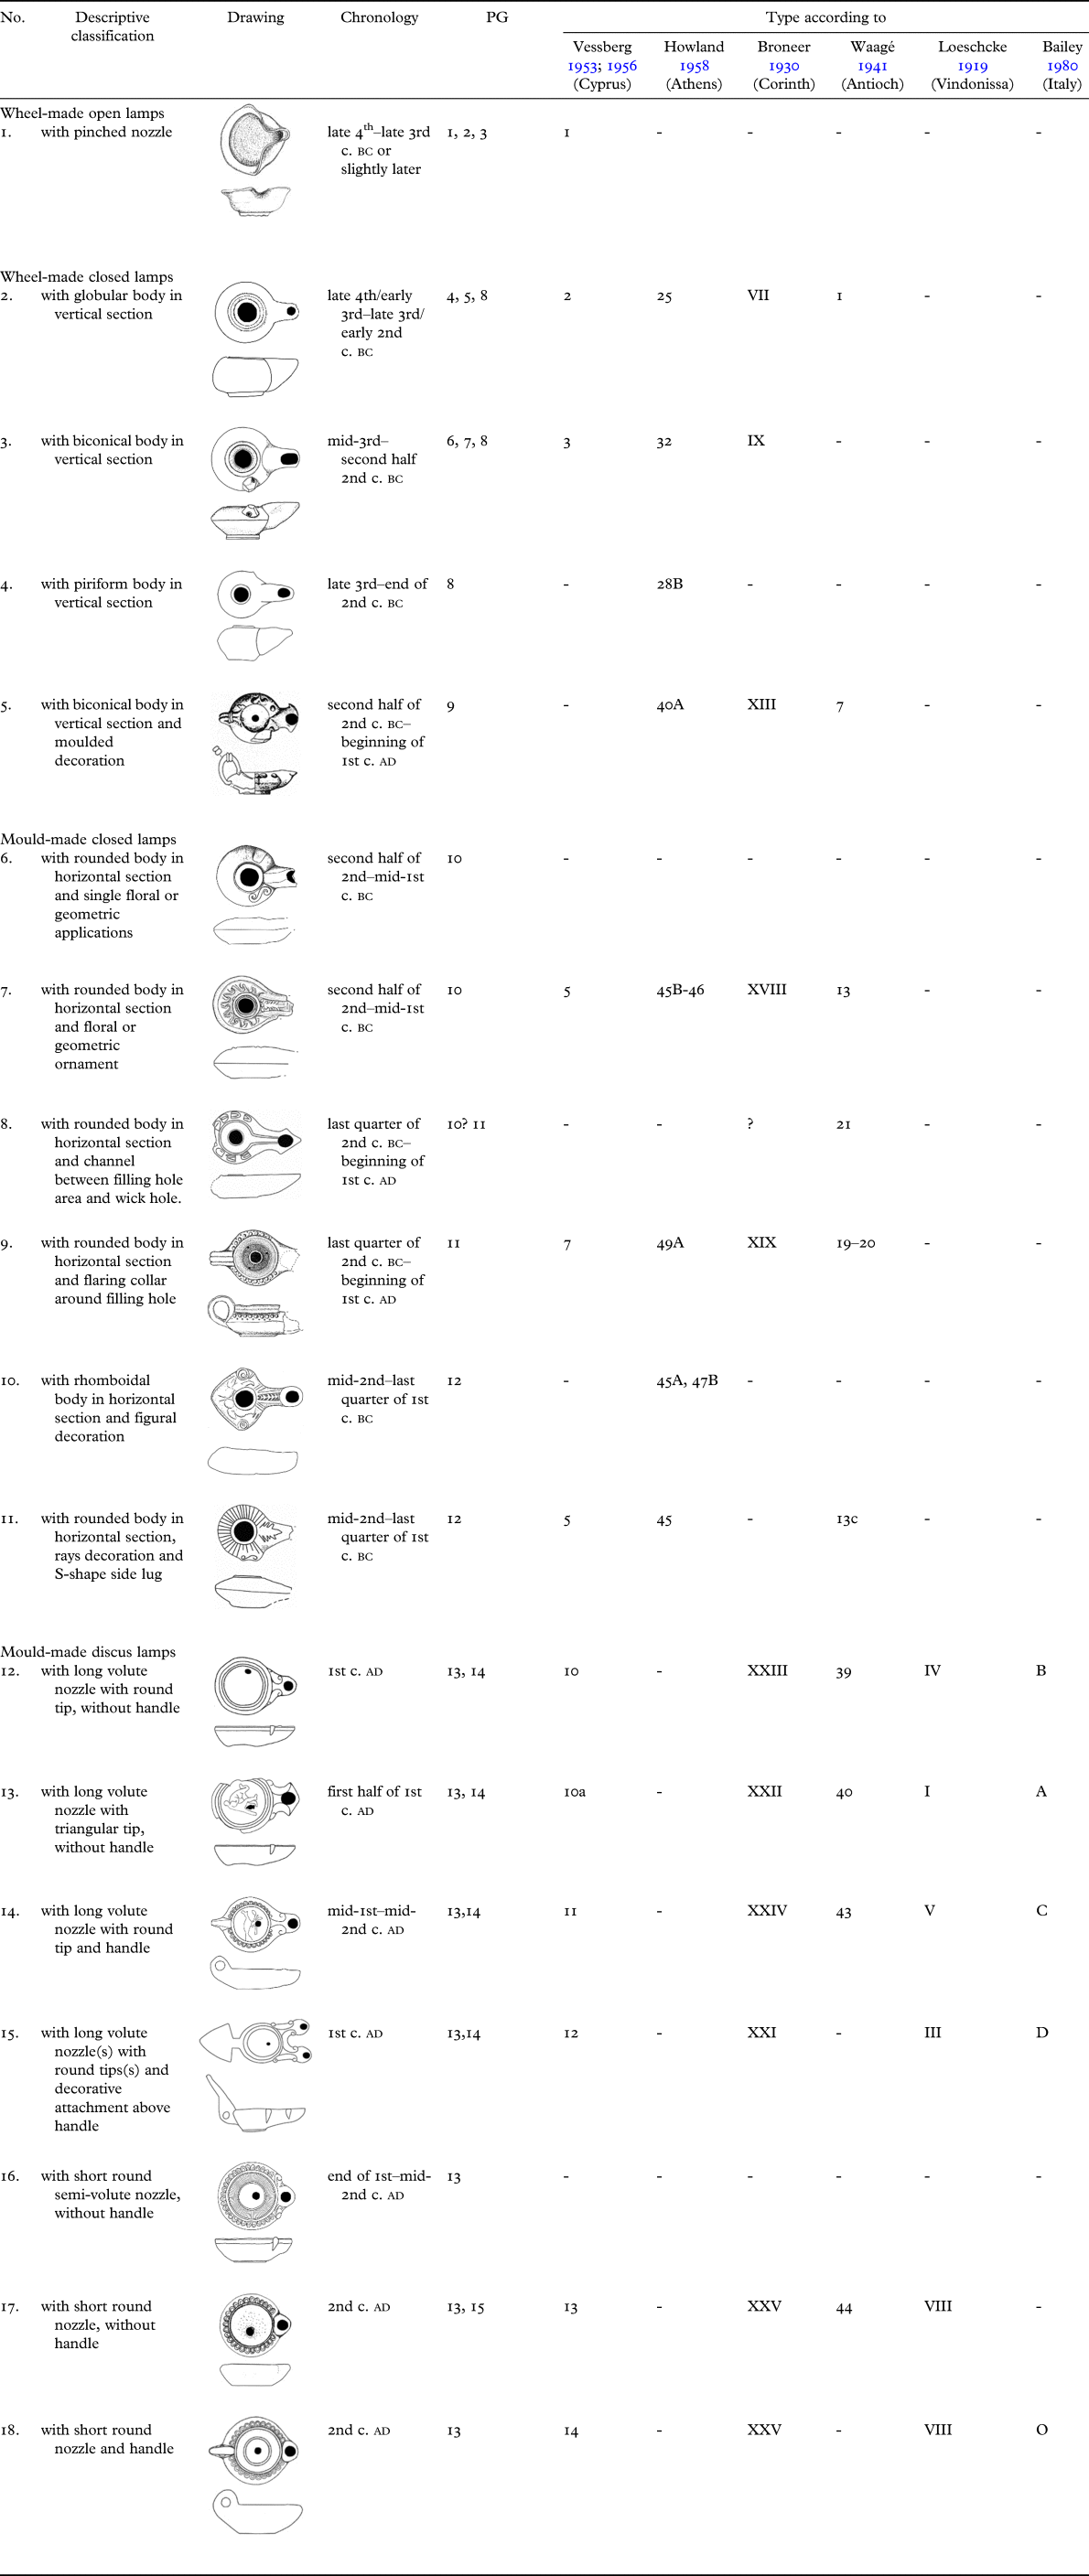
In addition to these general trends in the evolution of lamp shapes, decoration and manufacture across the Mediterranean, the regional perspective has to be taken into account due to the potential chronological variation concerning the local adoption of particular new trends. The chronological frame of the Agora site in Nea Paphos, between the end of fourth/early third century bc and the mid-second century ad, covers a period of significant transformations in oil lamp forms and manufacture aiming at maximising use efficiency (Bailey Reference Bailey1972, 9, 18; Kelsall Reference Kelsall2018, 35–6). Among the material from Nea Paphos, four categories of lamps can be distinguished, characterised by distinct forming methods, shapes, and chronology (Table A1). The wheel-made open lamps with pinched rims were still being produced when the city was founded in the late fourth/early third century bc. They were used concurrently with the wheel-made closed lamps of Greek tradition during the Early Hellenistic period. The wheel-made closed lamps were common until the mid-second century bc, when the use of moulds became dominant in lamp manufacture. At Nea Paphos, the mould-made closed lamps date between the mid-second and the late first centuries bc. In the Early Imperial period (the late first century bc), the mould-made closed discus lamps appeared in Nea Paphos, and they were widely used at least until the mid-second century ad. Although the Nea Paphos Agora assemblage also includes Late Roman lamps, these come from surface layers only, and they are not considered in this study.
NEA PAPHOS AND THE AGORA
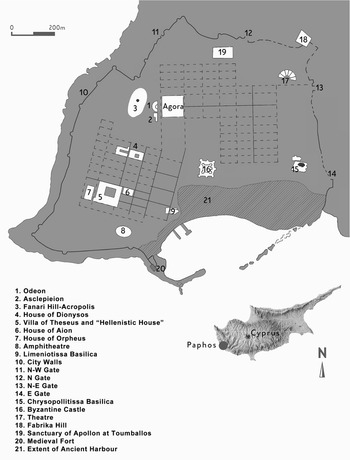
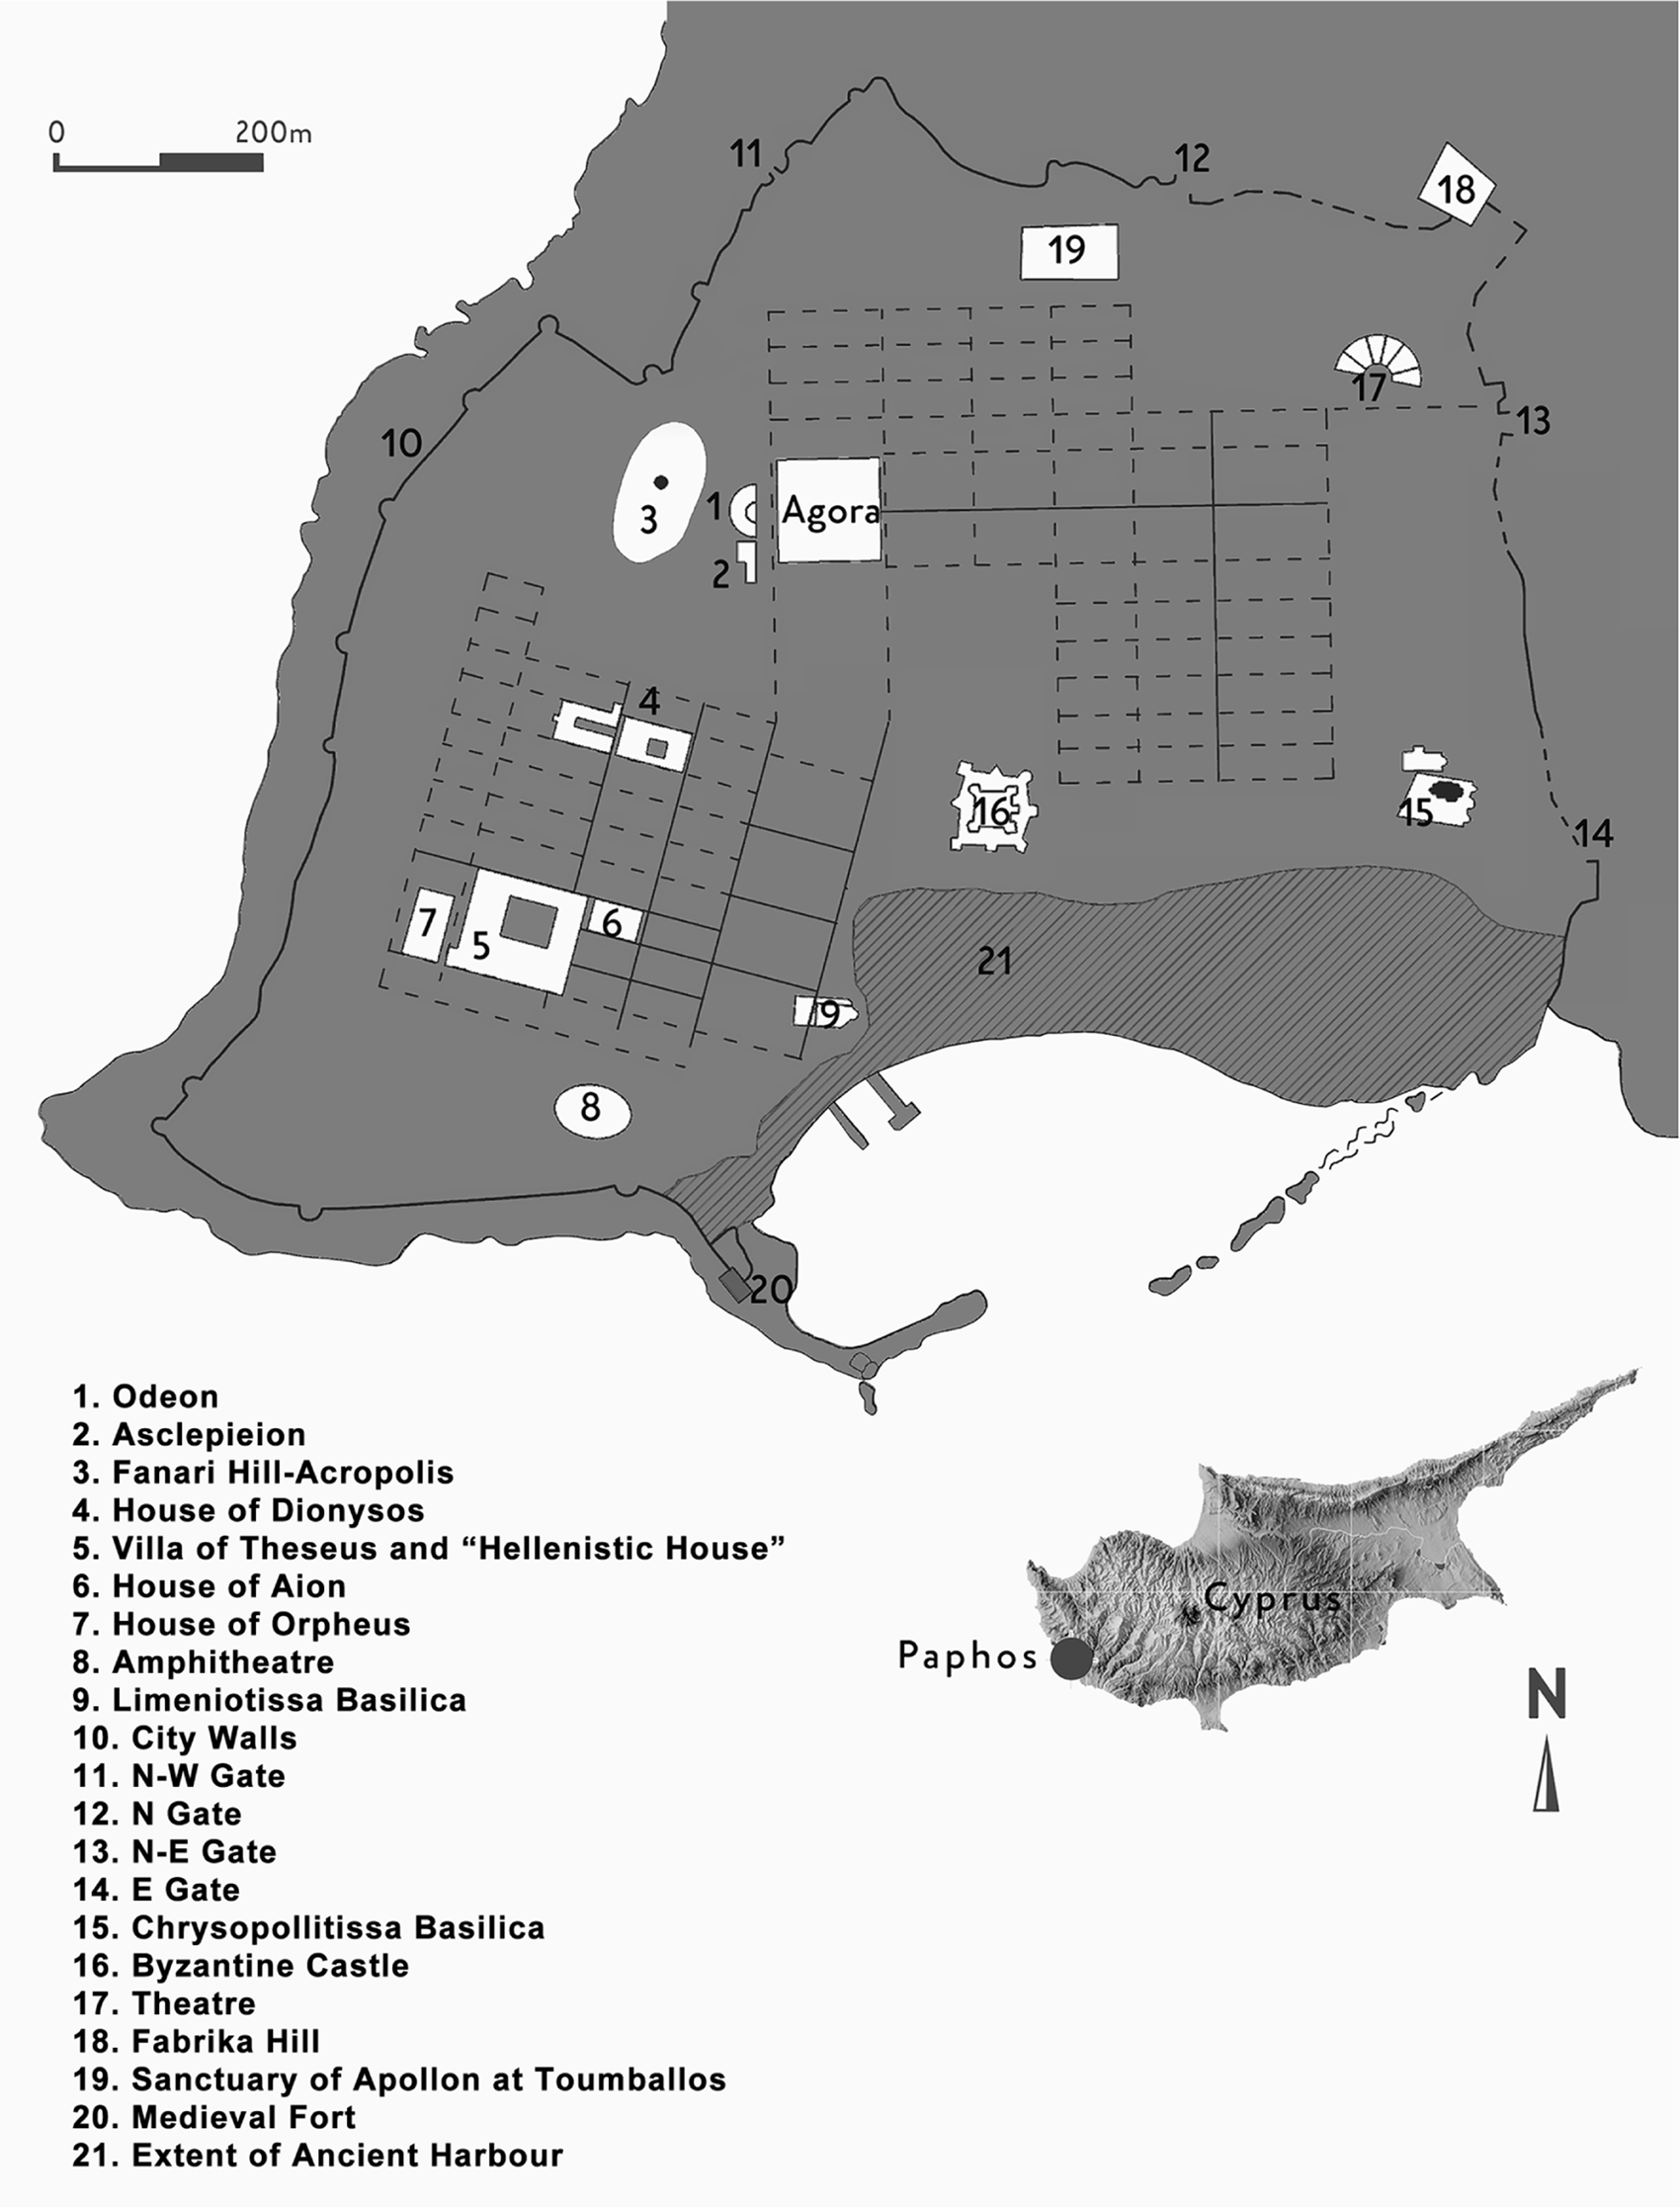
Nea Paphos, on the south-western coast of Cyprus (Fig. 1), was founded at the beginning of the Hellenistic period, either in the late fourth century bc (Nicolaou Reference Nicolaou, M.L. and Bernhard1966; Młynarczyk Reference Młynarczyk1990a, 67–76; Connelly Reference Connelly and Hadjisavvas2010, 173) or the early third century bc (Bekker-Nielsen Reference Bekker-Nielsen, Isager and Nielsen2000; Balandier Reference Balandier and Demetriou2011, 376), and prospered until the Late Roman period (fourth century ad). Due to its excellent strategic position, Nea Paphos served as a city-port for the Ptolemies (third–first century bc) and the Romans (late first century bc–fourth century ad). The city's harbour is situated in a natural bay and was easily accessible from Egypt. Due to the prevailing winds and sea currents, which strongly affected ancient navigation, Nea Paphos was a perfect stop on the way to and from Phoenicia and the Aegean. Moreover, the city's easy access to nearby natural resources, such as copper and timber, made it an ideal place for the exchange of goods. As a result, Nea Paphos became the main harbour of the island, its commercial and administrative centre, and the residence of the island's elite (Lund Reference Lund2015, 20, 24). This significant position of Nea Paphos during the Hellenistic and Roman periods has been confirmed by written sources (Młynarczyk Reference Młynarczyk1990a, 34–5) and many archaeological excavations. The latter were carried out at various locations around the ancient city (Fig. 1), including the Agora (Papuci-Władyka and Machowski Reference Papuci-Władyka and Machowski2016; Papuci-Władyka, Machowski and Miszk Reference Papuci-Władyka, Machowski and Miszk2018; Papuci-Władyka Reference Papuci-Władyka2020), the Theatre (Barker Reference Barker2016), the Sanctuary of Apollo at Toumballos (Giudice et al. Reference Giudice, Giudice, Giudice and Chiarello2017), and the residential areas of Maloutena (Meyza Reference Meyza, Borowska, Kordos and Maliszewski2014; Michaelides, Papantoniou and Dikomitou-Eliadou Reference Michaelides, Papantoniou, Dikomitou-Eliadou and Gagatsis2014) and Fabrika Hill (Balandier Reference Balandier2016b; Reference Balandier2017).
Location of Paphos on a map of Cyprus and the Nea Paphos ancient city plan. Based on J. Młynarczyk's (Reference Młynarczyk1990a) research with modifications by the Paphos Agora Project.
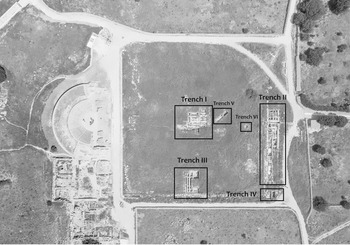
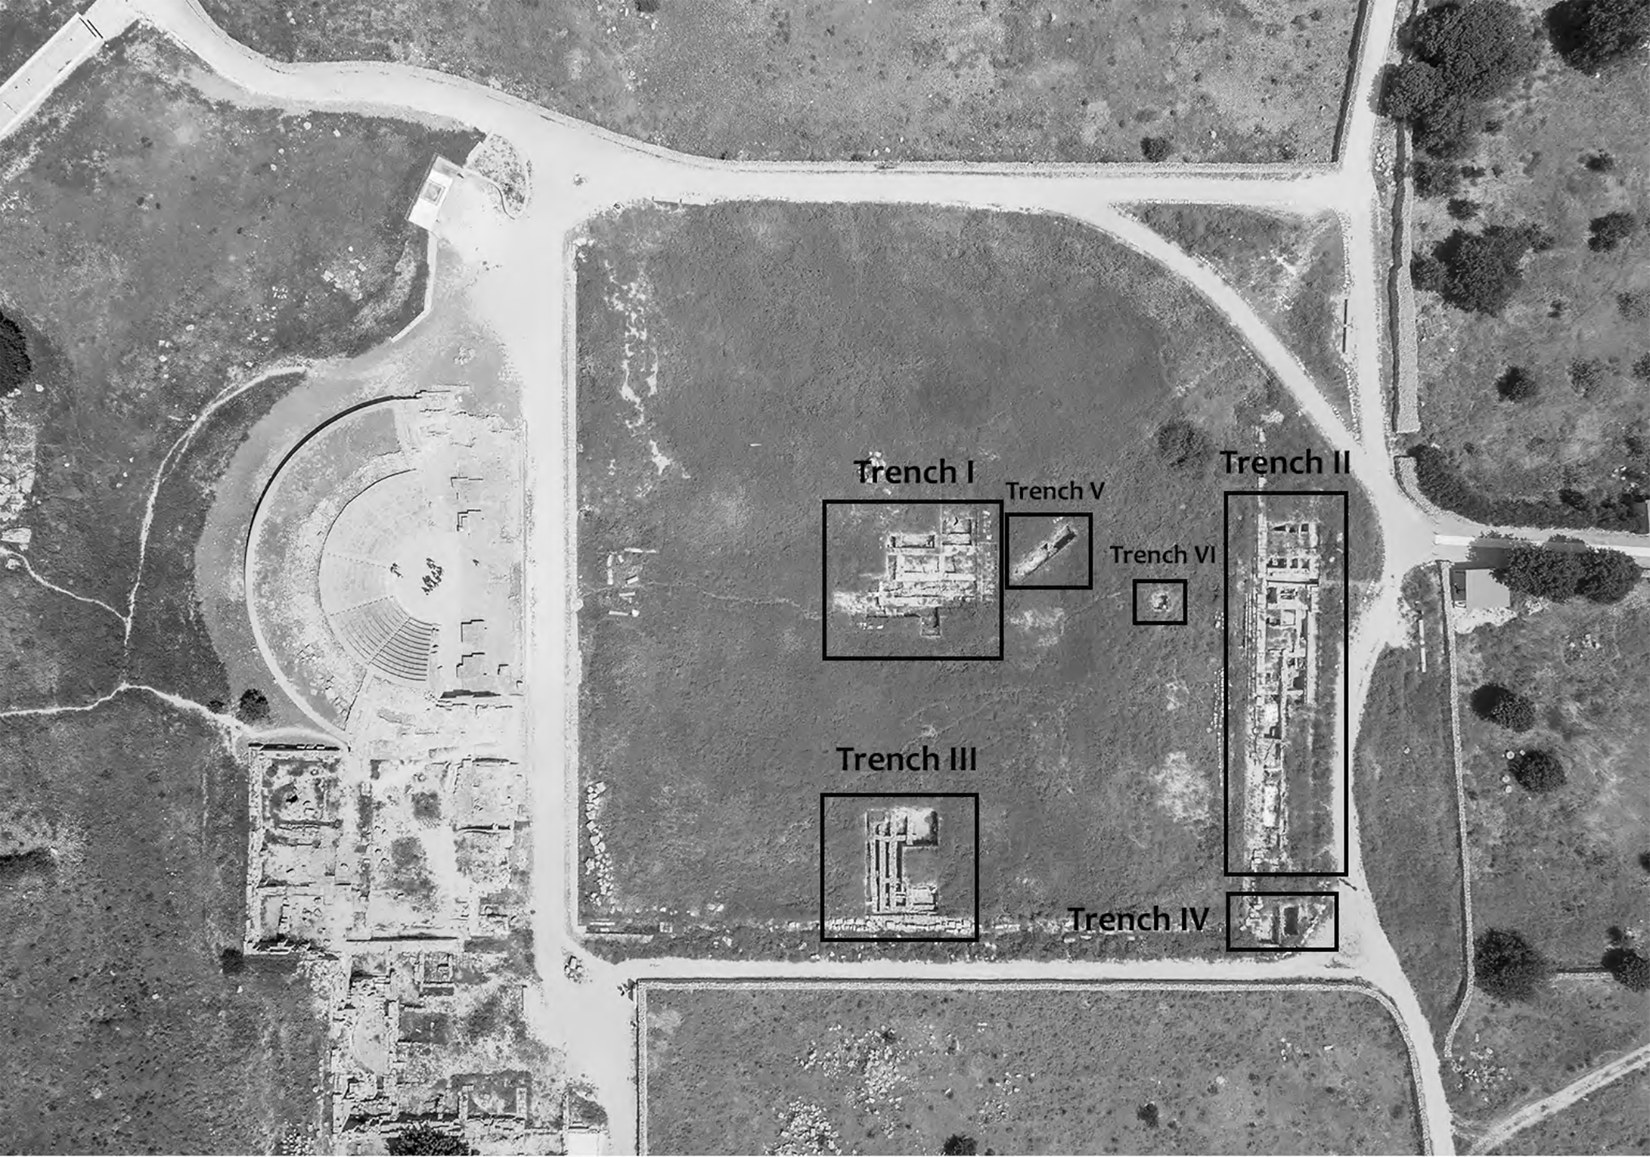
The Agora, situated in the central part of the city, was excavated for the first time in the 1970s by K. Nicolaou (Reference Nicolaou1975; Reference Nicolaou1976; Reference Nicolaou1977; Reference Nicolaou1978; Reference Nicolaou1980). In 2011, new excavations were launched by the Paphos Agora Project to revise the early history of the Agora and its spatial development.Footnote 4 The area excavated between 2011 and 2016 includes six trenches located in different parts of the Agora (Fig. 2). Trenches I, V and VI, in the centre of the site, revealed the remains of a large building (Building A), interpreted as a temple (Papuci-Władyka, Machowski and Miszk Reference Papuci-Władyka, Machowski and Miszk2018, 536; Miszk Reference Miszk2020, 131–3) Trenches II and IV uncovered the eastern portico with a row of small rooms, interpreted as tabernae at the entrance of the Agora (Papuci-Władyka, Machowski and Miszk Reference Papuci-Władyka, Machowski and Miszk2018, 537; Miszk Reference Miszk2020, 140–3). Furthermore, the foundations of a presumed storehouse were unearthed in Trench III (Miszk Reference Miszk2020, 136). The new project confirmed that the area of the Agora was in use since the beginning of the city's existence. It seems that political changes, as well as earthquakes, influenced spatial transformations and led to several reconstructions observed in architectural remains (Papuci-Władyka, Machowski and Miszk Reference Papuci-Władyka, Machowski and Miszk2018; Miszk Reference Miszk2020, 127–56). The last architectural phase dates to the mid-second century ad, and it seems that there was no building activity after this time.
Aerial photo showing the area excavated by the Paphos Agora Project (photo A. Oleksiak).
MATERIAL AND METHODOLOGY
The analysed assemblage came from the above six trenches at the Agora of Nea Paphos and consists of 729 lamps, recovered during excavation and subsequent soil sieving. They date to the Hellenistic and Early Roman periods, but a significant part (around 25 per cent) was found as residual material in later Roman and surface layers. The lamps are usually quite fragmentary, but there are also well-preserved specimens from undisturbed deposits, such as a well (structure 173) in Trench II and wells/cisterns (structures 12 and 50) in Trench I.
The macroscopic examination of the assemblage resulted in the definition of macroscopic groups (MGs) based on the following variables: category; type; decoration; chronology; and fabric. Once the lamps were classified into one of the four major categories reflecting the forming technique and general shape, they were subjected to typological examination. The employed typology was based on existing classifications (Loeschcke Reference Loeschcke1919; Broneer Reference Broneer1930; Waagé Reference Waagé and Stillwell1941; Vessberg Reference Vessberg1953; Reference Vessberg, Vessberg and Westholm1956; Howland Reference Howland1958; Bruneau Reference Bruneau1965; Bailey Reference Bailey1980), taking into consideration morphological features of the specific assemblage, including shape of body, nozzle and presence of a handle (Table A1). Subsequently, the decorated objects were characterised in terms of iconography to define the repertoire of motifs specific for particular MGs. The ornaments and depictions were classified into three major motifs – geometric, floral and figural – and described in detail by defining their shapes, species and mythical scenes. The chronology of lamps was established in most cases on stylistic grounds, through published analogies of vessel shapes and, when possible, through the context date.
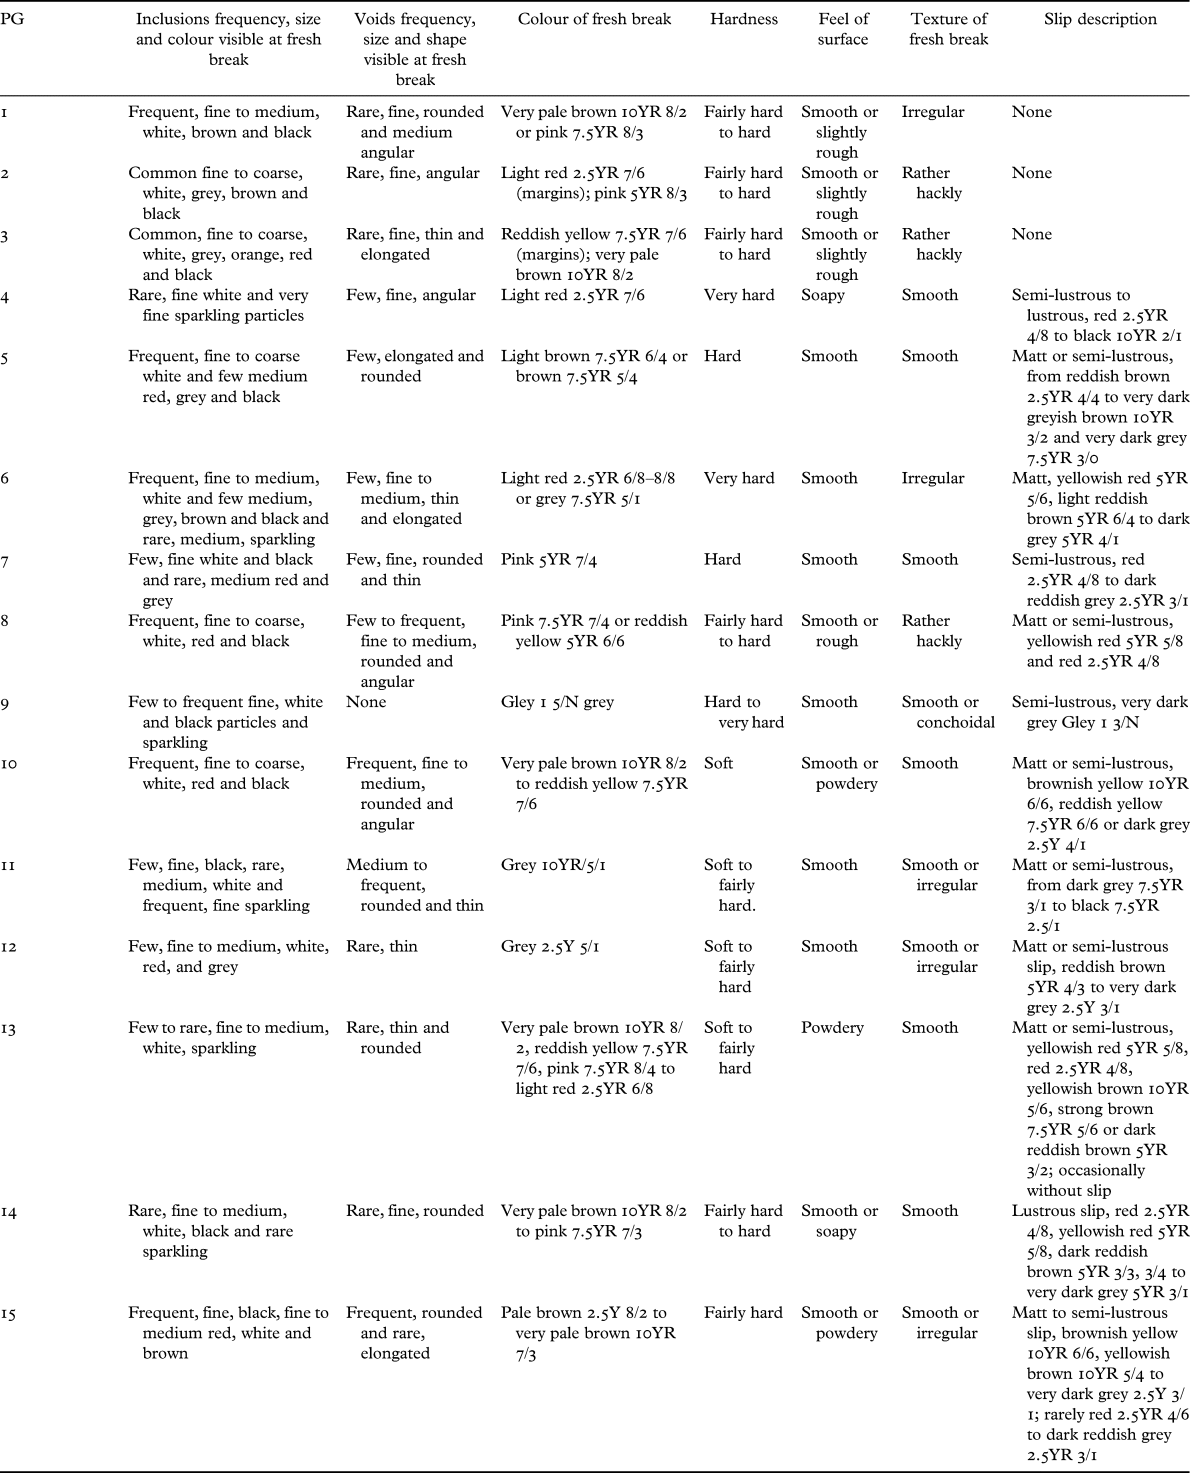
Ceramic fabric was examined and recorded following the system proposed by C. Orton and M. Hughes (Reference Orton and Hughes2013), with some modifications. The following parameters were noted: frequency, size and colour of inclusions; frequency, size and shape of voids; colour of the fresh break; hardness; feel of the surface; texture of the fresh break; as well as colour and glossiness of slip. The lamps were analysed by naked eye and with a handheld magnifying lens (x10) in natural light. The colours were recorded using Munsell Soil Color Charts (2013), and the surface feel was assessed through finger touch.
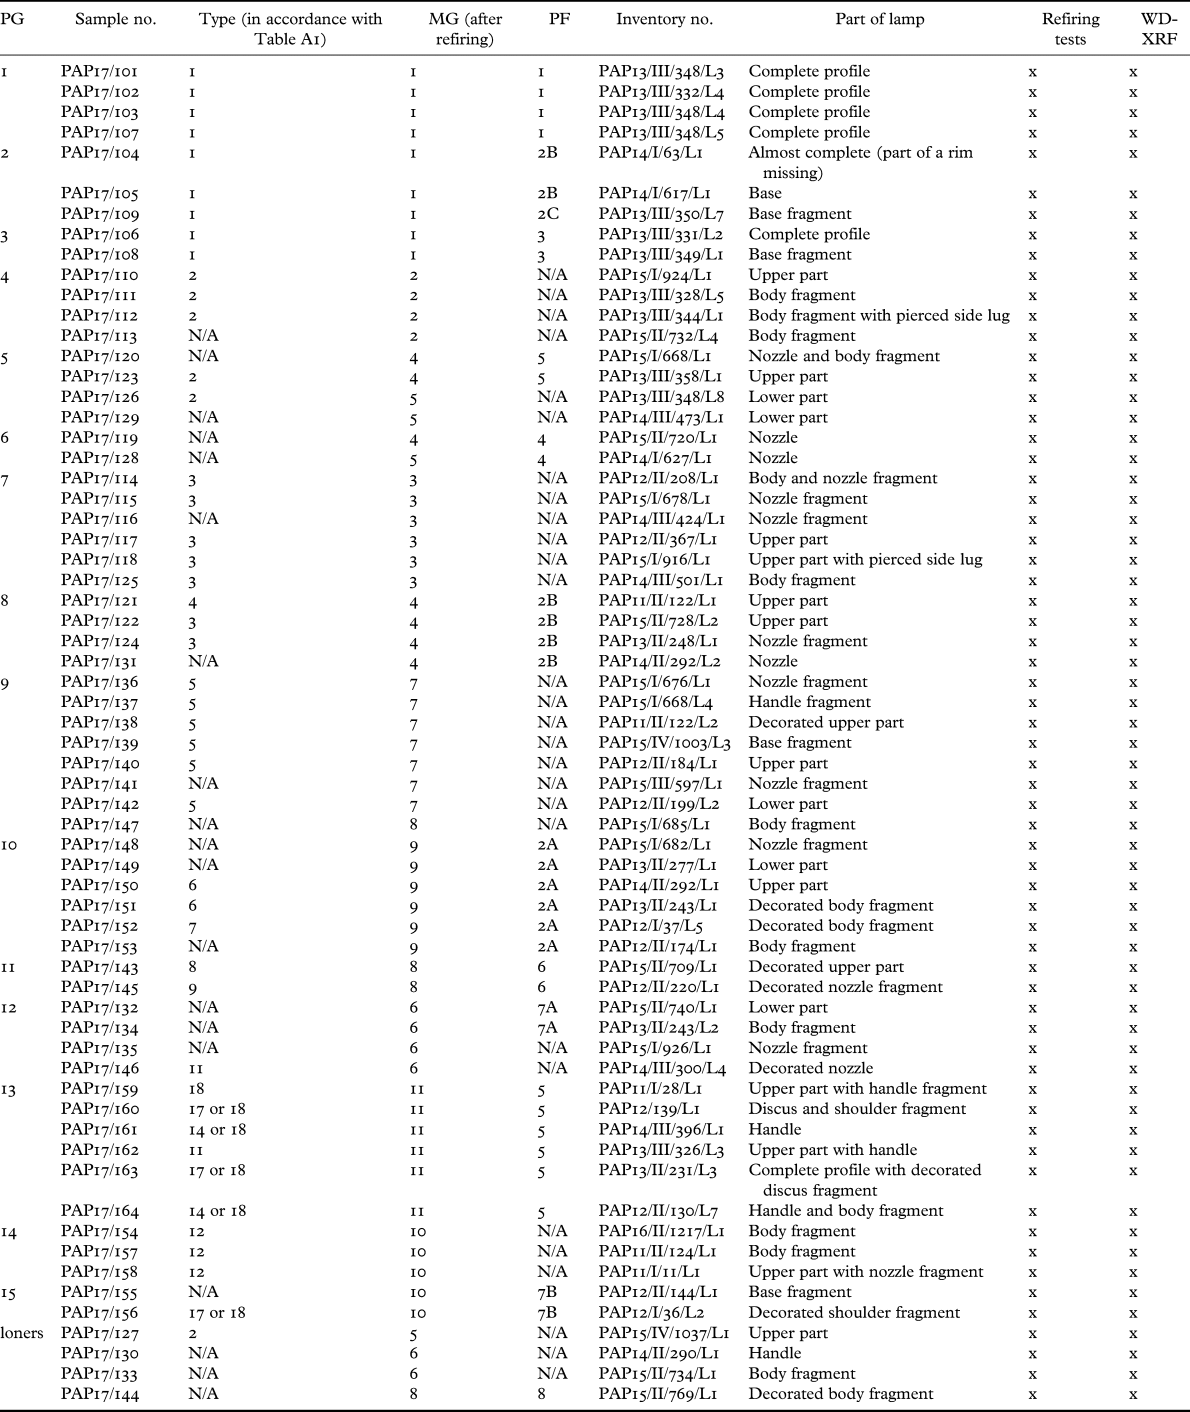
The combination of typo-chronological examination with macroscopic fabric analysis resulted in the definition of 11 MGs including 621 lamps. In addition, 108 fragments of lamps were not assigned to any of these MGs because they were either very poorly preserved (7 burnt-out nozzles), were outliers with no similarity to other lamps (25 fragments), or bore similarities to only very few other fragments (76 fragments).Footnote 5 Sixty-four samples representing the 11 MGs were selected for subsequent laboratory analysis. Four to nine samples were selected from each MG, depending on the size of the MG and its internal homogeneity, but also on the availability of material for sampling. The majority of the macroscopically studied lamps could not be sampled due to the presence of decoration, small size of fragments, or the complete state of preservation.
All selected samples were initially subjected to refiring tests (in oxidising atmosphere, maximum temperature 1000°C, one hour soaking time) to eliminate differences in colour potentially associated with variable conditions of the original firing, use or burial, providing further support for the macroscopic grouping that was also based on fabric colour (Rice Reference Rice1987, 344–5; Whitbread Reference Whitbread1995, 390–1; Kiriatzi, Georgakopoulou and Pentedeka Reference Kiriatzi, Georgakopoulou, Pentedeka, Gauss and Kiriatzi2011, 70).
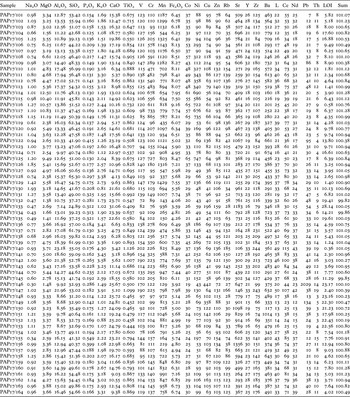
The colours of the fully oxidised clay pastes and slips were compared to each other and to the fabric colour before refiring. Subsequently, in order to determine the elemental composition, all samples were analysed with a wavelength dispersive X-ray fluorescence (WD-XRF) spectrometer with an Rh excitation source (BRUKER S8-TIGER), using a custom calibration based on 43 certified reference materials (Georgakopoulou et al. Reference Georgakopoulou, Hein, Müller and Kiriatzi2017). Twenty-six major, minor and trace elements were determined: Na, Mg, Al, Si, P, K, Ca, Ti, V, Cr, Mn, Fe, Co, Ni, Cu, Zn, Rb, Sr, Y, Zr, Ba, La, Ce, Nd, Pb and Th. The elemental data were processed statistically using R software to assess the variability of the dataset, as well as to explore compositional associations of the samples.
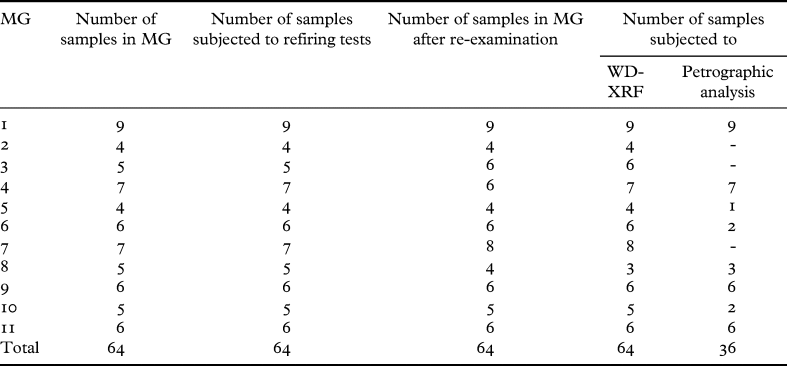
Based on the results of the macroscopic examination, refirings and elemental analysis, 36 samples were selected for petrographic analysis. The selection of samples for thin section petrography aimed to provide a better understanding of variability observed in elemental composition within certain MGs, facilitate associations between chemical and macroscopic groupings, and provide information on the geological origin, and thus provenance, of certain groups. Emphasis was placed on potential local lamps, as the current study aims to shed light primarily on local production. For this reason, all samples of MGs of presumed local origin and only selected samples of uncertain provenance were analysed (Table 1). The thin sections were examined with a Zeiss Axioskop 40 polarising microscope at magnifications ranging between x25 and x500. For the fabric descriptions, an adjusted version of the methodology proposed by I. Whitbread (Reference Whitbread1995, 365–96) was adopted.
Nea Paphos Agora lamps: macroscopic groups and selection of samples for refiring, WD-XRF and petrographic analysis.

The integration of macroscopic observations with the results of analysis led to the definition of archaeologically meaningful groups, referred to as Production Groups (PGs). Each PG consists of samples similar in terms of category, typology, chronology, fabric, and elemental and mineralogical composition. Once PGs were established on the basis of selected samples, a re-examination of the entire collection of lamps was undertaken (including those classified into MGs and the unclassified ones), aiming to test groupings in the light of more securely established criteria and proceed with quantification. The recording of counts of lamps and their sherds aimed to provide the minimum number of vessels representing each PG. In most cases, all fragments were counted, with the exception of body sherds representing the same PG found in the same context. These were treated as one lamp to reduce the risk of error. The PGs’ provenance was explored both through stylistic and compositional comparisons. In the latter case, the compositional profile of each PG was compared both with geological evidence (for Paphos and other relevant areas) and with compositions, chemical and mineralogical, of reference materials of known provenance, either published or unpublished (the latter part of the Fitch Laboratory's collections). All types of available comparative material and evidence were taken into account in order to identify the provenance of the PGs as confidently as possible.
RESULTS AND DISCUSSION
The results of the macroscopic analysis indicate the presence of 11 MGs linked to four major categories of lamps. These categories are wheel-made open (MG 1), wheel-made closed (MG 2, MG 3, MG 4, MG 5, MG 6), mould-made closed (MG 7, MG 8, MG 9), and mould-made closed discus (MG 10 and MG 11). The typological and chronological examinations show the presence of 18 types dated to the Hellenistic and Early Roman times. The wheel-made open lamps include only one type. The wheel-made closed lamps consist of four types differentiated on the basis of body shape in vertical section and the presence of decoration. Six types with different body shape in horizontal section, finishing elements, and/or decoration were defined within the mould-made closed lamps. The mould-made discus lamps were divided into seven types with a distinct shape of a nozzle and the presence or absence of volutes and a handle. The lamp categories, types, chronology, and the selected classifications are presented in Table A1.
All selected samples, representing the 11 MGs, were subjected to refiring tests that provided evidence for re-adjusting them (see Table 1). For example, PAP17/125, which was initially assigned to MG 4, was moved to MG 3, while PAP17/147 was moved from MG 8 to MG 7. The refiring tests provided helpful information, in particular in the case of the fully reduced grey fabrics, in which inclusions can be difficult to discern macroscopically, but become more easily detectable after refiring in oxidising conditions.
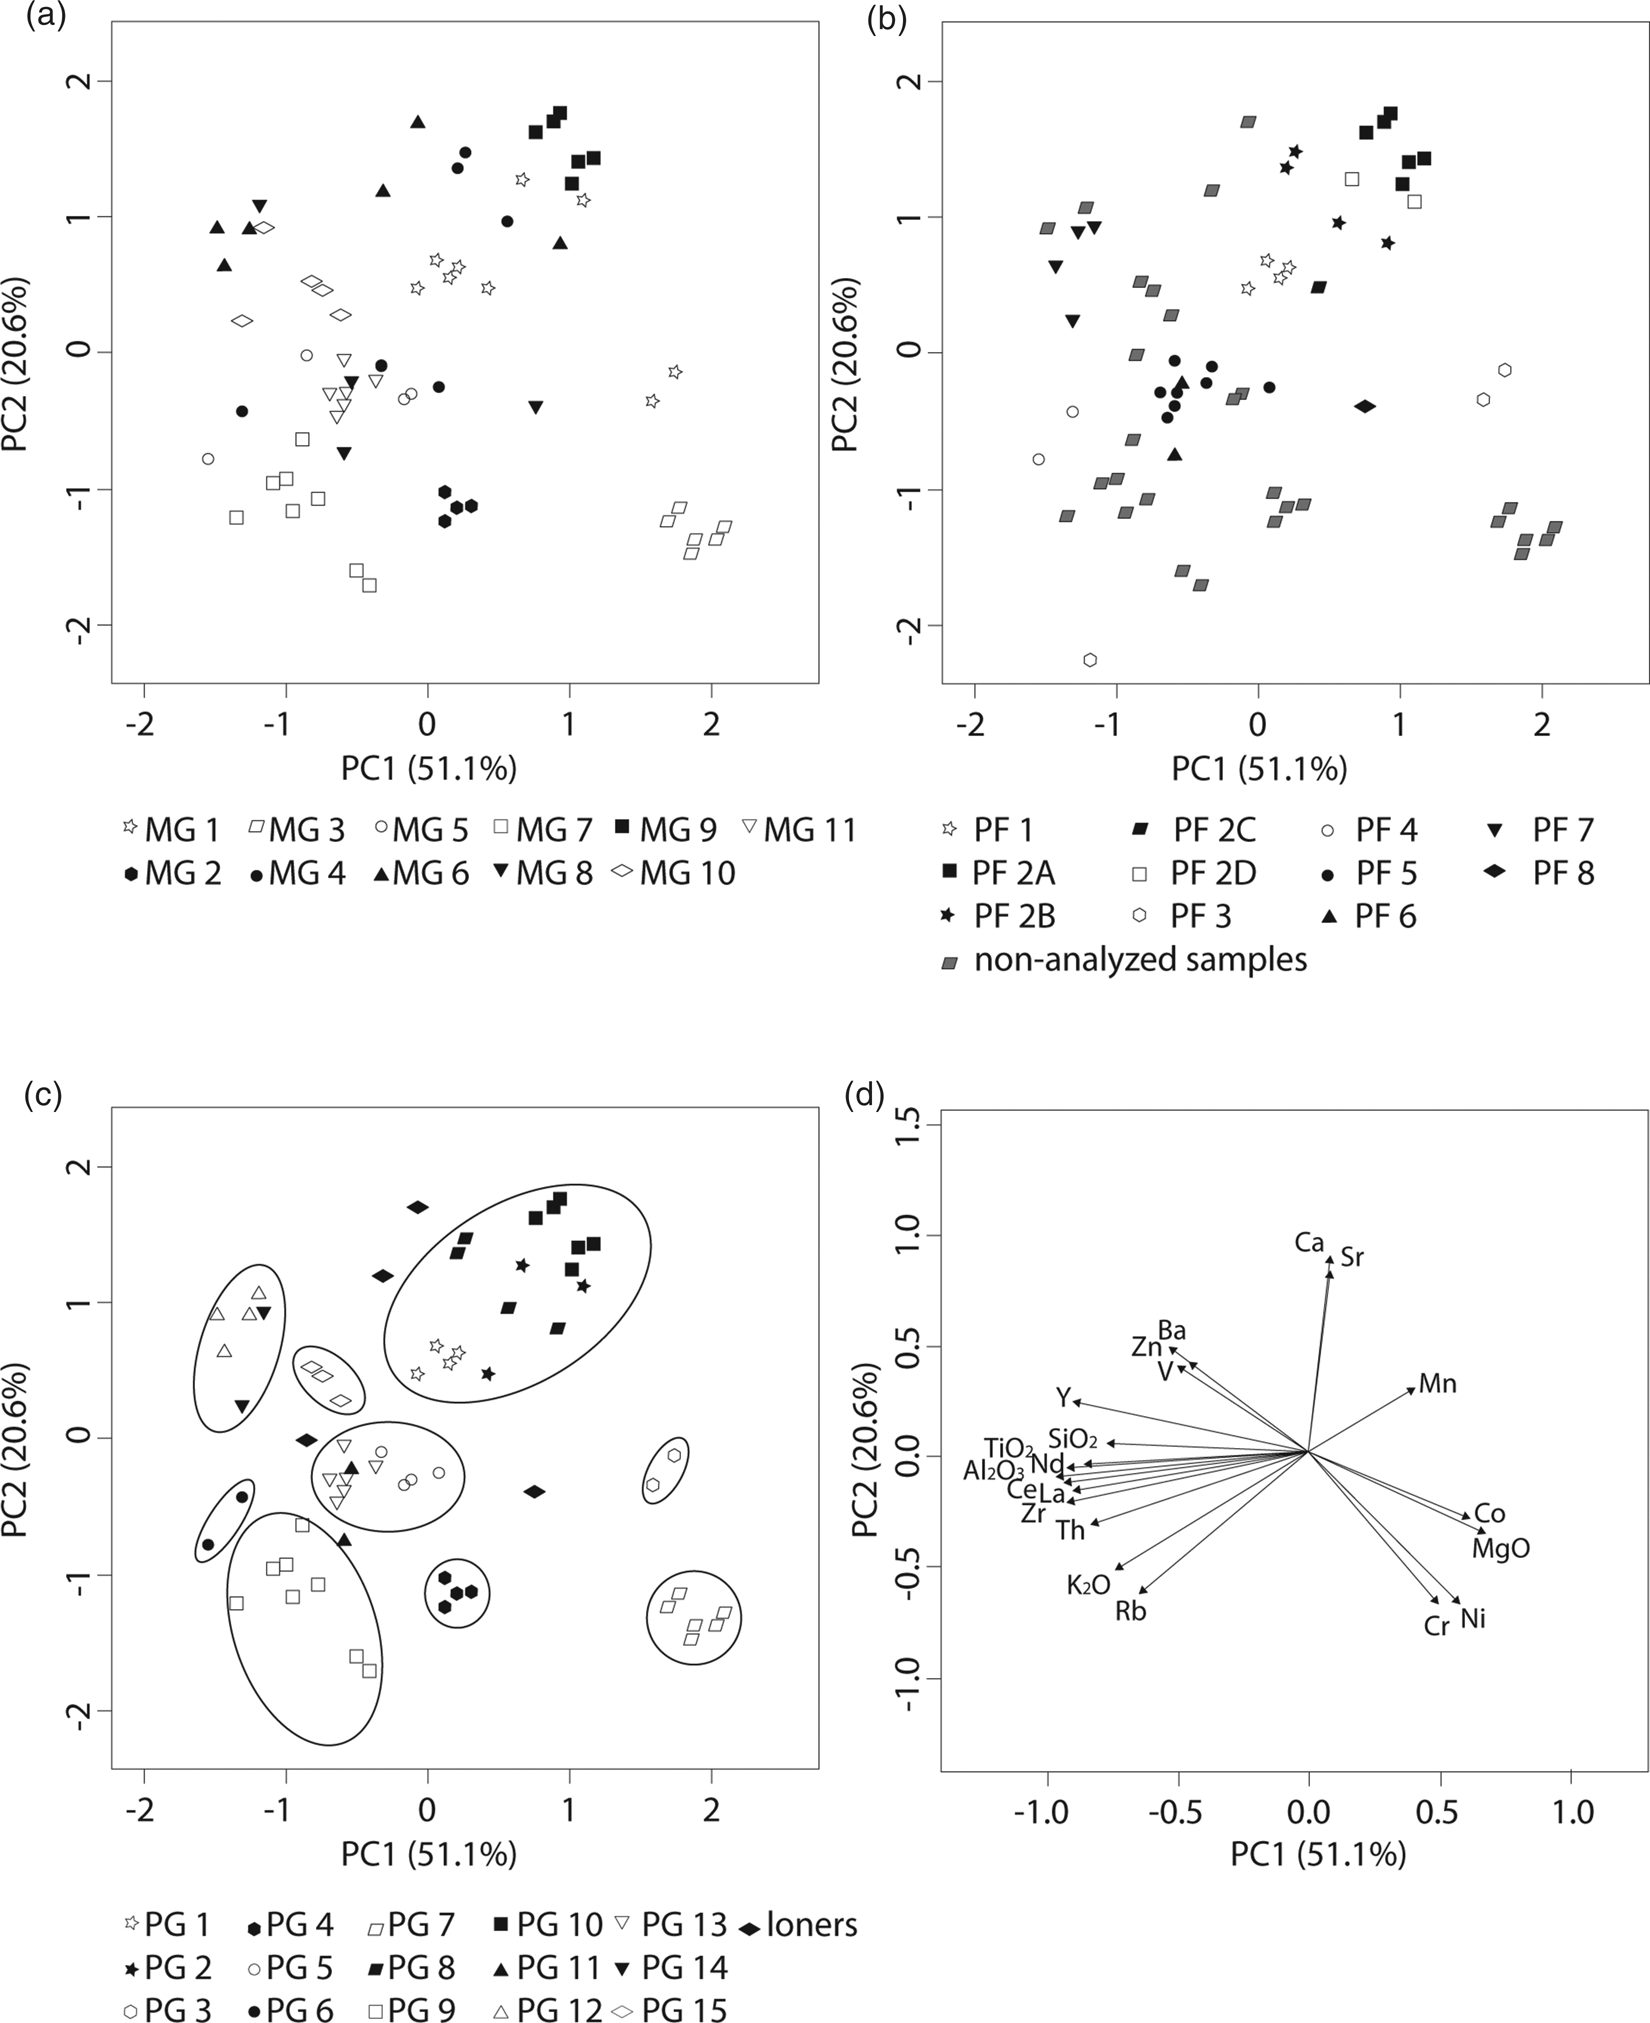
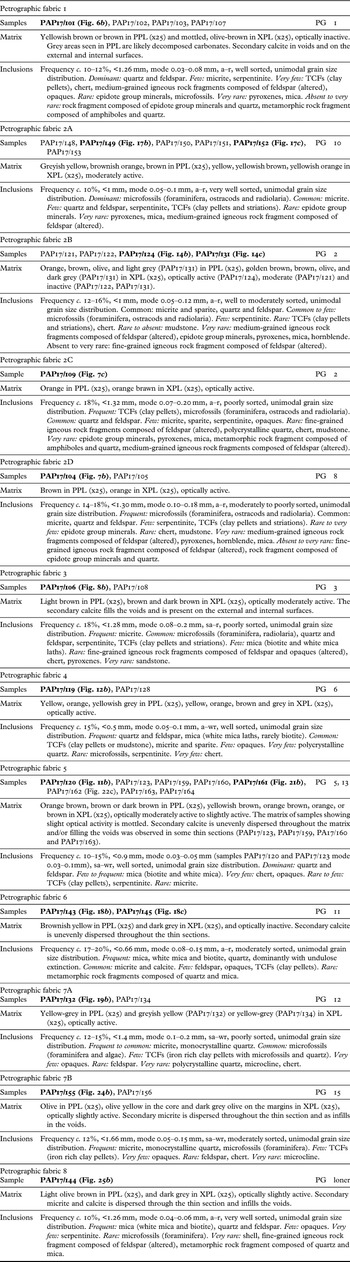
Statistical analysis was performed on the dataset with elemental compositions of 64 samples (Table A2). The calculation of the variation matrix for 26 elements was carried out in order to assess the variability of the dataset including all samples. The result showed a high value of the total variation (vt=4.57), suggesting a heterogeneous dataset (Buxeda i Garrigós Reference Buxeda i Garrigós1999; Buxeda i Garrigós and Kilikoglou Reference Buxeda i Garrigós, Kilikoglou and van Zelst2003). Pb shows the highest chemical variability, which was mostly introduced by exceptionally high concentration measured in PAP17/146 (2029 ppm). This appears to be a result of contamination, since this sample was found in contact with lead objects. Pb and Cu were removed from the dataset (Georgakopoulou et al. Reference Georgakopoulou, Hein, Müller and Kiriatzi2017). Additional elements excluded from the dataset were Na and P, as their variability may be related to the original use or post-depositional conditions (e.g. Picon Reference Picon1991; Buxeda i Garrigós Reference Buxeda i Garrigós1999; Schwedt, Mommsen and Zacharias Reference Schwedt, Mommsen and Zacharias2004). After removing these elements, the total variation remained high, indicating that the analysed lamps may have come from various production centres. Principal component analysis (PCA) and cluster analysis were performed on the log ratio transformed data, excluding Na2O, P2O5, Cu, and Pb and using Fe2O3 as a divisor since it introduces the lowest variability to the dataset. The plot resulting from PCA (Fig. 3a) illustrates the associations between the elemental composition of the samples and MGs already adjusted with the results of firing tests. There are positive correlations between some MGs and elemental composition of samples assigned to them on the basis of macroscopic examination (see Fig. 3a: MG 2, MG 3, MG 7, MG 9, MG 11). However, this is not the case for all the samples. Some show different associations than those suggested by macroscopic analysis (see Fig. 3a: MG 1, MG 4, MG 5, MG 6, MG 8, MG 10). This could be caused by the different origins of samples classified into these preliminary MGs, or may be related to technological or raw material variability and/or post-depositional processes. As mentioned above, in order to understand these discrepancies and to further examine the potentially local production of lamps, selected samples from eight MGs were analysed by thin section petrography (Table 1). MG 2, MG 3 and MG 7 were not analysed through thin section petrography due to their homogeneity and well-defined origin on the basis of macroscopic and elemental analysis (see below). The petrographic analysis defined eight fabric groups (Petrographic Fabric – PF; see Table A3). The comparison of PFs with the results of the typological examination showed that some of them consist of lamps classified into different categories, types and chronology. The correlation of the PFs with the chemical data (Fig. 3b) clarified the associations of some samples, which were grouped differently by macroscopic examination and elemental analysis. Additionally, the petrographic analysis provided valuable information concerning the provenance of samples which could not be assigned to any chemical reference pattern, and identified the presence of secondary calcite in several samples, potentially influencing the elemental composition, and thus the clustering, of the samples.
The principal component plot of the WD-XRF data including 22 elements for the 64 samples. (a) in correlation with macroscopic groups adjust after refiring (MG). (b) in correlation with petrographic fabrics (PF). (c) in correlation with production groups (PG). (d) projections of elements loading the first two principal components.
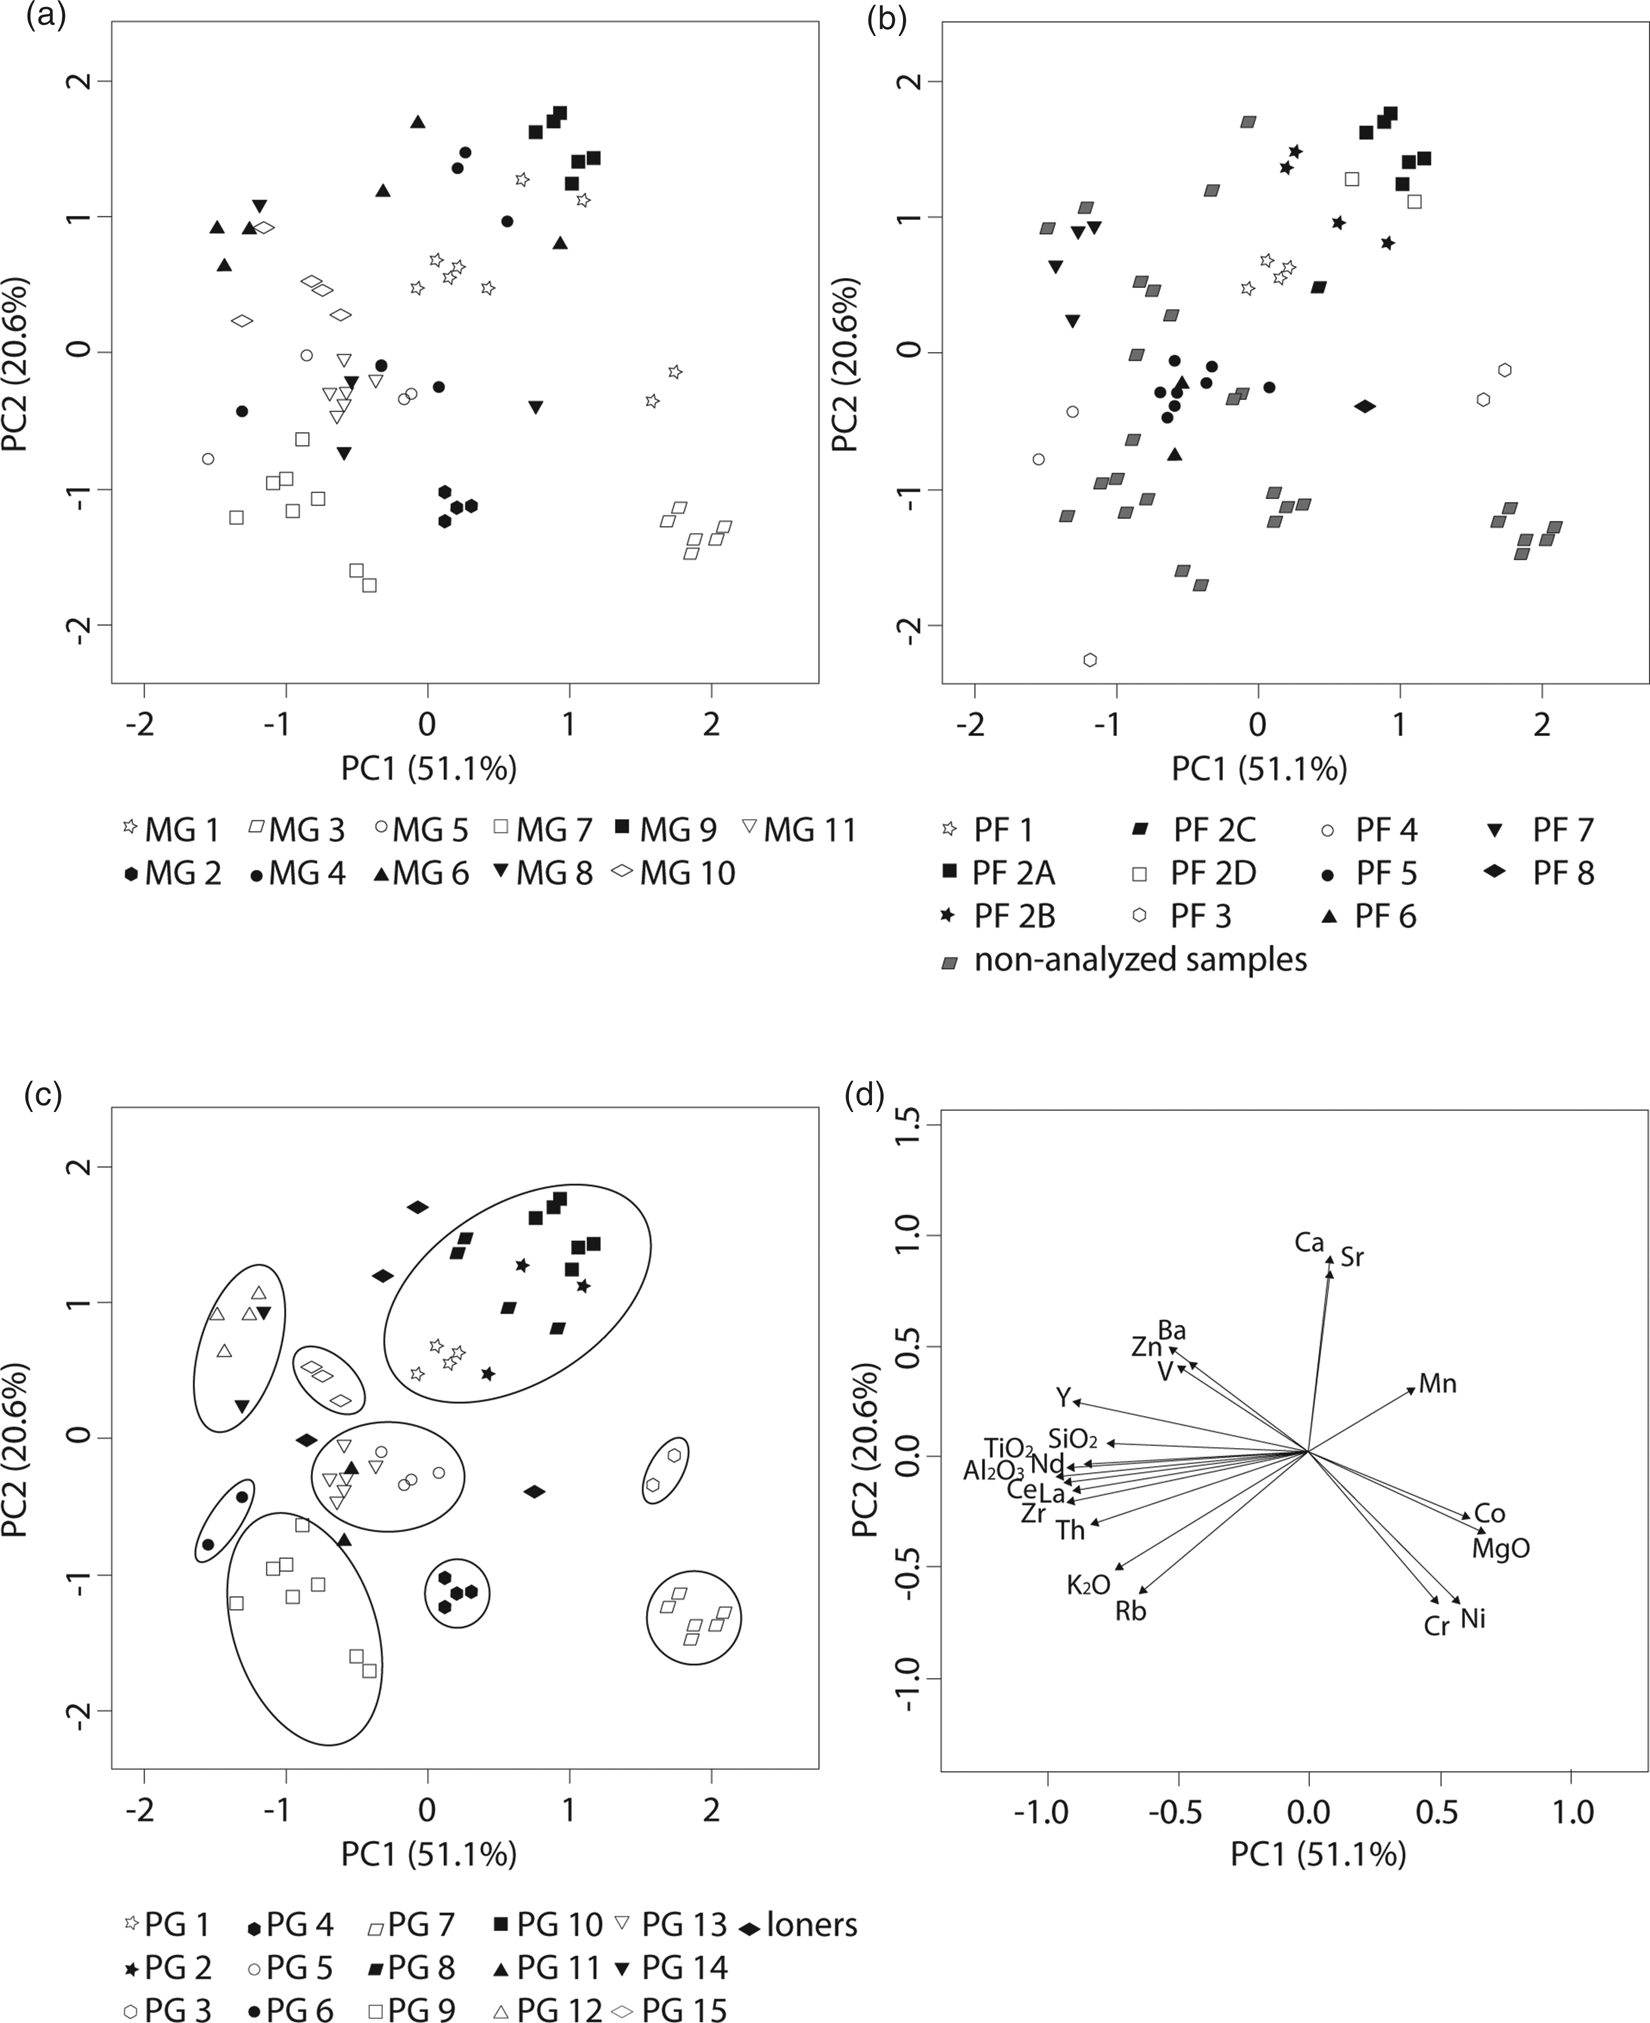
Once the laboratory examinations were completed, the entire macroscopic assemblage was re-examined, using the methodology employed for the formation of MGs, but taking into consideration the results of refiring tests, elemental analysis and thin section petrography (Table A4). The integrated assessment of these different strands of data led to the final definition of 15 PGs, characterised by differences in provenance, technology and/or chronology, while four samples were not grouped in any of the PGs and will be further discussed as loners.
The plot resulting from PCA (Fig. 3c) illustrates that most of the PGs are chemically well distinguished. The exception is PG 11, the samples of which do not group with each other. The plot also shows the relation between some of the PGs. PG 1, PG 2, PG 8 and PG 10, all interpreted as local, cluster together in the upper right part of the plot. PG 5 and PG 13 are grouped in the middle, while PG 12 and PG 14 are in the upper left part of the plot.Footnote 6
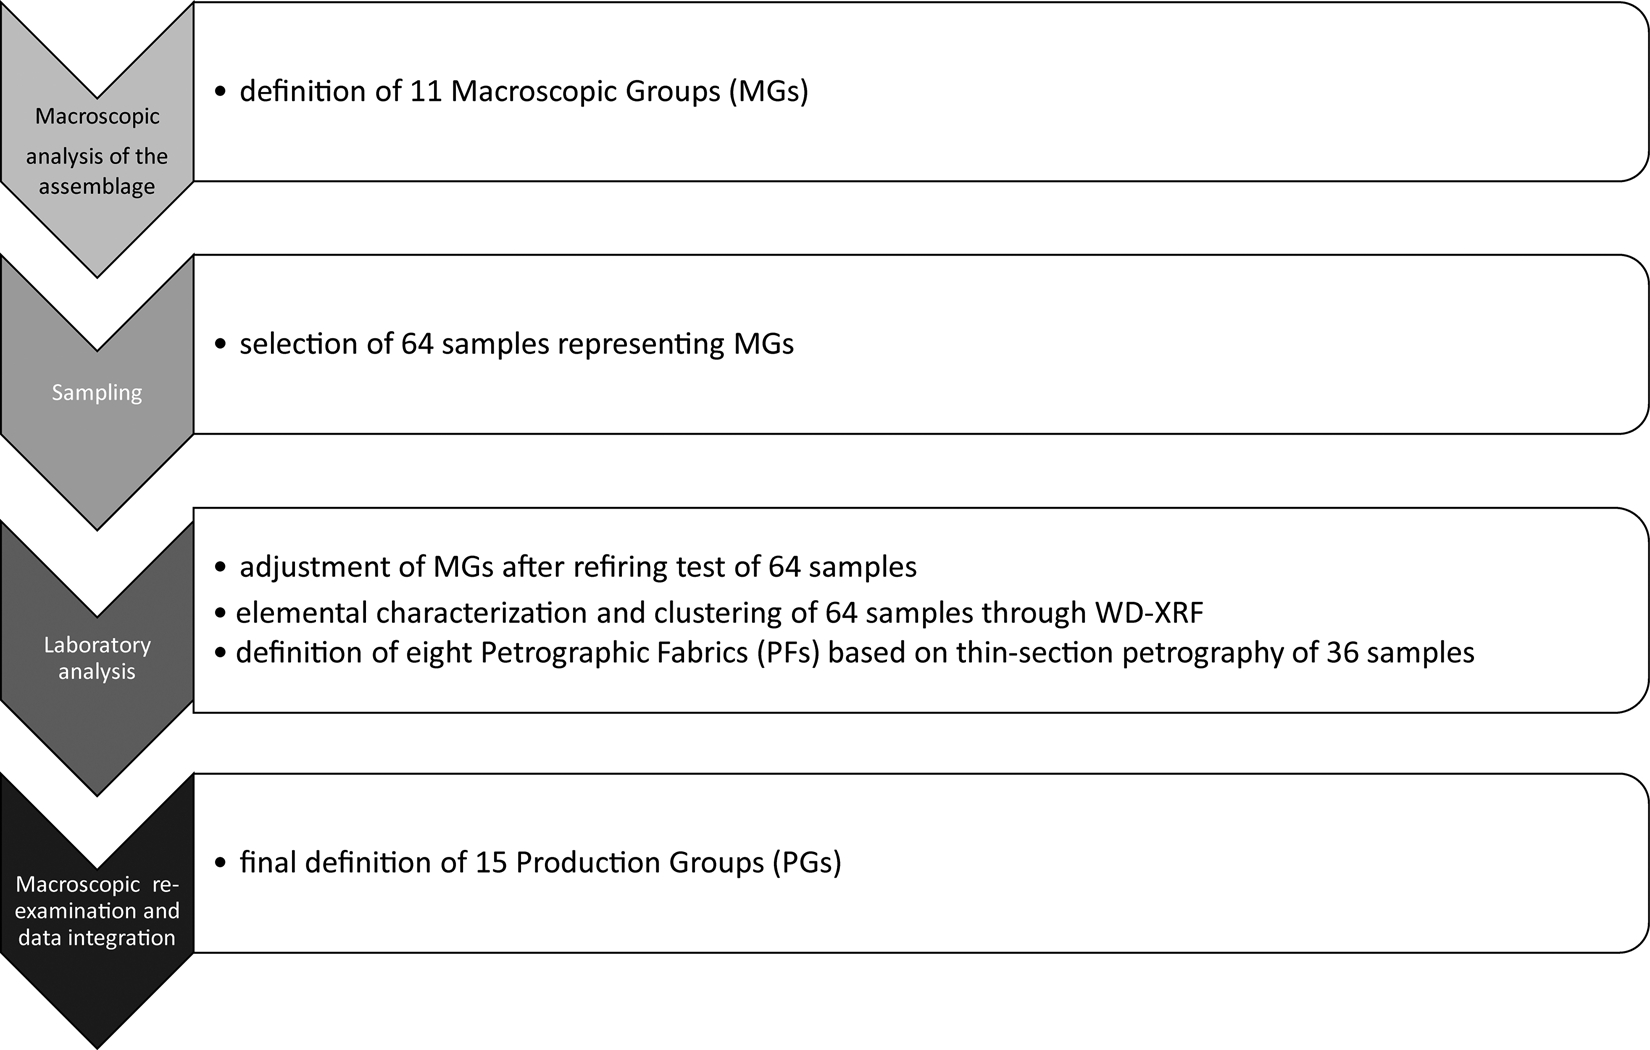
Once the PGs were defined, the original MGs were dismissed.Footnote 7 They were significant only in the first stage of the research, and should be considered rather as a tool used to understand the macroscopic variability of the assemblage, which was necessary for the selection of samples for further examinations (Fig. 4).
A graph showing the research process.

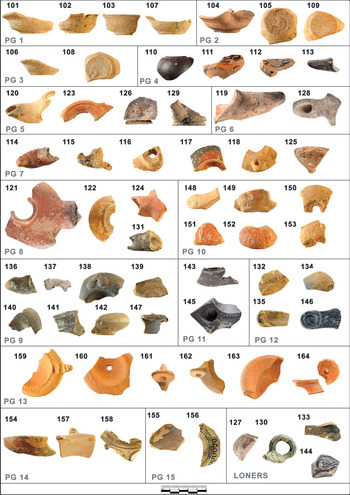
It should be emphasised that each type of analysis contributed significantly to the understanding of different aspects of the samples and the exploration of their relationships, and had an important, although different, impact on the definition of the final PGs and their provenance assignment. Due to the limited number of analysed samples, some PGs include only two or three samples subjected to elemental analysis (Table A5, Fig. 5). In such cases, greater emphasis was placed on the macroscopic and petrographic examinations, and these had a stronger impact on PG formation (e.g. PG 2, PG 11) and on drawing conclusions on their provenance. The chemical data of samples from these PGs were considered in a more qualitative way, discussing in each case whether they support the provenance proposed on the basis of macroscopic examination. The comparison of lamp elemental and/or mineralogical compositions with the existing reference data of other pottery enabled the assigning of origin to some PGs (PG 3, PG 5, PG 6) (Schneider Reference Schneider2000a; Picon and Blondé Reference Picon and Blondé2002). In particular, the Hellenistic colour-coated ware pottery from Nea Paphos, analysed in previous studies (Marzec Reference Marzec2017; Marzec et al. Reference Marzec, Kiriatzi, Müller and Hein2018; Reference Marzec, Kiriatzi, Müller and Hein2019), proved to be useful comparative material for this investigation, not least as they had been analysed using the same techniques.
Photographs of the analysed samples. Individual numbers and PGs are provided.

In the following section, the PGs are presented according to category and chronology. The descriptions of the PGs presented below also include information about lamps not analysed through laboratory analyses, which had been attributed to the PGs after the final macroscopic re-examination of the entire assemblage, taking into consideration new criteria. A total of 608 lamps were classified into 15 PGs (prior to scientific analyses, 621 lamps had been assigned to 11 MGs). The description of each PG presents quantity, type, chronology, appearance of fabric, summary of elemental and, where available, mineralogical composition, and distribution pattern in the Eastern Mediterranean reconstructed on the basis of published material. Additionally, at the end of the section, the ungrouped samples which had been analysed through the laboratory analysis are shortly described.
PRODUCTION GROUPS PRESENTATION
Wheel-made open lamps
All wheel-made open lamps recovered during the excavations at the Paphos Agora were classified into one type. They have low, shallow and rather small bodies and out-turned rims which are pinched, each forming a single nozzle (Table A1:1). Their surfaces are smoothed and plain, lacking any coating or decoration. This type of lamp was used on Cyprus since the Bronze Age (Oziol Reference Oziol1977, 13), and its presence is attested at various sites on the island (Vessberg Reference Vessberg, Vessberg and Westholm1956, 184; Oziol and Pouilloux Reference Oziol and Pouilloux1969, 16; Bailey Reference Bailey1975, 207–9; Oziol Reference Oziol1977, 17–19). The Hellenistic derivatives of earlier prototypes seem to be smaller and shallower. They date to the late fourth and the third centuries bc (Kajzer Reference Kajzer2020, 285). Sporadically, including at the Agora, they occur in contexts dated to the second century bc. Open wheel-made lamps dated to the Hellenistic period have been found at numerous sites on Cyprus,Footnote 8 including many locations within Nea Paphos.Footnote 9 Initially, all of the wheel-made open lamps recovered at the Agora were assigned to one MG. Nine samples representing this MG were subjected to refiring tests, WD-XRF and thin section petrography in order to assess the homogeneity of the group. The laboratory analysis combined with the macroscopic re-examination of this material allowed three different PGs to be identified within this category.
Production Group 1
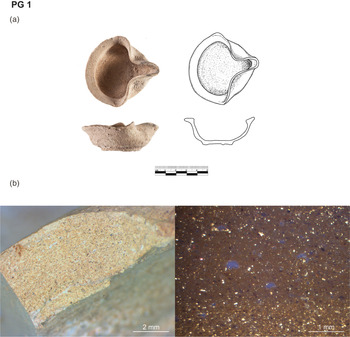
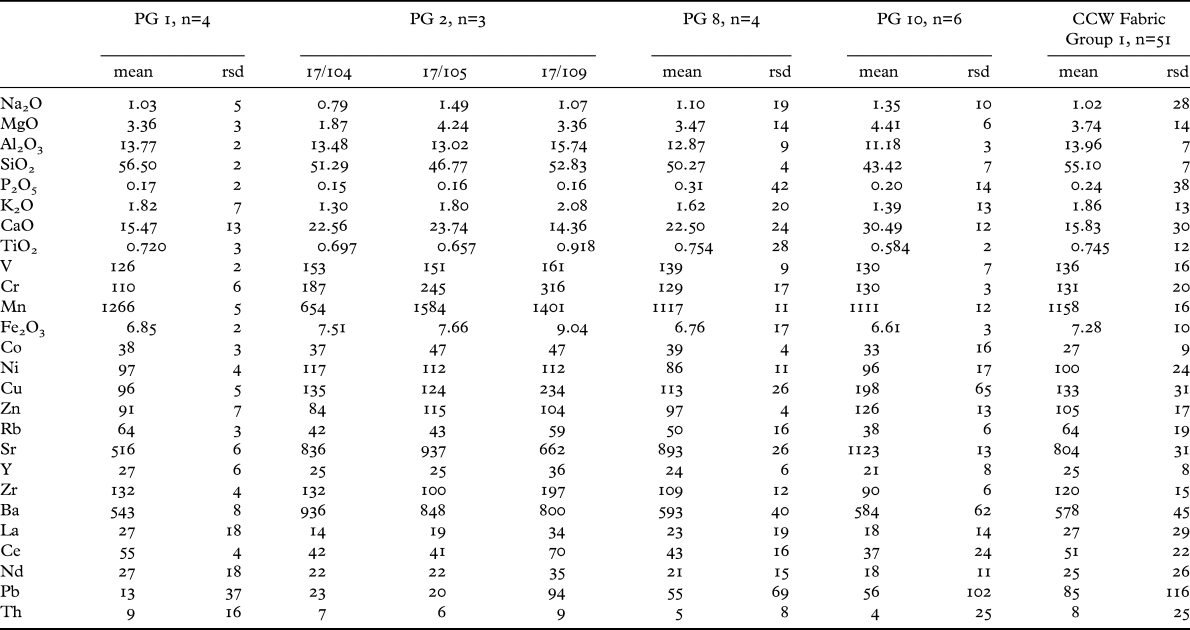
Thirteen lamps with fine very pale brown or pink fabric were assigned to PG 1 (Table A4). The four samples (Table A5, Fig. 5) that were subjected to laboratory analysis form a coherent group in terms of elemental (Table 2) and mineralogical compositions. The PF is very fine and consists of quartz, feldspar, micrite, serpentinite, textural concentration features, chert, medium-grained igneous rock fragments composed of feldspar, opaques, epidote group minerals and microfossils (Fig. 6b, Table A3:PF1).
Production Group 1: (a) photograph and drawing of lamp inv. no. PAP13/III/332/L2 and (b) fresh break and thin section (XPL) photomicrographs of sample PAP17/101.

Mean chemical compositions (oxides are expressed in wt% and elements in ppm) and relative standard deviation (rsd) of PG 1, PG 8, PG 10 and colour coated ware (CCW) of presumed local origin (Marzec et al. Reference Marzec, Kiriatzi, Müller and Hein2018, table 4), as well as elemental compositions of three samples classified to PG 2. Data normalised to 100%.

Production Group 2
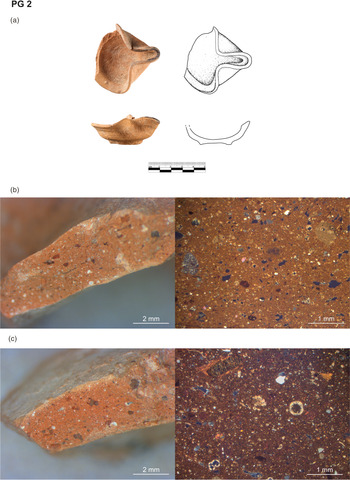
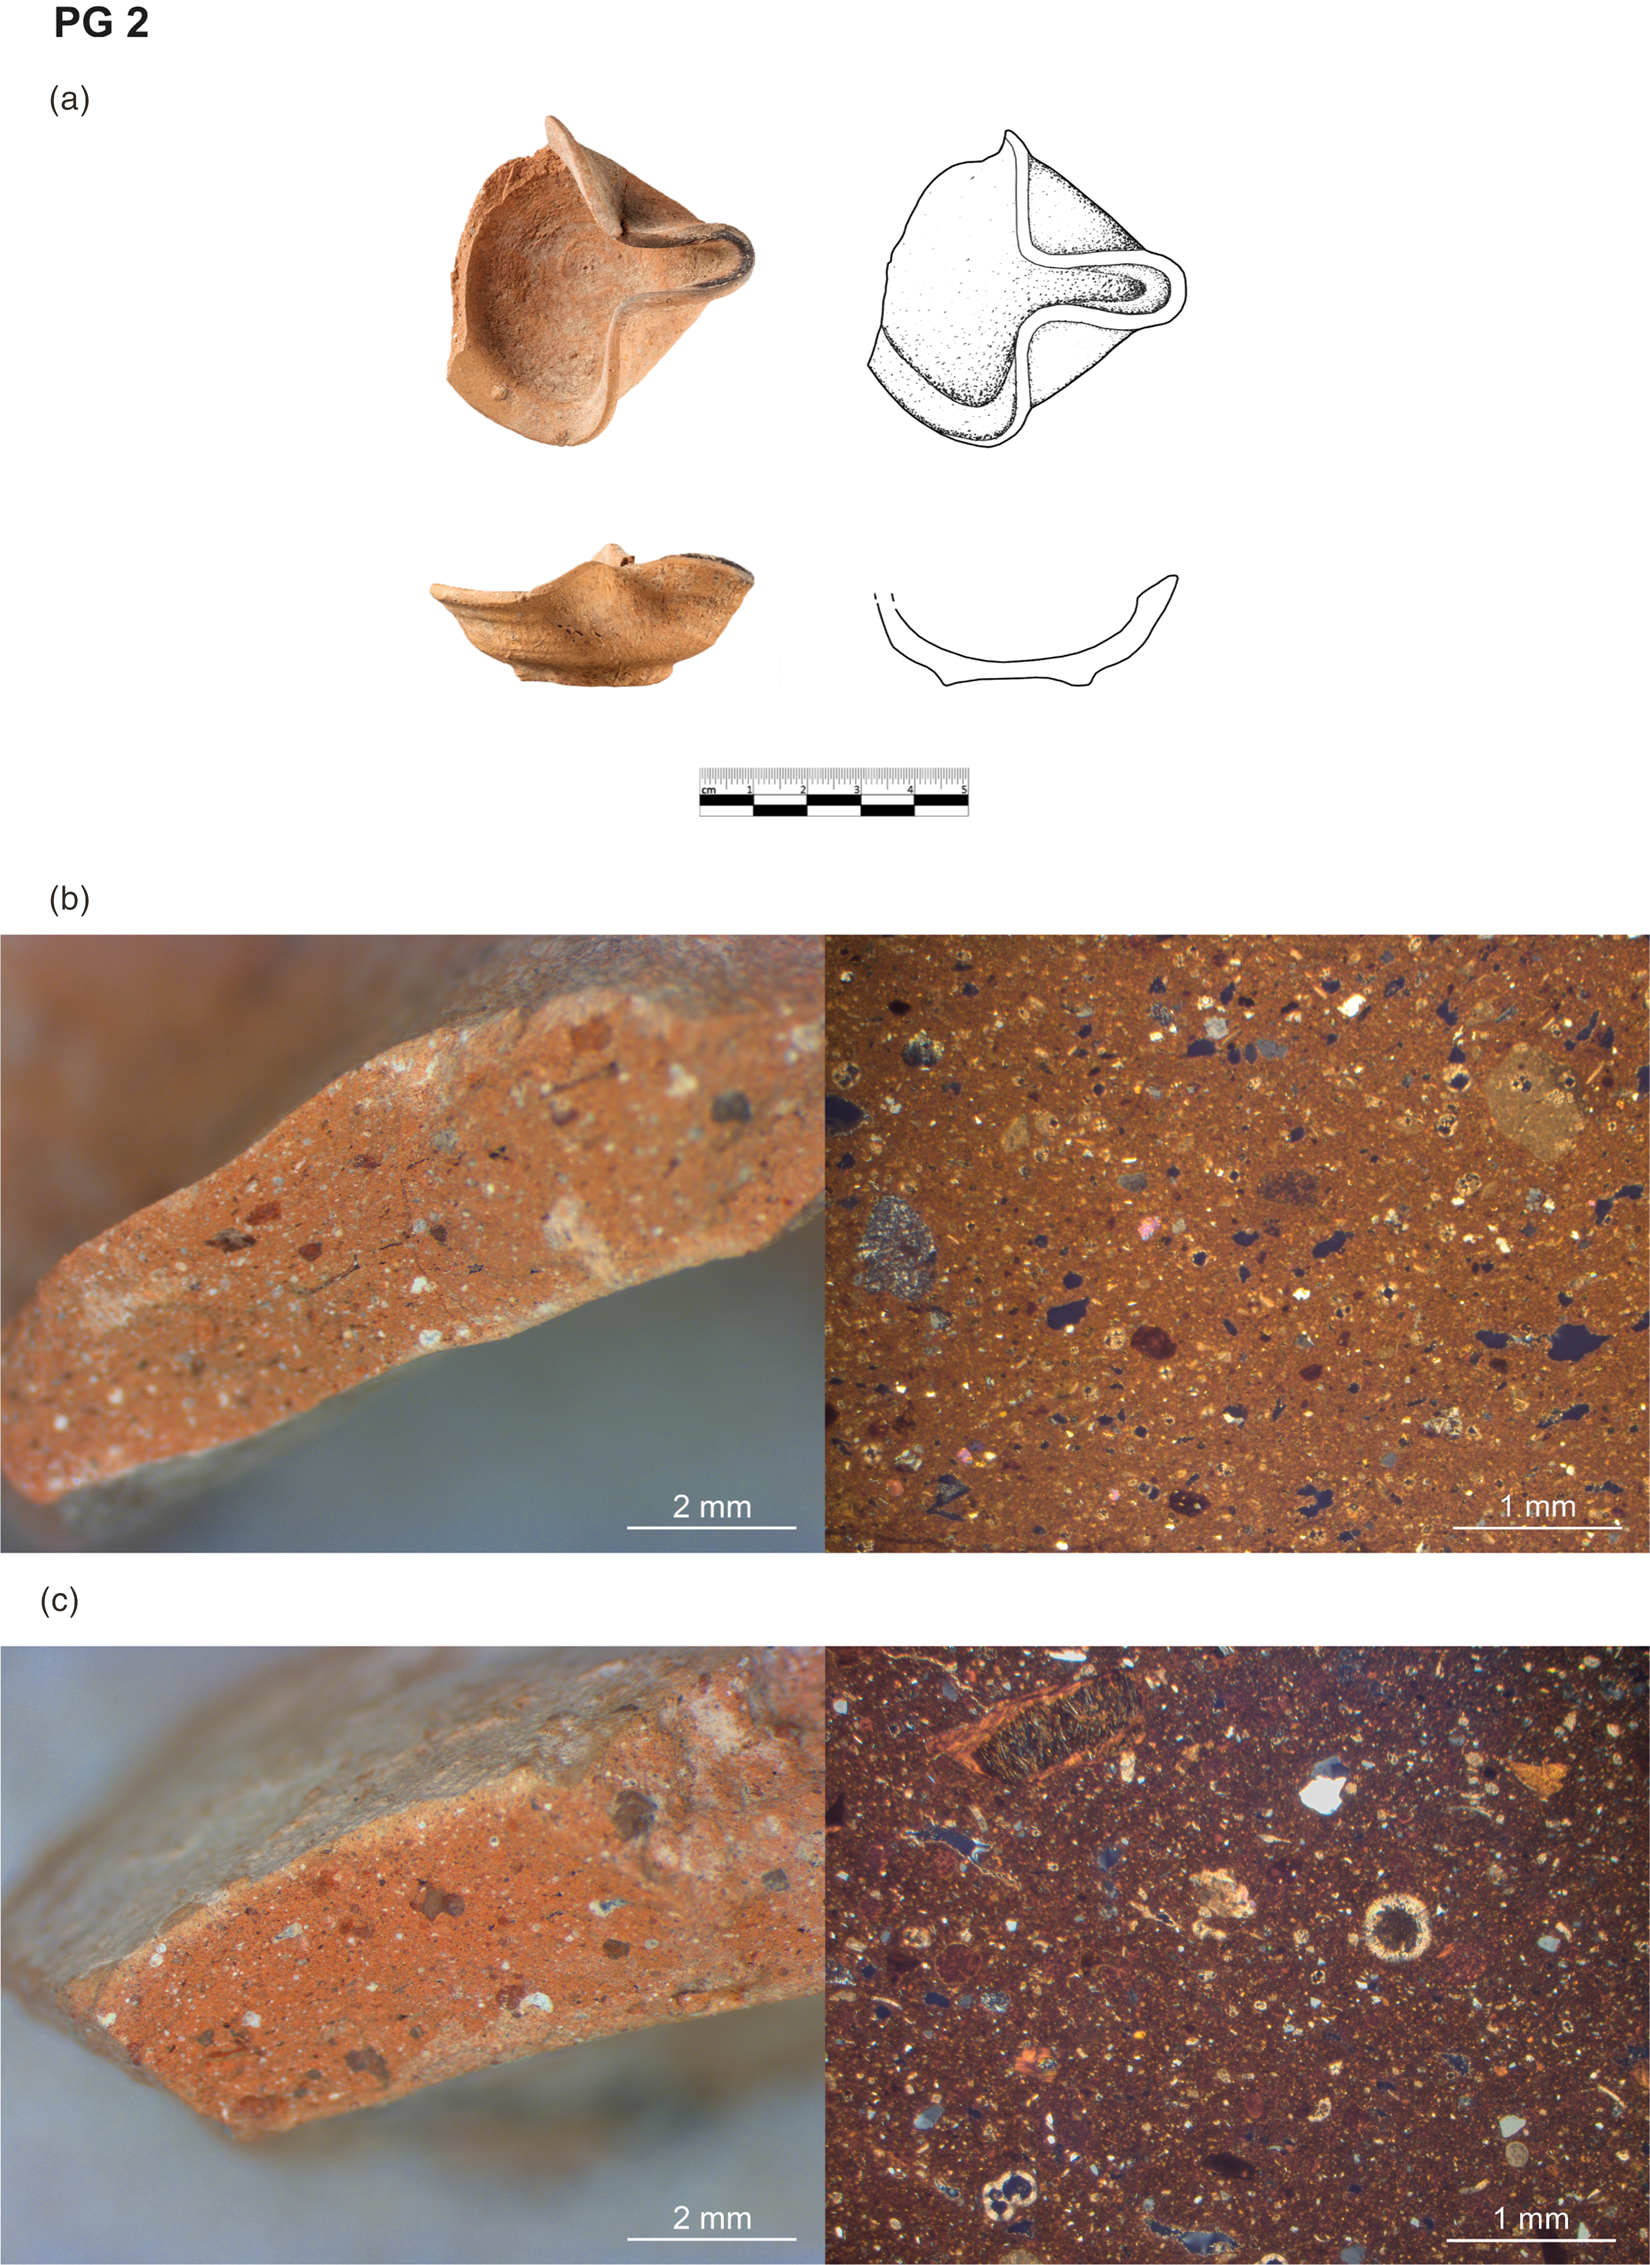
PG 2 consists of eleven lamps with semi-fine red fabric (Table A4). The three analysed samples representing this PG show some variability in their elemental compositions (Table 2, Fig. 3), although thin-section analysis revealed that they are very similar to each other, with differences mainly related to size and distribution of inclusions. Generally, the PF is calcareous and includes microfossils, micrite, quartz, feldspar, serpentinite, textural concentration features, epidote group minerals, chert, mudstone and medium-grained igneous rock fragments composed of feldspar (Fig. 7b, Table A3:PF2D). PF of PAP17/109 has larger fragments of serpentinite and additionally fine-grained igneous rock fragments composed of feldspar, as well as a metamorphic rock fragment composed of amphiboles and quartz (Fig. 7c, Table A3:PF2C).
Production Group 2: (a) photograph and drawing of lamp inv. no. PAP14/I/63/L1. Fresh break and thin section (XPL) photomicrographs of samples (b) PAP17/104 and (c) PAP17/109.
Production Group 3
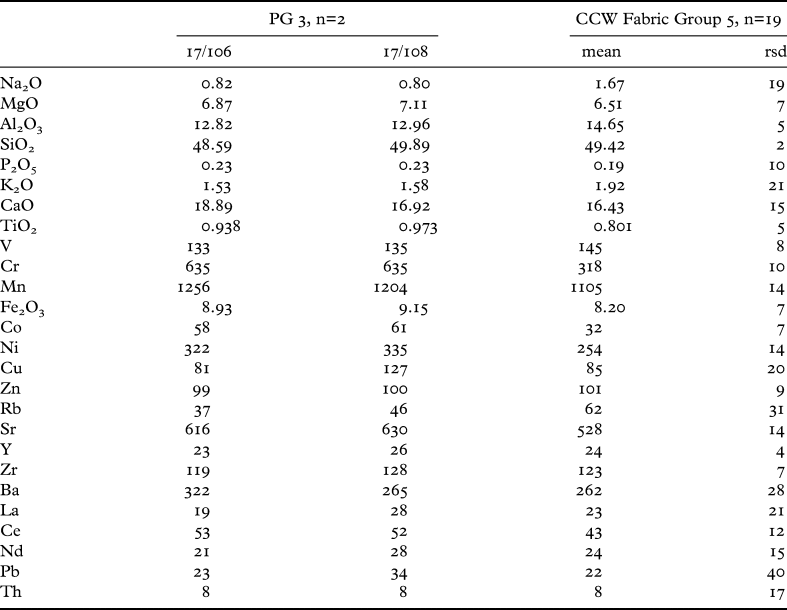
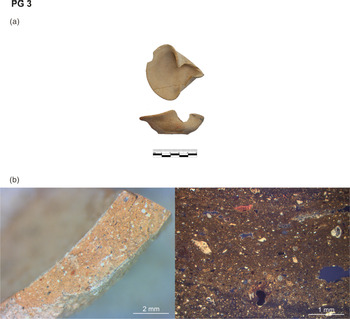
In contrast to PG 1 and PG 2, the fresh break of lamps assigned to PG 3 shows orange and red inclusions and elongated voids (Table A4). This PG includes eight lamps of which two (Table A5, Fig. 5) were subjected to scientific analysis. The elemental composition differs from that of other open lamps due to significantly higher Cr, Ni, Co and MgO concentrations (see Table 3, Fig. 3). Differences are also observed in thin section: samples assigned to PG 3 have a semi-fine, calcareous fabric characterised by the presence of micrite, microfossils, quartz and feldspar, serpentinite, textural concentration features, mica, fine-grained igneous rock fragments composed of feldspar and opaques, chert, pyroxenes, and sandstone (Fig. 8b, Table A3:PF3).
Compositions (oxides are expressed in wt% and elements in ppm) of two samples classified to PG 3 and mean chemical composition and relative standard deviation (rsd) of Fabric Group 5 of colour coated ware (CCW) pottery (Marzec Reference Marzec2017, Fabric Group 5). Data normalised to 100%.

Production Group 3: (a) photograph of a lamp inv. no. PAP13/III/348/L1 and (b) fresh break and thin section (XPL) photomicrographs of sample PAP17/106.

The mineralogy of all three PGs (PG 1, 2, 3) is related to ophiolitic geology. Despite differences in elemental and mineralogical composition, PG 1 and PG 2 can be tentatively associated with production in western Cyprus. This assumption is based on the similarity of both PGs to a group of colour-coated ware pottery recently analysed and considered as local to the site (Marzec Reference Marzec2017, 183–9, Fabric Group 1; Marzec et al. Reference Marzec, Kiriatzi, Müller and Hein2019). The elemental (Table 3) and mineralogical compositions of PG 3 show similarities to a group of Early Hellenistic colour-coated ware pottery that was previously assumed to have been imported to Paphos, potentially from the North Levant (Marzec Reference Marzec2017, 215, Fabric Group 5). At present, however, this attribution cannot be confirmed by either scientific or archaeological evidence.
Wheel-made closed lamps
Production Group 4
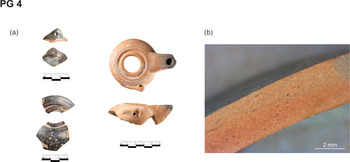
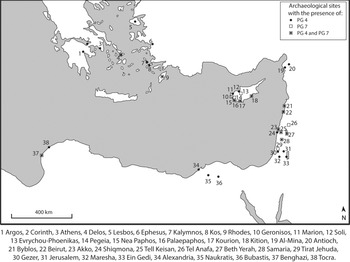
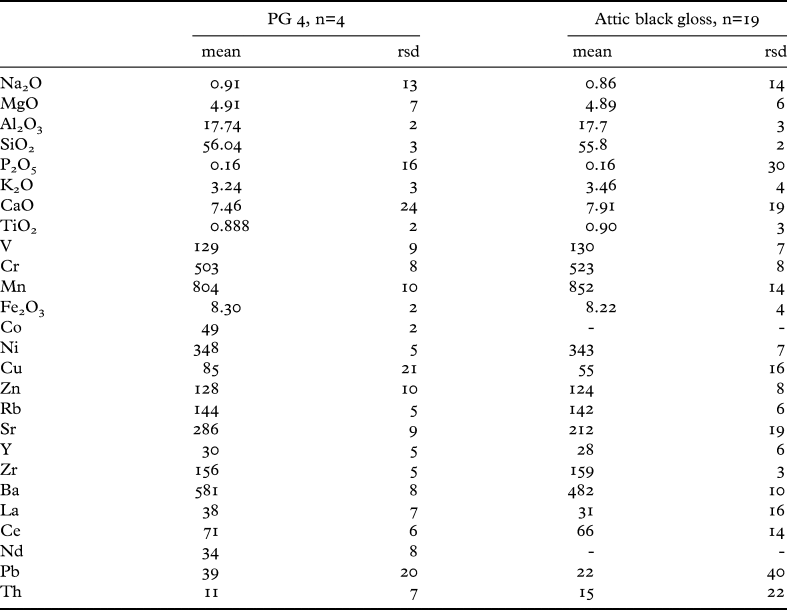
PG 4 consists of 16 fragments of wheel-made closed lamps with globular bodies in vertical section (Table A1:2), often equipped with side lugs, dated between the late fourth and the mid-third centuries bc. The appearance of the fabric (Fig. 9, Table A4) is homogenous throughout the PG and corresponds to lamps and table ware vessels assumed to have been produced in Attic workshops (Howland Reference Howland1958; Bailey Reference Bailey1975, 31; Rotroff Reference Rotroff1997, 10–11). Four lamps representing this PG (Table A5, Fig. 5) were subjected to refiring tests and elemental analysis through WD-XRF. The results are in agreement with the macroscopic assignment, indicating that all samples belong to a single, homogenous, group characterised by elevated Cr and Ni concentrations (Table 4). Their composition is compatible with the composition of Attic Black Gloss pottery found at Kolonna on Aegina.Footnote 10 It also matches the elemental composition of Attic origin pottery analysed by G. Schneider (Reference Schneider2000a, 530–1, table 3). Lamps of Attic origin are commonly found at Classical and Hellenistic sites across the Eastern Mediterranean.Footnote 11 Their distribution is presented in Fig. 10.
Production Group 4: (a) photographs of lamp fragments inv. nos PAP14/III/418/L2, PAP14/III/420/L1, and PAP15/III/806/L1, and (b) fresh break photomicrograph of sample PAP17/113.

The distribution of PG 4 and PG 7 in the Eastern Mediterranean.

Mean chemical composition (oxides are expressed in wt% and elements in ppm) and relative standard deviation (rsd) of PG 4 and the reference group of Attic fine wares (Schneider Reference Schneider2000a, table 3). Data normalised to 100% for PG 4. For the reference group of Attic fine wares, major elements are normalised.

Production Group 5
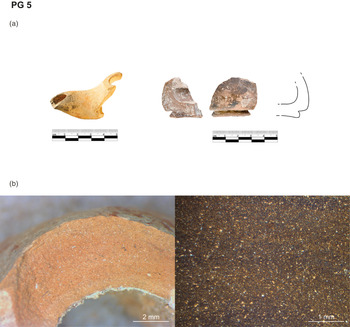
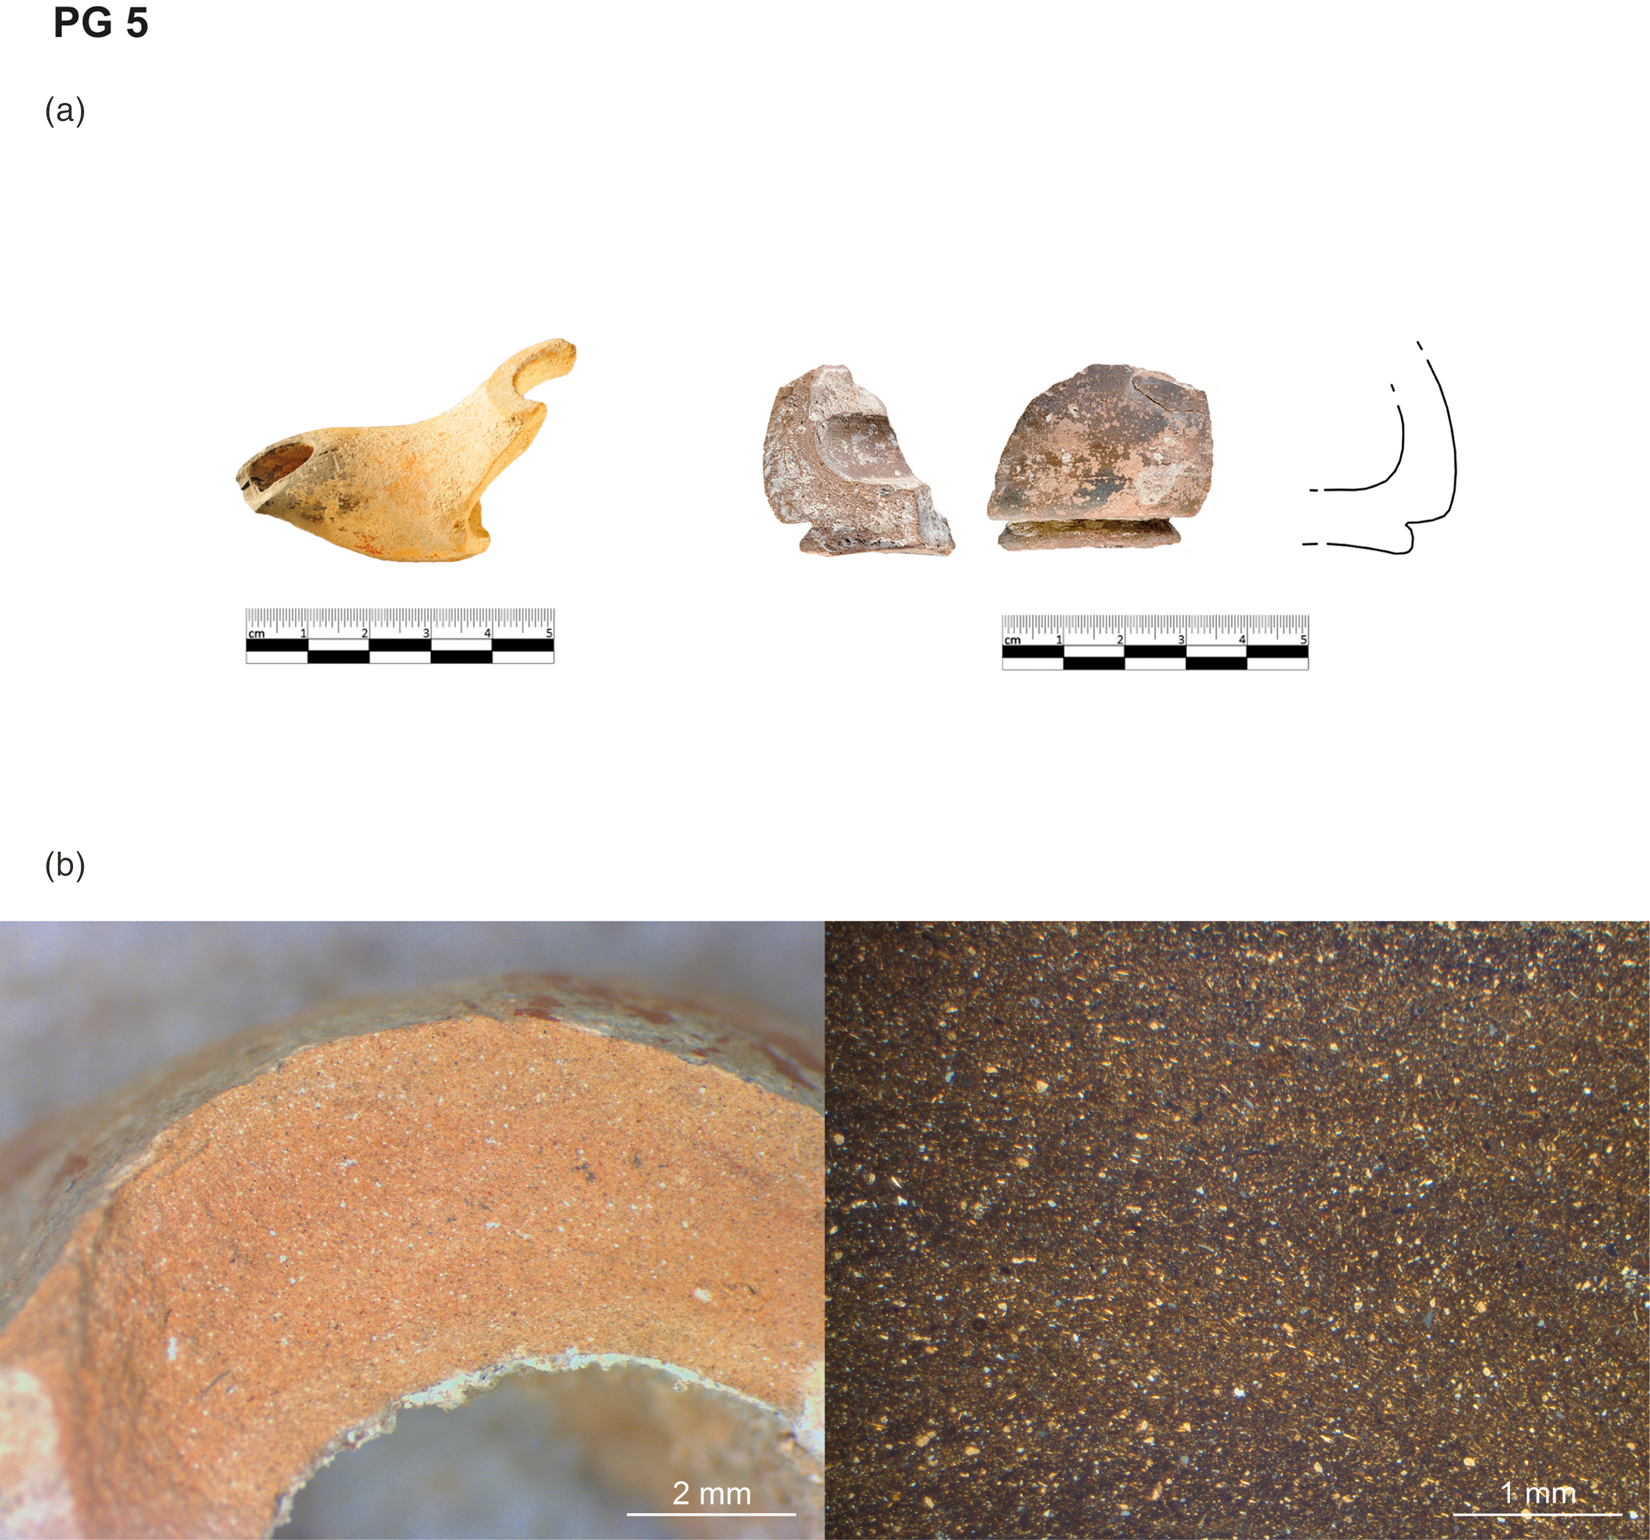
Five fragments of lamps belonging to PG 5 were identified at the Paphos Agora. No complete examples were recovered during the excavations, but the preserved fragments appear to represent wheel-made closed lamps with globular bodies in vertical section (Table A1:2). PG 5 dates from the late fourth/early third to the late third/early second century bc. The fabric and slip of these lamps (Table A4) are visually identical to a group of Early Hellenistic colour-coated ware pottery from the House of Dionysos in Nea Paphos, which had been named Standard Early Hellenistic Ware by J. Hayes (Reference Hayes1991, 27–8). This group of table ware pottery was also identified at the Paphos Agora and Maloutena, and has been investigated through refiring tests and elemental and petrographic analysis (Marzec Reference Marzec2017, 190–3, Fabric Group 2; Marzec et al. Reference Marzec, Kiriatzi, Müller and Hein2018). In order to confirm the relation between the lamps and colour-coated ware pottery, selected samples were analysed by the use of the same methodology. Four samples were subjected to refiring tests and elemental analysis, and two of them to thin section petrography (Fig. 11b, Table A3:PF5). The results indicated that the lamps and the colour-coated ware pottery belong to a single compositional (Table A2) and technological group. The fabric is fine, calcareous, and contains inclusions of quartz, feldspar, mica, chert, serpentinite and micrite, as well as opaques and textural concentration features.
Production Group 5: (a) photographs and drawing of lamp fragments inv. nos PAP15/I/668/L1 and PAP13/III/348/L8, and (b) fresh break and thin section (XPL) photomicrographs of sample PAP17/120.
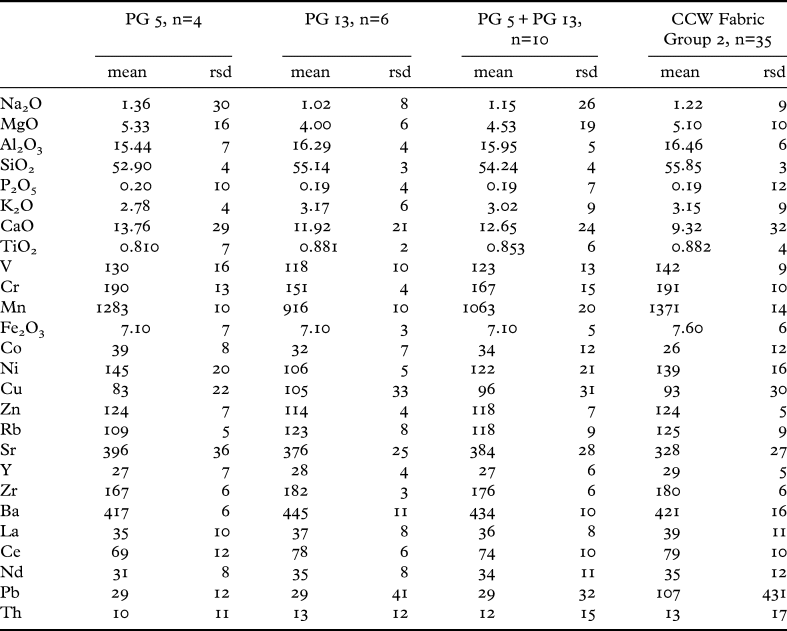
The laboratory analysis further revealed that this PG is closely related to PG 13, which includes the Early Roman mould-made closed discus lamps, and indicated a common origin for those two PGs. Despite this compositional similarity, there are differences in the size of inclusions, as well as in the forming method and the type. The Early Hellenistic lamps and pottery have slightly coarser inclusions than those produced during the Early Roman times (compare below, PG 13). The place of production of these groups of lamps and pottery is unknown. It has previously been suggested that these could have been produced somewhere on Cyprus or in the Levant (Marzec Reference Marzec2017, 190–3; Marzec et al. Reference Marzec, Kiriatzi, Müller and Hein2018). S. Élaigne proposed Kition on Cyprus as a potential place of production of this group of pottery (Élaigne and Lemaître Reference Élaigne and Lemaître2014). The above colour-coated ware pottery group has been identified at several sites (Salles Reference Salles1993, 167–8; Slane Reference Slane and Herbert1997, 359–62, Fabric A; Schneider Reference Schneider2000a, 534; Picon and Blondé Reference Picon and Blondé2002, 15, Group A; Élaigne Reference Élaigne2007, 120–2; Reference Élaigne2012, 148–53; Berlin and Stone Reference Berlin, Stone, Hartal, Syon, Stern and Tatcher2016, 140), and its distribution across Cyprus, the Levant and North Africa has already been discussed (Marzec Reference Marzec2017, 190–3; Marzec et al. Reference Marzec, Kiriatzi, Müller and Hein2018). However, the distribution pattern of the associated lamps (present PG 5) is unknown, since they have not been identified as a separate group, nor as linked to the colour-coated ware repertoire.Footnote 12 Aside from the Paphos Agora (Kajzer Reference Kajzer2019, 100; Reference Kajzer2020, 287, Macroscopic Group 6), the lamps attributed to PG 5 have been identified only at Fabrika Hill in Paphos (Kajzer Reference Kajzer2019, 100).
Production Group 6
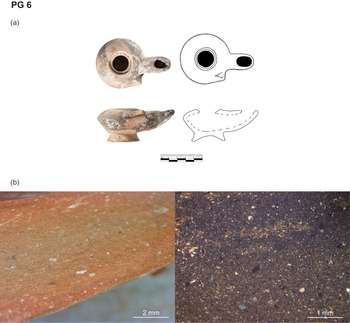
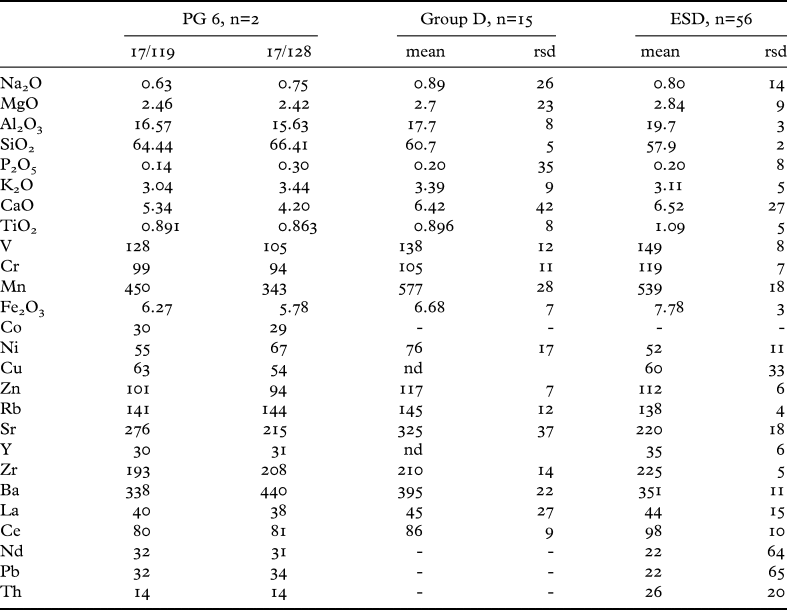
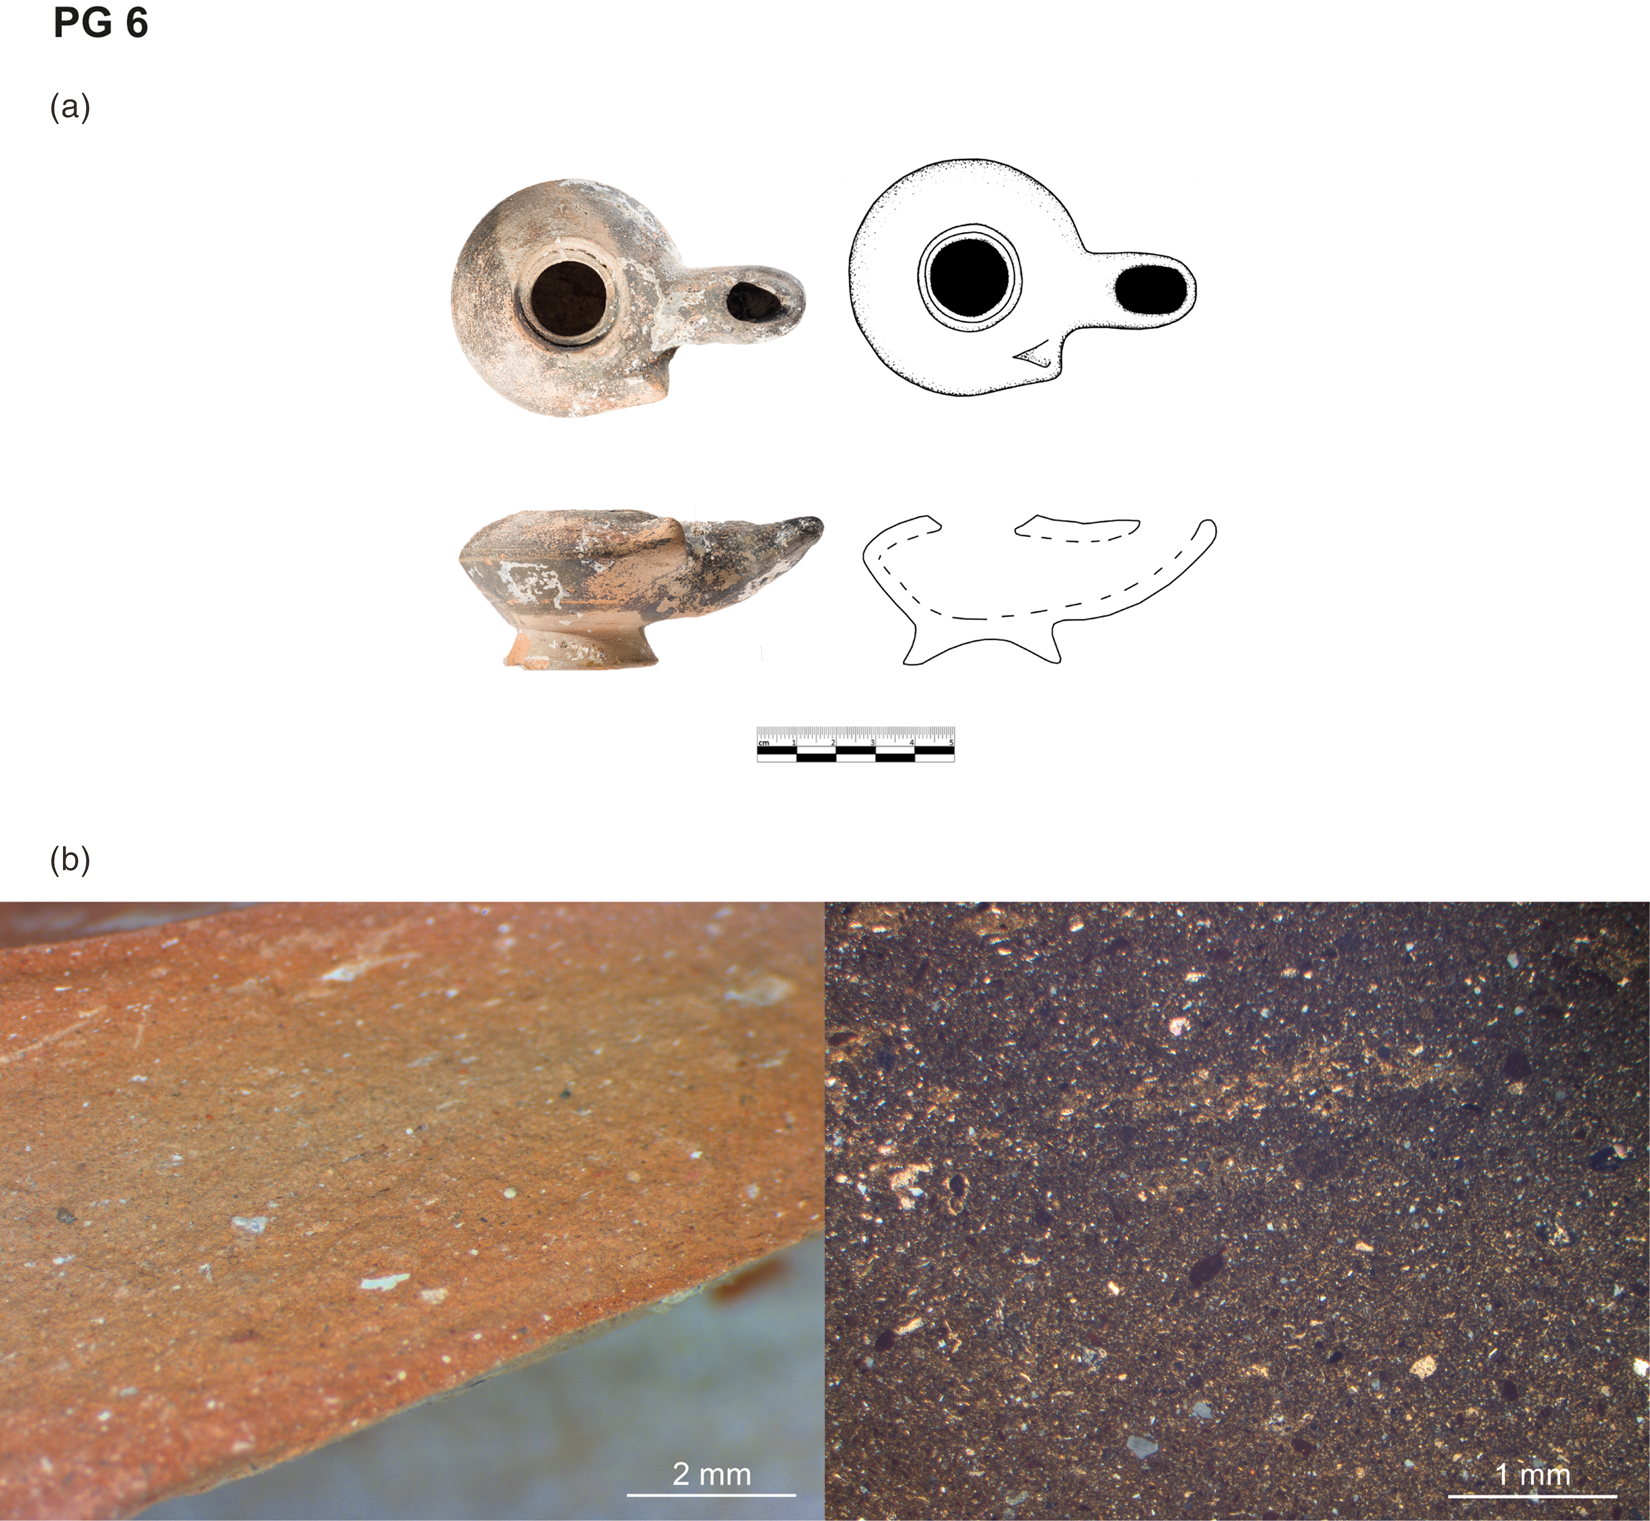
PG 6 includes seven wheel-made closed lamps with biconical bodies in vertical section (Table A1:3). These lamps can be additionally characterised by the presence of flattened, long nozzles and elongated side lugs. The typology and stratigraphy suggest that they occurred in Nea Paphos between the mid-third and mid-second centuries bc. The appearance of their fabric, which is fine, hard and red (Table A4), is reminiscent of a group of Early Hellenistic colour-coated ware plates and bowls identified among the material from the Paphos Agora excavations (Marzec Reference Marzec2017, 196–7, Fabric Group 4). Two samples of PG 6 (Table A5, Fig. 5) selected for laboratory analysis were also found to be similar to the above group of colour-coated pottery in terms of mineralogical and elemental compositions. Thin section analysis revealed that their fabric is fine and contains monocrystalline quartz, feldspar, mica, textural concentration features, micrite and sparite, opaques, polycrystalline quartz, microfossils and serpentinite (Fig. 12b, Table A3:PF4). The elemental composition of this group is characterised by high SiO2, medium CaO as well as relatively low Cr and Ni concentrations (Tables 5 and A2). This elemental composition is similar to Group D from Nea Paphos, Amathus and Kition analysed through WD-XRF by M. Picon and F. Blondé (Reference Picon and Blondé2002, 14–15) (Table 5). They noticed that the composition of Group D is similar to ‘des sigillées chypriotes tardives’,Footnote 13 interpreted as a continuation of the Cypriot Sigillata (or Eastern Sigillata D) of Late Hellenistic to Early Roman date, due to the similarities in their chemical composition (Meyza Reference Meyza2007, 17–20). The results of scientific analyses (Meyza Reference Meyza2002; Lund Reference Lund2015, 166–8; Bes Reference Bes2015, 19–20; Renson et al. Reference Renson, Slane, Rautman, Kidd, Guthrie and Glascock2016, 62–4; Hammond et al. Reference Hammond, Gabrieli, Ferguson, Glascock and Wismann2018, 118–19), as well as the abundance of these wares on the island, led to their being considered of Cypriot provenance.Footnote 14 Based on the evidence available so far, it is not possible to suggest a specific production location for PG 6. Its compositional profile, however, is not incompatible with an origin in Cyprus as its above associations seem to indicate. Moreover, S. Élaigne has argued that Group D corresponds to production 1 at Beirut (Élaigne Reference Élaigne2007, 120) and Chypre 3 at Alexandria (Élaigne Reference Élaigne2012, 158–62) and also suggested a Cypriot origin for these groups (Élaigne Reference Élaigne2007, 120; Reference Élaigne2012, 159).
Production Group 6: (a) photograph and drawing of lamp inv. no. PAP16/I/969/L1 and (b) fresh break and thin section (XPL) photomicrographs of sample PAP17/119.
Compositions (oxides are expressed in wt% and elements in ppm) of two samples classified to PG 6 and mean chemical composition and relative standard deviation (rsd) of Group D of colour coated ware pottery (Picon and Blondé Reference Picon and Blondé2002) and Eastern Sigillata D/Cypriot Sigillata (ESD/CS) (Schneider Reference Schneider2000a, table 3). Data normalised to 100% for PG 6. For the reference group of Eastern Sigillata D, major elements are normalised.

Apart from the Agora, the lamps attributed to PG 6 are known from other excavations in Nea Paphos, such as Fabrika Hill, the Theatre, the Sanctuary at Toumballos and the House of Dionysos (Kajzer Reference Kajzer2019, 136). Again, due to the lack of publications presenting lamp fabrics, it is not possible to discuss further the distribution pattern of PG 6.
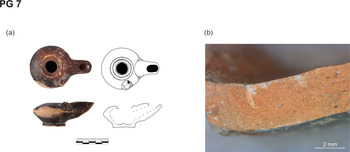
Production Group 7
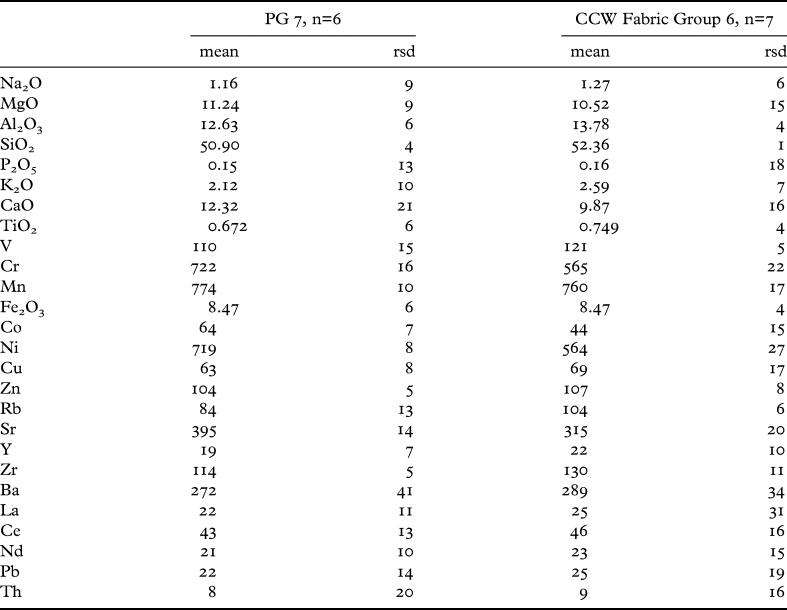
PG 7 is composed of 26 wheel-made closed lamps with biconical bodies in vertical section (Table A1:3), and pierced side lugs, with narrow depressions around the filling holes,Footnote 15 relatively high cut feet, and nozzles clearly separated from the bodies. These morphological features suggest that they date between the mid-third and early second centuries bc.Footnote 16 Their pinkish, hard fabric covered with semi-lustrous slip (Fig. 13, Table A4) corresponds with the so-called colour-coated Ware A pottery, which was previously assumed to have been produced on Rhodes (Hayes Reference Hayes1991, 23–4; Élaigne Reference Élaigne2002, 161–3, 165, fig. 5; Domżalski Reference Domżalski, Gabrielsen and Lund2007, 172–3; Marzec Reference Marzec2017, 201). Six samples of PG 7 (Fig. 5, Table A5) were subjected to scientific analysis in order to further characterise this group and investigate the above association. The results of refiring tests and elemental analysis indicate that all samples form a coherent group. Their elemental composition (Table 6), characterised by high MgO, Cr, Ni and CaO concentrations, is compatible with the composition of colour-coated Ware A cups, bowls and plates recovered in Paphos for which a Rhodian provenance has been suggested (Marzec Reference Marzec2017, 201–2, Fabric Group 6). Importantly, they also match the composition of Hellenistic fine ware found on Rhodes itself, which have recently been analysed in the framework of ‘The Rhodes Centennial Project’ (Saxo Institute/University of Copenhagen and Ephorate of Antiquities of the Dodecanese).Footnote 17 It should be mentioned that a group of Late Roman lamps pinpointed to Rhodes on the basis of neutron activation analysis is also characterised by high Cr, Ni and Ca contents (Hein and Kilikoglou Reference Hein and Kilikoglou2017, 652, table 2).
Production Group 7: (a) photograph and drawing of lamp inv. no. PAP12/II/179/L1 and (b) fresh break photomicrograph of sample PAP17/117.

Mean chemical composition (oxides are expressed in wt% and elements in ppm) and relative standard deviation (rsd) of PG 7 and colour coated pottery Fabric Group 6 (Marzec Reference Marzec2017). Data normalised to 100%.

The presence of the Rhodian lamps, beyond the island of their origin (Blinkenberg Reference Blinkenberg1931, 744, nos 3201–2, pl. 151; Bailey Reference Bailey1975, 160, 163; Sørensen and Pentz Reference Sørensen and Pentz1992, 82, no. C2, fig. 63) was also noted in a number of other sites in the Eastern Mediterranean (Fig. 10).Footnote 18
Production Group 8
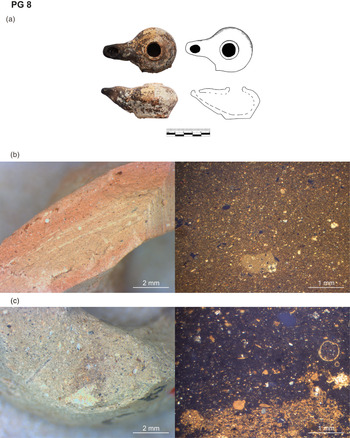
This PG consists of 34 wheel-made closed lamps classified into three different types, with either globular (Table A1:2), biconical (Table A1:3) or piriform (Table A1:4) bodies in vertical section. Additionally, each type shows internal variability in shape and surface treatment. The differences are in the shape of the bases and side lugs, which can be pierced or non-pierced, if they appeared. The lamps assigned to this PG were found in the Hellenistic layers, spanning in date from the early third to the second half of the second century bc.Footnote 19 The examination of the fresh breaks (Fig. 14ab, Table A4) suggested that PG 8 is related to PG 2 and PG 10, as well as to local colour-coated ware pottery, due to the similarities in types of inclusions, surface treatment, colour and texture of the fresh break.
Production Group 8: (a) photograph and drawing of lamp inv. no. PAP14/II/286/L1. Fresh break and thin section (XPL) photomicrographs of samples (b) PAP17/124 and (c) PAP17/131.
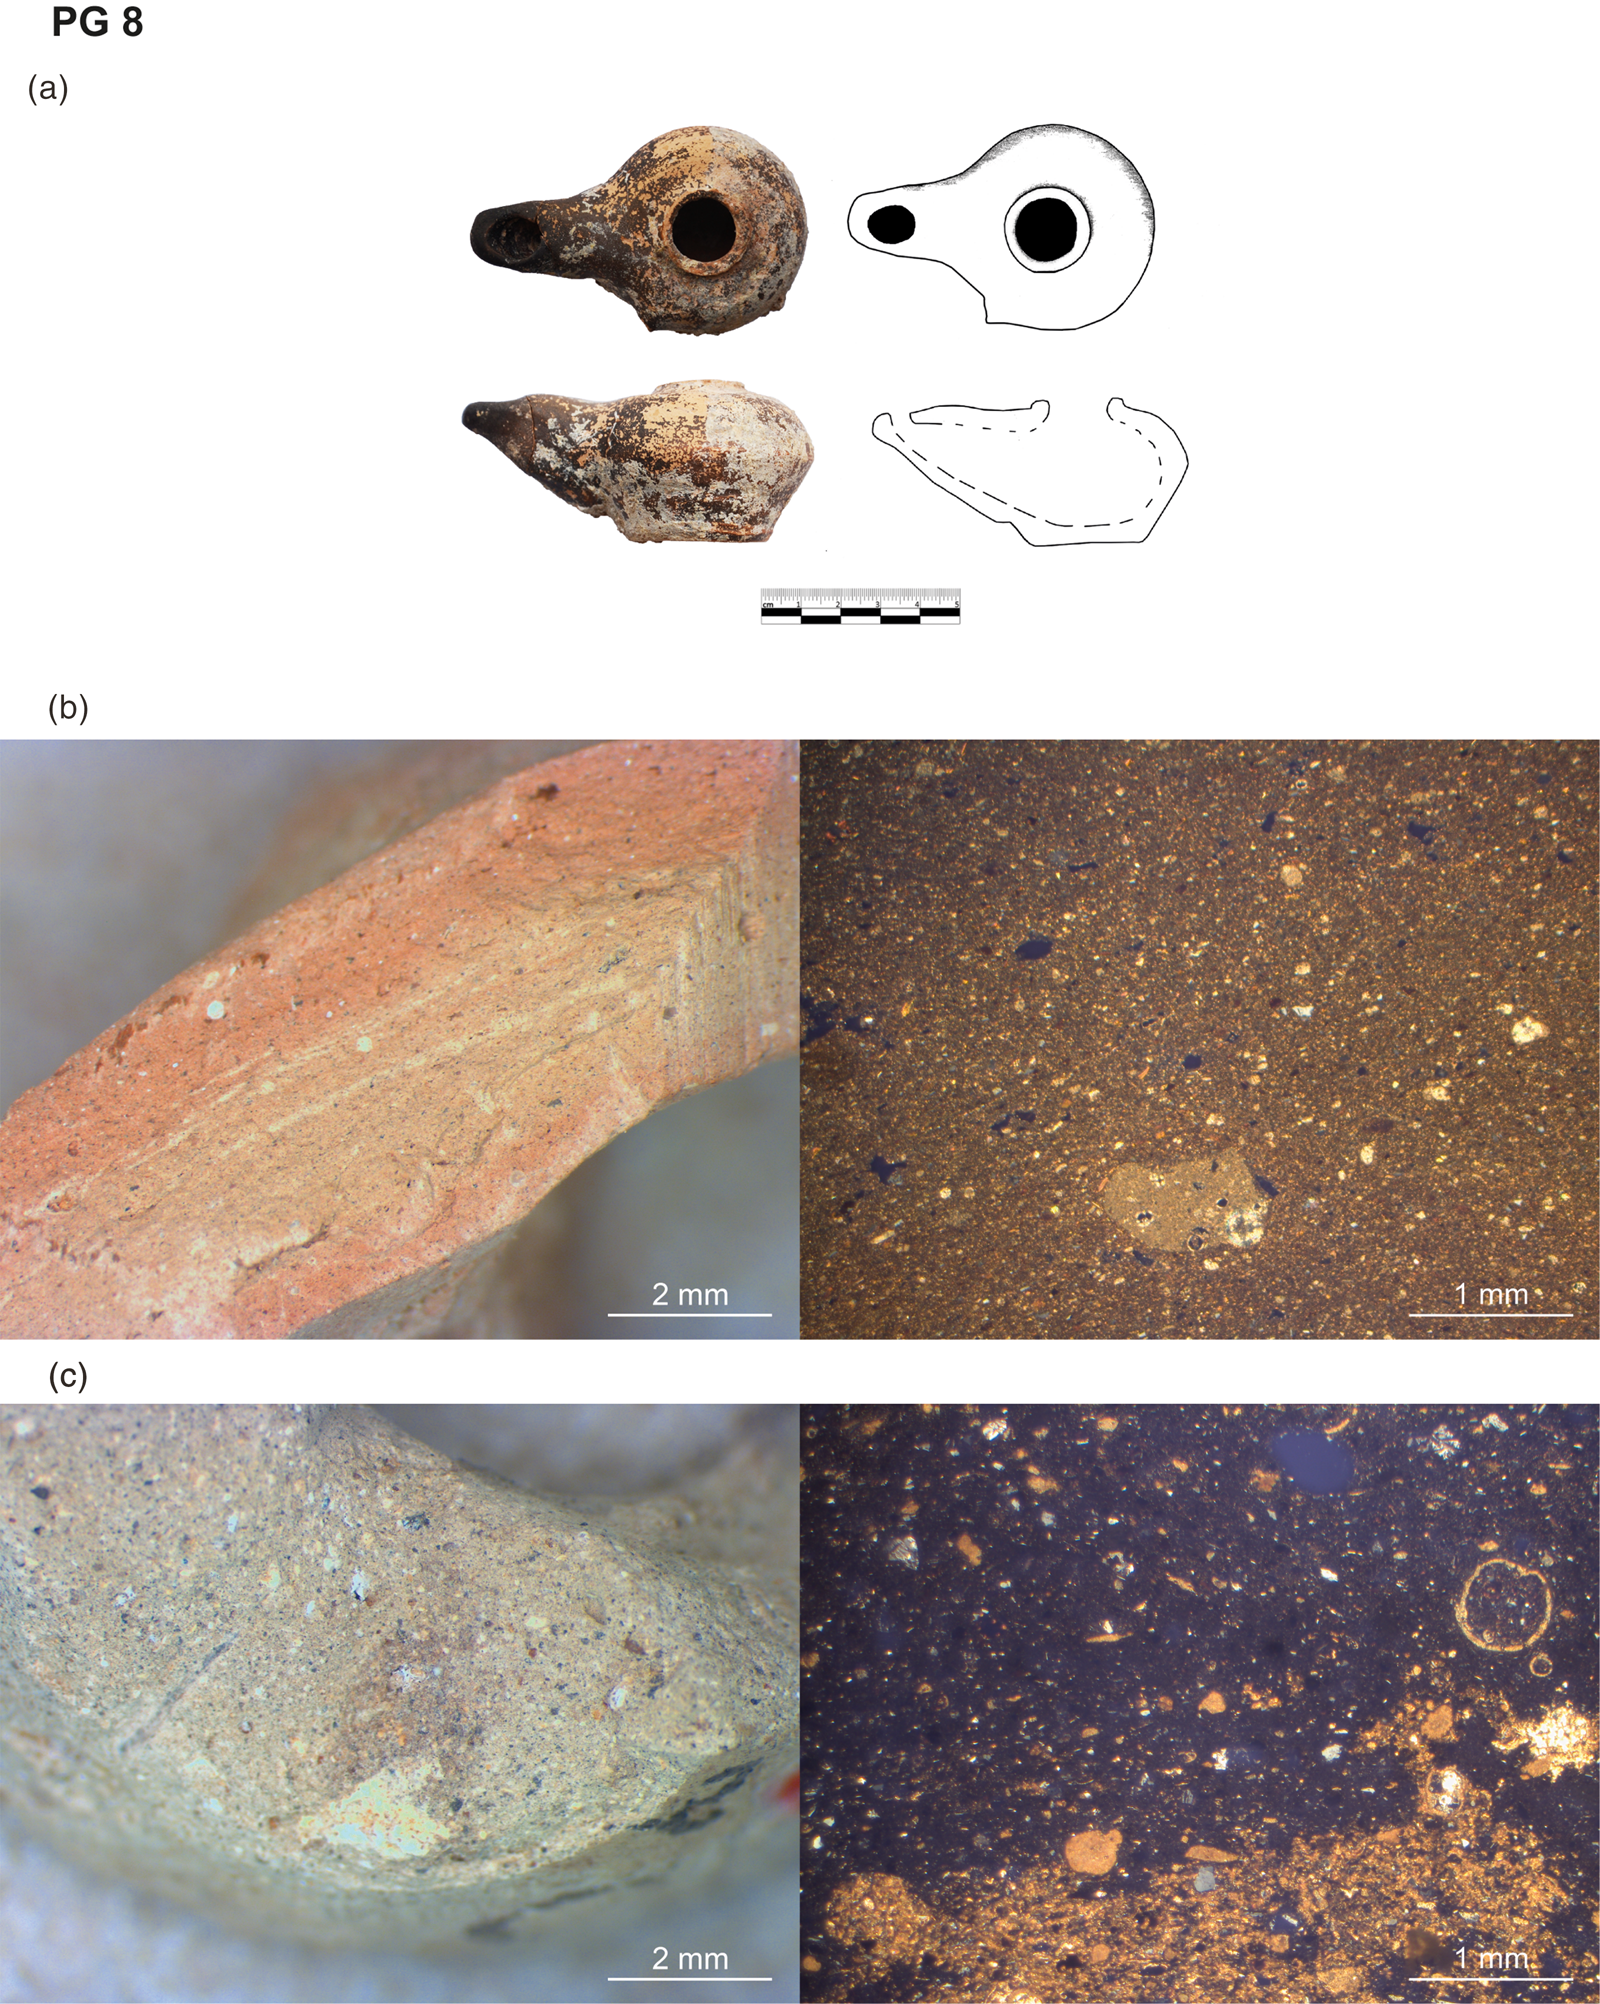
Four samples (Table A5, Fig. 5) of this PG were selected for scientific analysis, covering all three types. WD-XRF results indicated that they have similar elemental composition, characterised by high CaO content (Tables 2 and A2). The examination of the thin sections suggested that all of them should be classified to PF 2B, which has the same mineralogical composition as PF 2D (PG 2), and the difference between them is mostly related to the size, distribution and frequency of the inclusions (Table A3). The relation between PG 2 and PG 8 is also reflected in similarities in elemental composition (Table 2) and is illustrated on the PCA plot (Fig. 3). The samples representing both PGs appear close to each other in the upper right side of the scatterplot. Moreover, the elemental (Table 2) and mineralogical composition of PG 8 is related to the composition of a group of colour-coated ware pottery which is associated with local production (Marzec Reference Marzec2017, 183–9, Fabric Group 1; Marzec et al. Reference Marzec, Kiriatzi, Müller and Hein2019). For these reasons, PG 8 is considered as local to Paphos.
The lamps of PG 8 were identified not only at the Agora (Kajzer Reference Kajzer2019, 99; Reference Kajzer2020, 286, Macroscopic Group 5), but also in other areas of the city, including Maloutena (Młynarczyk Reference Młynarczyk1978, 238–40; Reference Młynarczyk, Daszewski and Meyza1998, 55), the Theatre, Fabrika Hill, and the Sanctuary at Toumballos (Kajzer Reference Kajzer2019, 99). It is possible that they were also distributed beyond the city, but due to the lack of published fabric descriptions for lamps, their distribution beyond Nea Paphos cannot be mapped.
Production Group 9
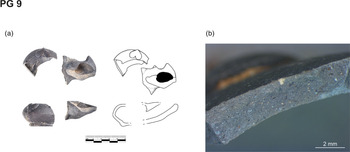
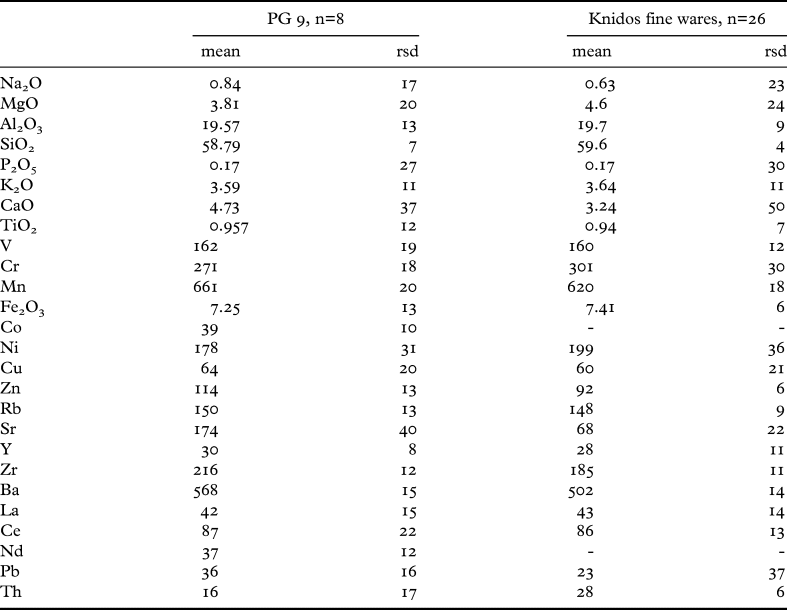
This PG includes 28 wheel-made closed lamps with biconical bodies in vertical section and moulded decoration on their shoulders (Table A1:5). They have fan-shaped massive nozzles and high, double loop handles with horizontal bands of clay in their upper parts.Footnote 20 The lamps have small filling holes surrounded by deep depressions, sloping shoulders, and cut feet with central bulges.Footnote 21 The moulded decoration frequently presents ornamentation of ivy leaves, typically associated with Knidian origin. This type was produced in Knidos from the second half of the second century bc until the beginning of the first century ad (Kögler Reference Kögler, Briese and Vaag2005, 56; Pastutmaz Sevmen Reference Pastutmaz Sevmen and Bruns Özgan2013, 201–2). All lamps classified to this PG are characterised by a hard grey fabric with white and sparkling inclusions (Fig. 15, Table A4), also compatible with Knidian origin (Kögler Reference Kögler2011). Also, the elemental composition of eight samples (Tables A2 and A5, Fig. 5) classified into this PG supports a Knidian provenance for those samples, as it matches well with reference patterns of pottery from Knidos (Schneider Reference Schneider2000a, 530–1, table 3), which is characterised by low CaO, moderate Cr, and somewhat elevated K2O and TiO2 concentrations (Table 7).
Production Group 9: (a) photograph and drawing of lamp fragments inv. no. PAP16/II/1222/L9 and (b) fresh break photomicrograph of sample PAP17/138.

Mean chemical composition (oxides are expressed in wt% and elements in ppm) and relative standard deviation (rsd) of PG 9 and the reference group of pottery from Knidos (Schneider Reference Schneider2000a, table 3). Data normalised to 100% for PG 9. For the reference group of pottery from Knidos, major elements are normalised.

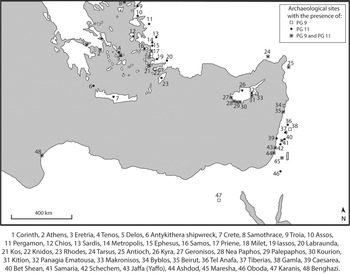
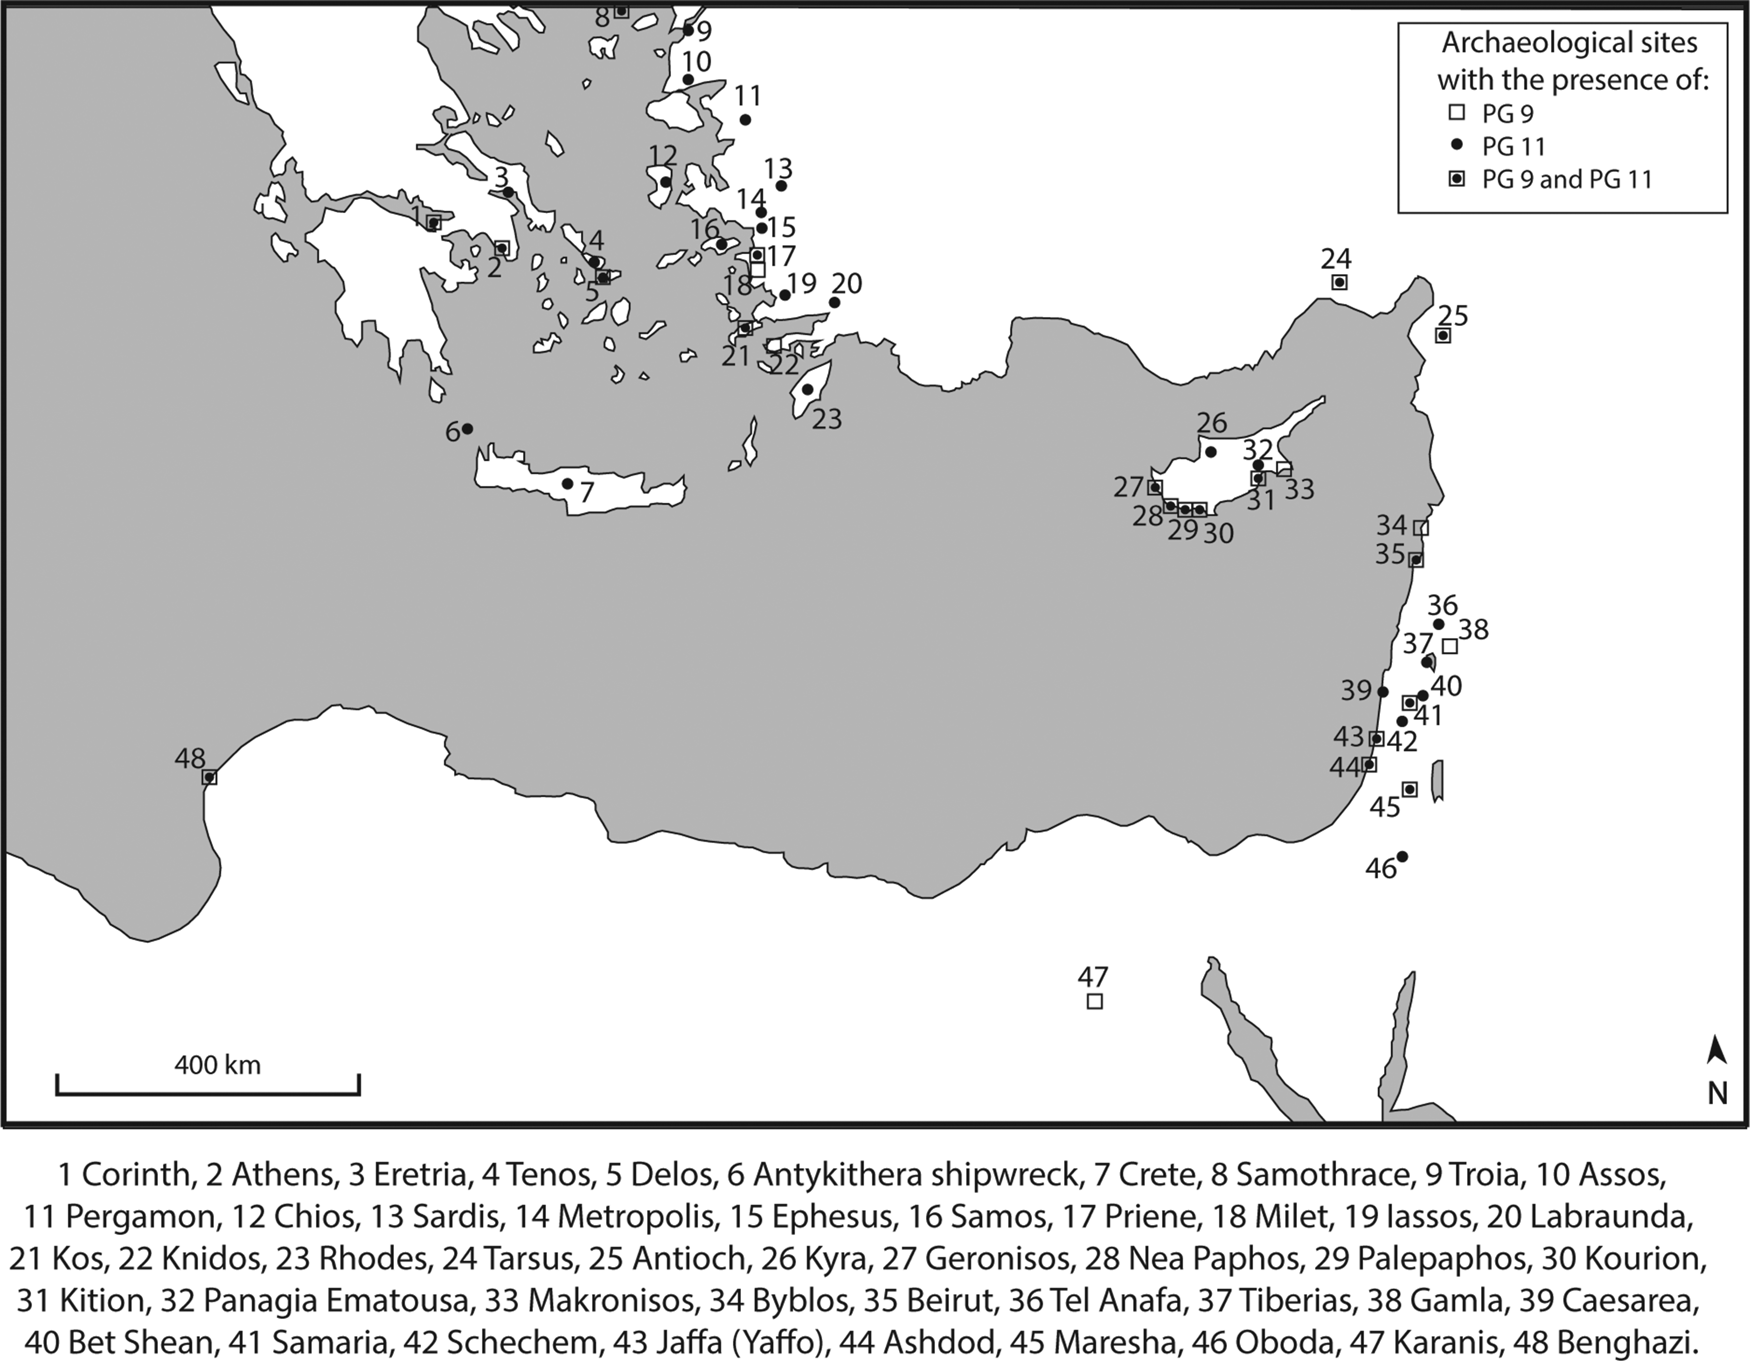
Knidian lamps with moulded decoration were widely distributed throughout the Eastern Mediterranean during the Late Hellenistic period (Fig. 16), more specifically from the second half of the second to the beginning of the first century bc (Howland Reference Howland1958, 126–7; Bruneau Reference Bruneau1965, 33).Footnote 22 Bailey (Reference Bailey1985b, 196) suggested that the distribution of these lamps declined around 75 bc due to intense piracy in the Mediterranean; however, according to recent studies this argument is disputable (Kögler Reference Kögler, Briese and Vaag2005, 56).
The distribution of PG 9 and PG 11 in the Eastern Mediterranean.
Mould-made closed lamps
Production Group 10
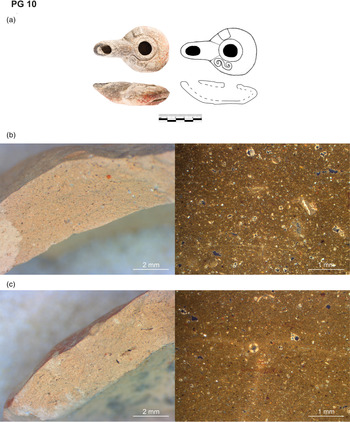
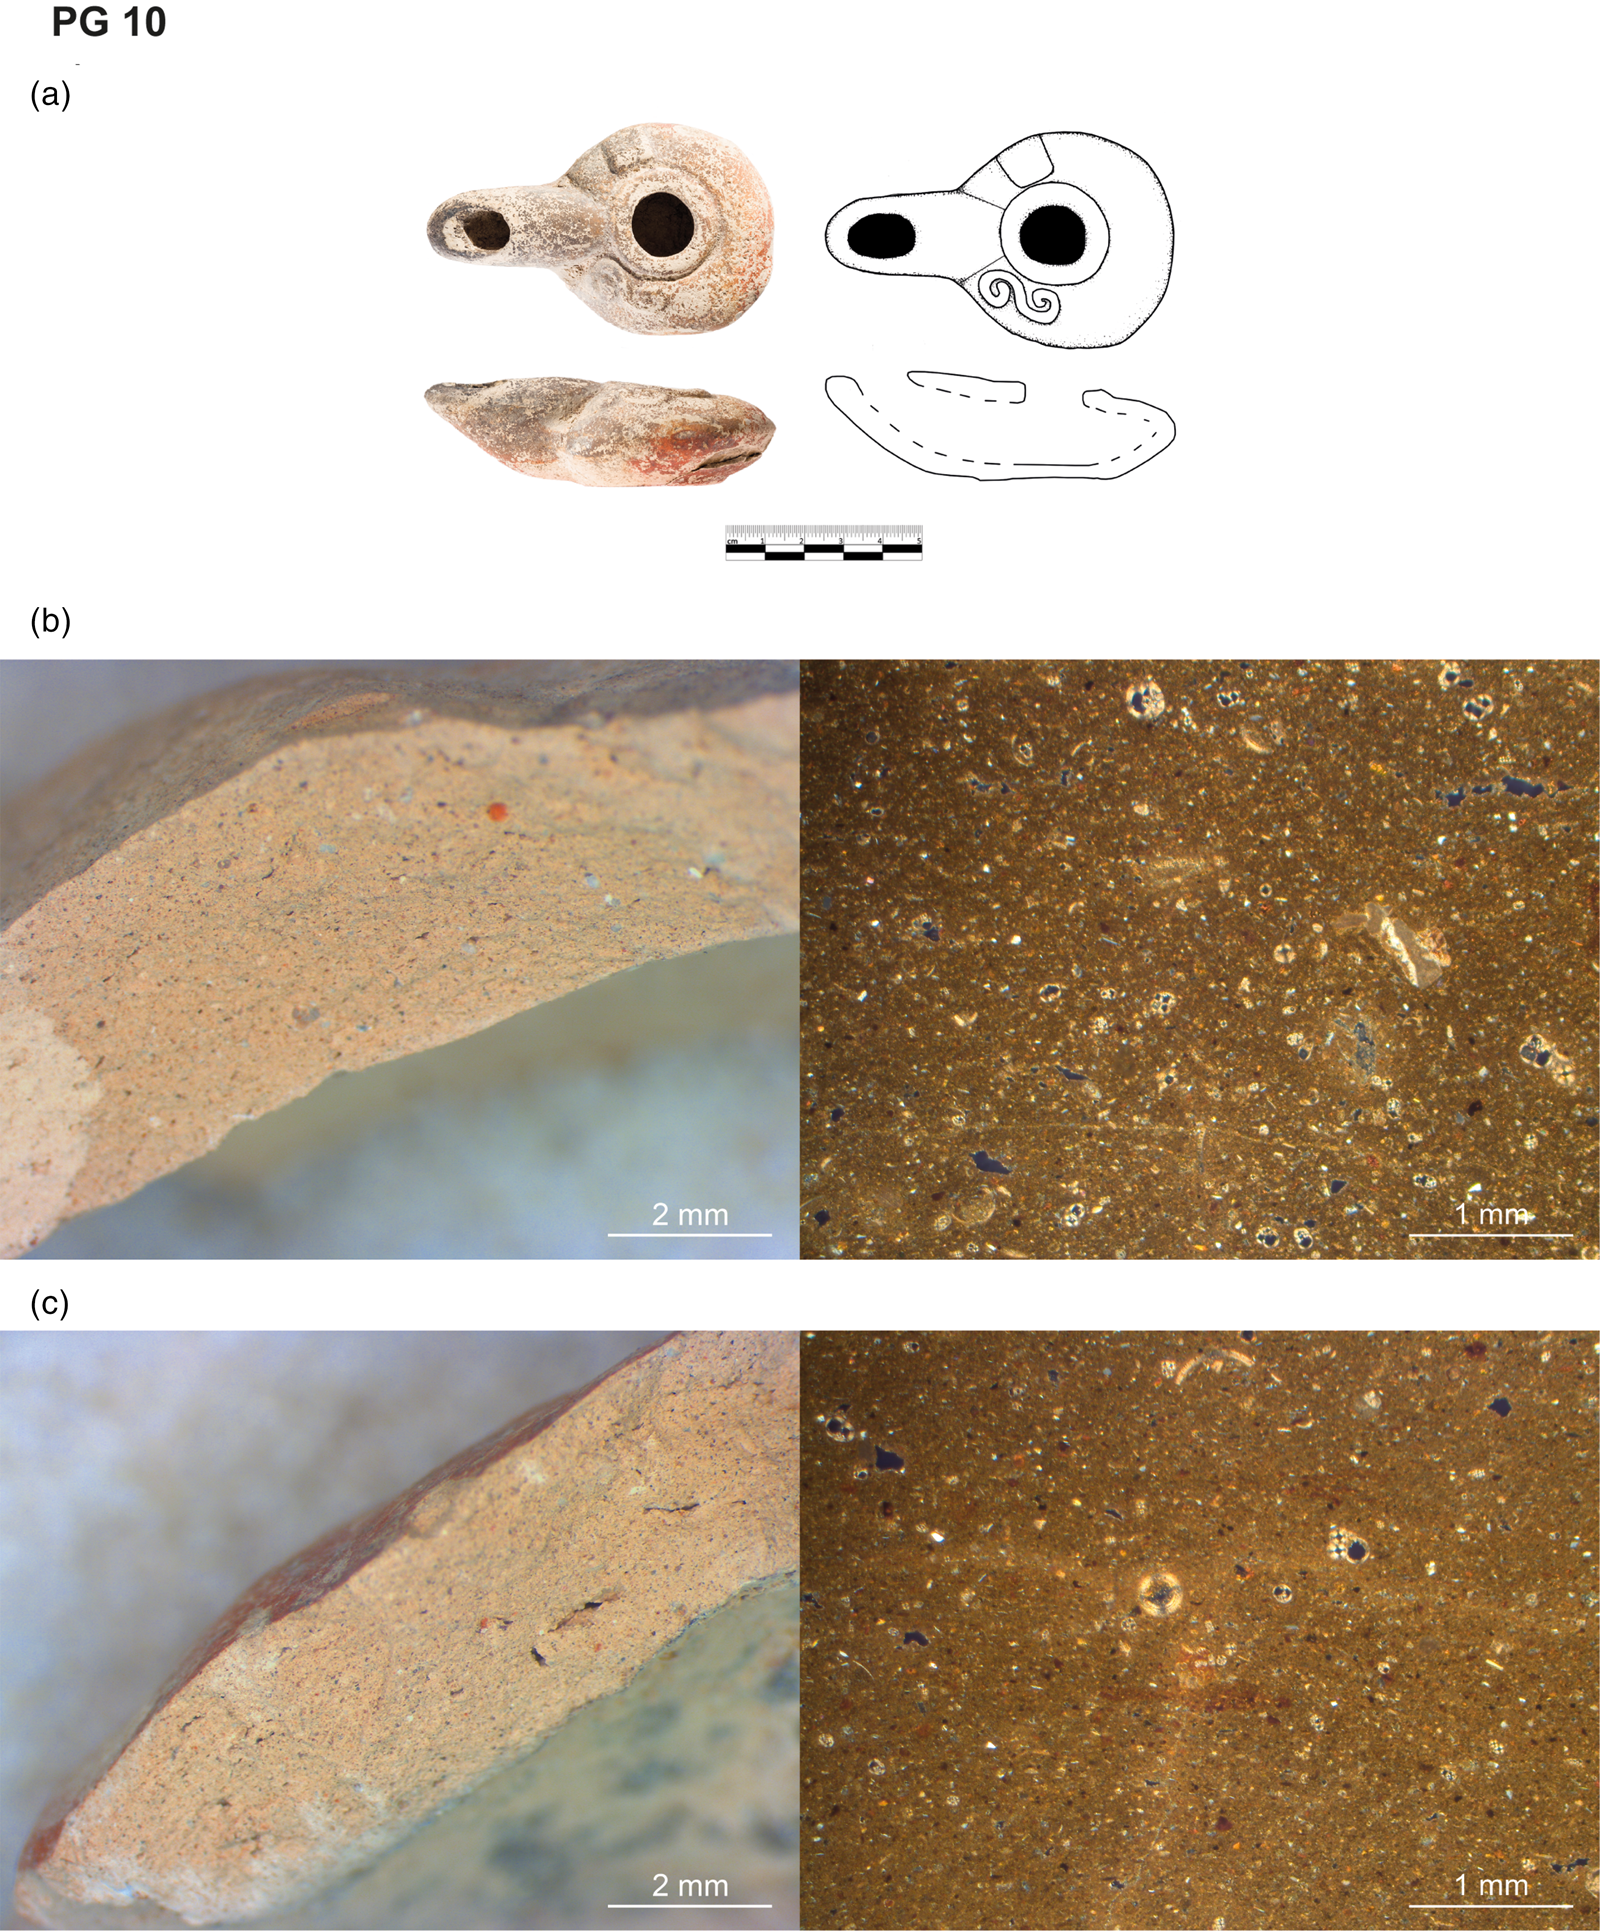
This is the largest PG (114 lamps) in the Hellenistic assemblage of the Paphos Agora. It is a homogeneous group in terms of shape, chronology and fabric. All lamps of this PG belong to the same type, characterised by rounded bodies in horizontal section and with floral or geometric decoration. The ends of the nozzles are usually rounded. But there are also examples with triangular nozzles, typical for Ephesian lamps (compare PG 11). This type can be divided into two variants due to different upper surface decoration.Footnote 23 The first variant is decorated with single geometric and/or floral applications flanking both sides of the body (Table A1:6). The second has shoulders covered with continuous ornament, such as rays, wave scroll or net, while the top of the nozzle is frequently adorned with a floral motif of rosette, palmette or leaves (Table A1:7). Both variants are typical for lamps of Late Hellenistic date. More specifically, the context chronology and the comparable examples from Maloutena (Młynarczyk Reference Młynarczyk, Daszewski and Meyza1998, 56) suggest that this type dates between the second half of the second century and the mid-first century bc or slightly later. The fabric of the PG 10 lamps is soft, and their surfaces have a smooth or powdery feel (Table A4). Macroscopic examination suggested that the fabric is related to that of PG 8, and they can be distinguished due to the different feel of the surface and texture of the fresh break. Macroscopically, it seems also to be related to a dominant group of colour-coated ware pottery from the Paphos Agora (Marzec Reference Marzec2017, 183–9, Fabric Group 1; Marzec et al. Reference Marzec, Kiriatzi, Müller and Hein2019) and to pink powdery ware lamps and table pottery known from the excavations on Geronisos Island (Connelly and Młynarczyk Reference Connelly and Młynarczyk2002, 295; Młynarczyk Reference Młynarczyk2005; Reference Młynarczyk, Michaelides, Kassianidou and Merrillees2009, 212–14; Lund Reference Lund2015, 118–19). J. Młynarczyk (Reference Młynarczyk2005; Reference Młynarczyk, Michaelides, Kassianidou and Merrillees2009, 212–14) suggested that these lamps were produced in western Cyprus.
Six samples (Table A5, Fig. 5) were selected from this PG and were subjected to refiring tests, and elemental and petrographic analysis. The results indicated that they form a very homogeneous group in all respects (see Table A2 for their elemental composition). All analysed samples are highly calcareous (c. 24% CaO), and comparable to PG 8 and PG 2 samples (Table 2). The petrographic analysis revealed that the fabric is very fine and dominated by microfossils (Fig. 17bc, Table A3:PF2A). In terms of both elemental and mineralogical composition, PG 10 is related to PG 2 and PG 8, discussed above, considered as local to the site. This relation is illustrated on the PCA scatterplot (Fig. 3).
Production Group 10: (a) photograph and drawing of lamp inv. no. PAP16/I/972/L1. Fresh break and thin section (XPL) photomicrographs of samples (b) PAP17/149 and (c) PAP17/152.
Currently, it is not possible to trace the distribution of PG 10 lamps beyond Nea Paphos, due to the lack of published fabric descriptions. In the area of the city, they were identified also in the Theatre, Fabrika Hill, the Sanctuary at Toumballos, the House of Orpheus and the House of Dionysos (Kajzer Reference Kajzer2019, 115), as well as at Maloutena (Młynarczyk Reference Młynarczyk1978, 238–40; Reference Młynarczyk, Daszewski and Meyza1998, 55).
Production Group 11
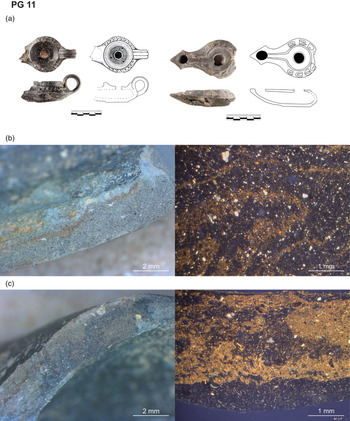
Thirty mould-made lamps, classified into two types, form PG 11 (Table A1:8,9). Both types are characterised by rounded bodies in horizontal section, flattened nozzles with rounded or triangular tips, wide shoulder zones bearing floral (e.g. leaves) or geometric (e.g. globules, rhombuses and volutes) decoration, and ribbon, grooved handles. The lamps can be divided into two types due to different appearance in the upper surface of the body. The first type (Table A1:8, Fig. 18a, on the right) has a channel between a filling hole area and a wick hole. The second (Table A1:9, Fig. 18a, on the left), which is more common, is equipped with a flaring collar around the filling hole. The latter often has additional holes on the flattened surface around the central hole.Footnote 24 The published analogies indicate that production of both types spans in date between the last quarter of the second century bc and the beginning of the first century ad (Howland Reference Howland1958, 166–9; Bruneau Reference Bruneau1965, 53; Bailey Reference Bailey1975, 90; Giuliani Reference Giuliani, Roman and Gudea2008, 93; Reference Giuliani2011, 537; Sussman Reference Sussman2009, 70), with the distribution most widespread in the first century bc (Giuliani Reference Giuliani2011, 538). At the Paphos Agora, these lamps occur in Late Hellenistic contexts, dating from the second half of the second to the first century bc and in layers including chronologically mixed material, dated between the late second century bc and the beginning of the first century ad. The presence of the lamps in the latter leaves an uncertainty about the end of their occurrence in Nea Paphos.
Production Group 11: (a) photographs and drawings of lamps inv. nos PAP14/II/254/L1 and PAP15/II/750/L1. Fresh break and thin section (XPL) photomicrographs of samples (b) PAP17/143 and (c) PAP17/145.
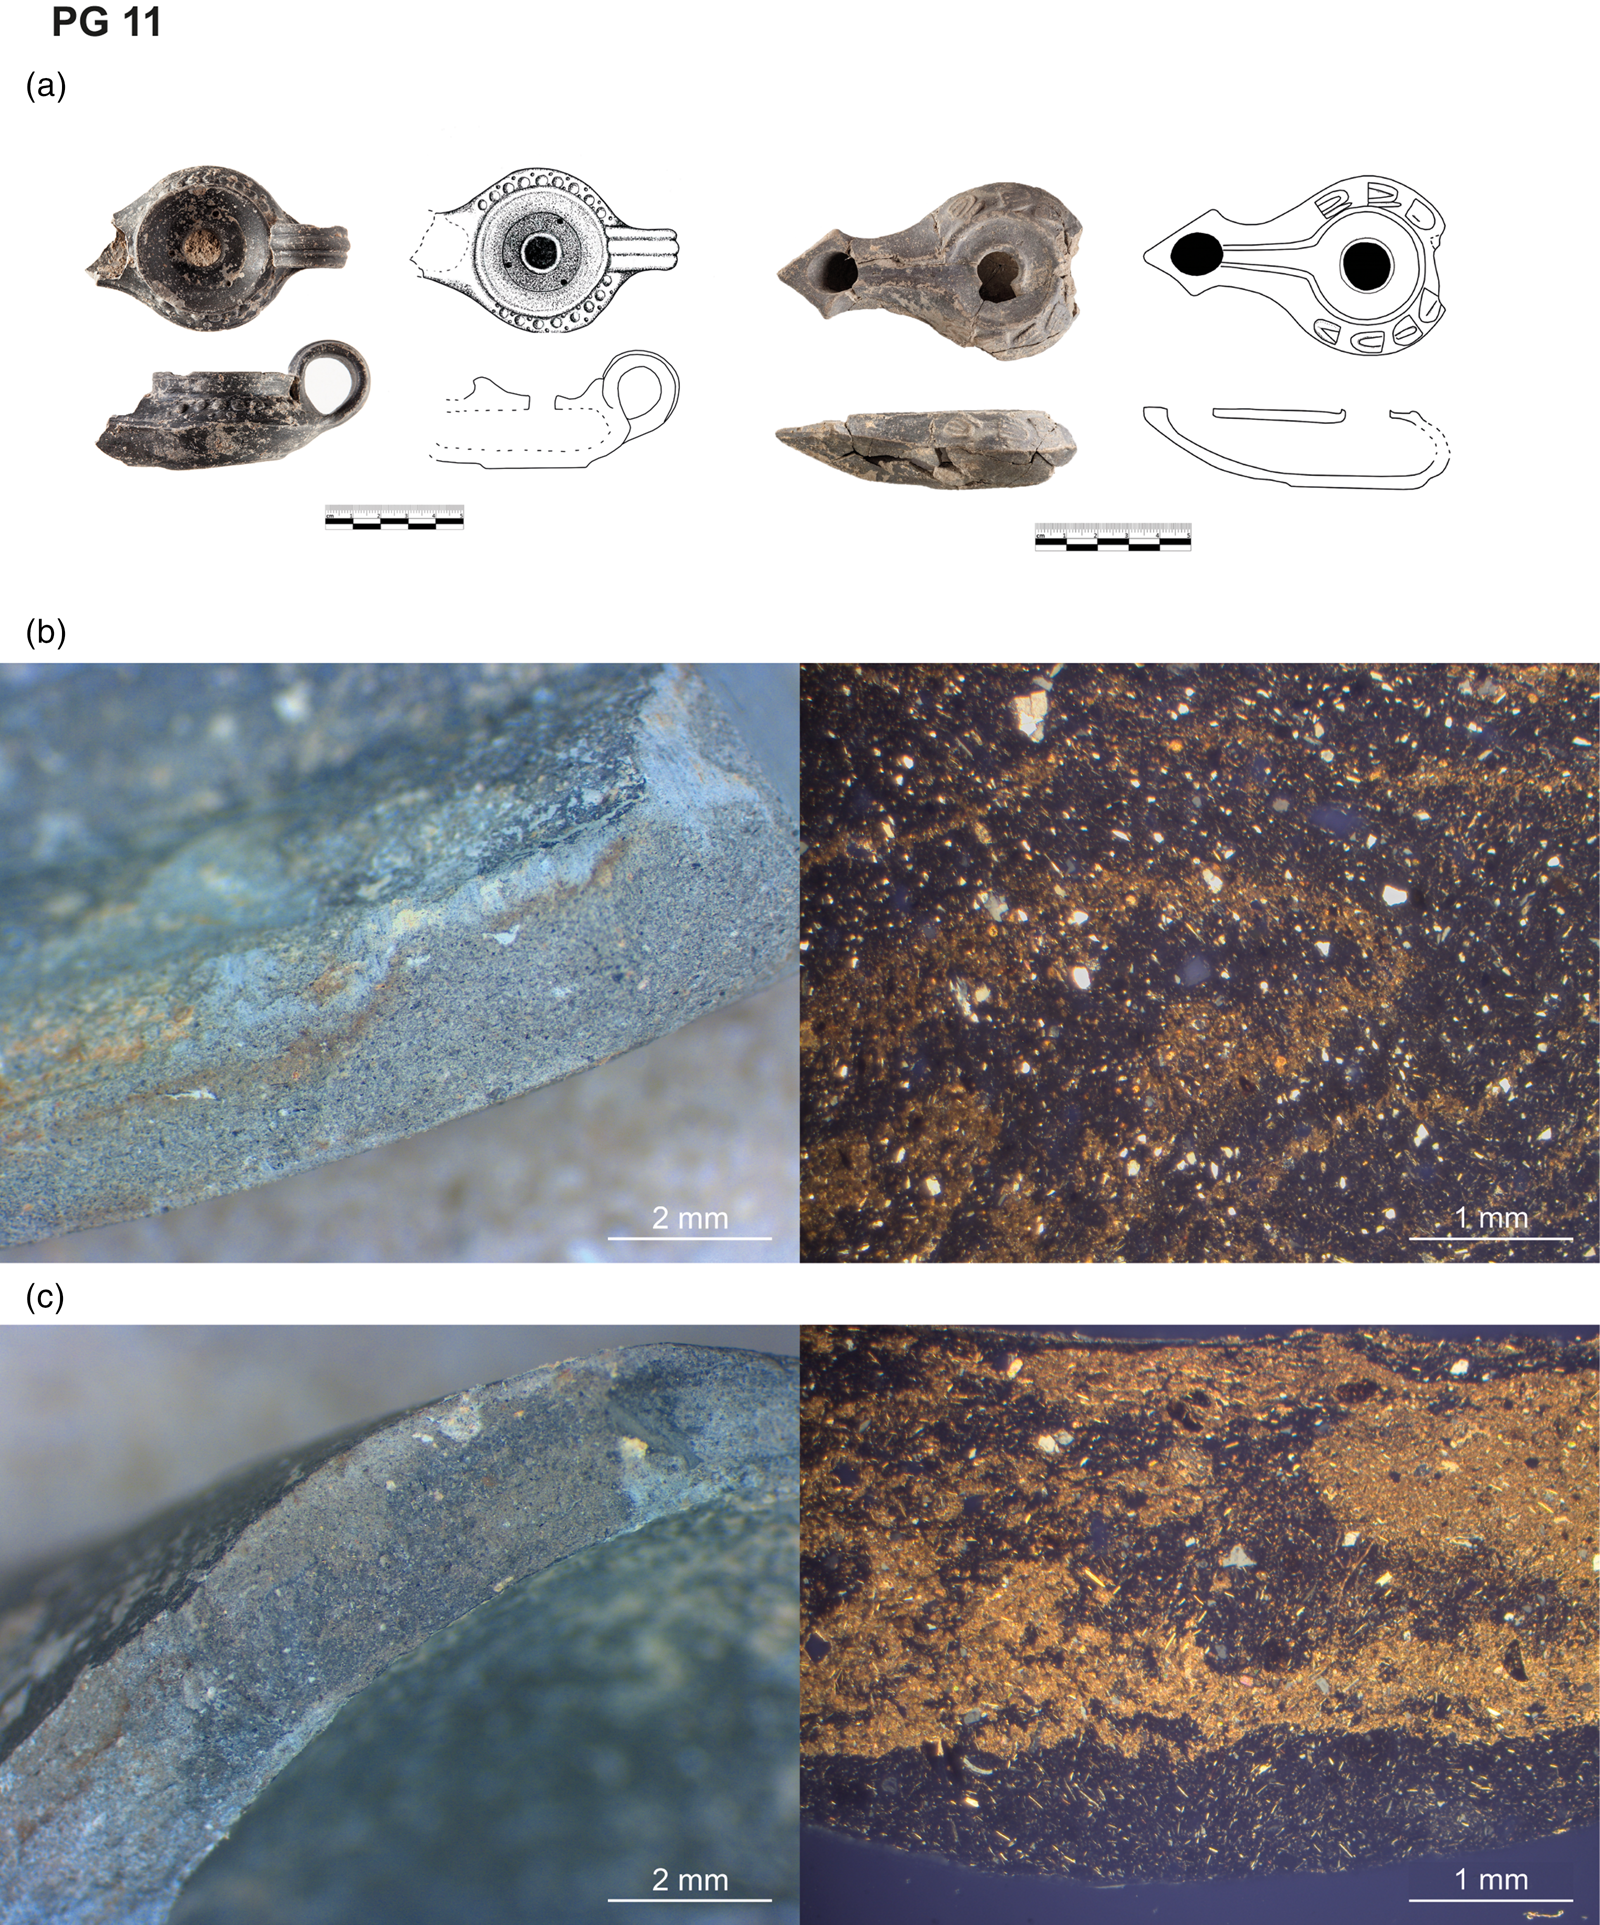
Both types are characterised by a fine grey fabric with frequent sparkling silver inclusions (Table A4). The types and the appearance of fabric of PG 11 seem to be the same as lamps unearthed during the excavations in Ephesus, which are interpreted as local to the site and called ‘Ephesian’ (Bailey Reference Bailey1975, 88; Giuliani Reference Giuliani2011, 533). The similar fabric is recognised in other classes of vessels, such as relief bowls and platters, which are also considered as Ephesian (Hayes Reference Hayes1991, 8, 14; Mitsopoulou-Leon Reference Mitsopoulou-Leon1991, 78–84; Outschar and Zabehlicky-Scheffenegger Reference Outschar, Zabehlicky-Scheffenegger and Zabehlicky-Scheffenegger1998; Fenn Reference Fenn2016, 217–18). Moreover, macroscopic analysis indicated that this PG is linked with a group of lamps from a collection of the British Museum for which Ephesian origin was also suggested on the basis of neutron activation analysis (Hughes, Leese and Smith Reference Hughes, Leese and Smith1988).
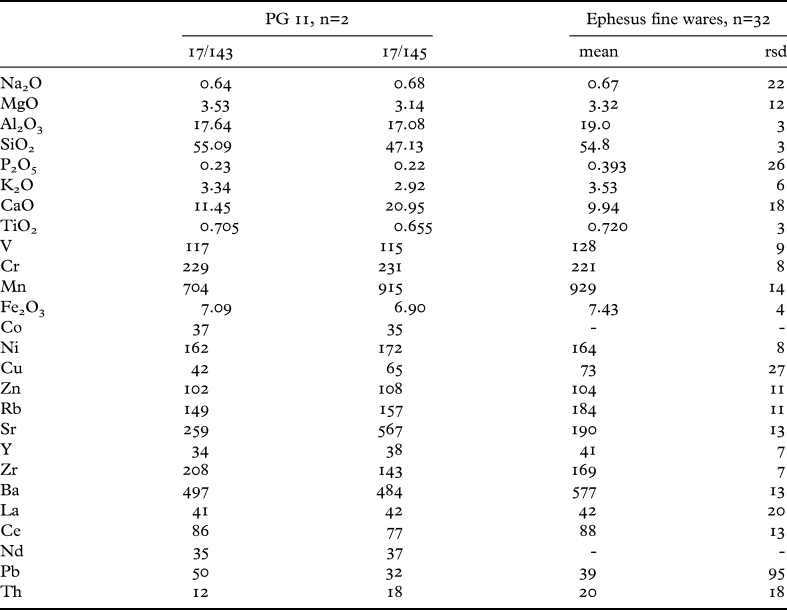
There are two other pieces of evidence supporting this origin: the results of WD-XRF and petrographic analysis of two lamps from the Paphos Agora classified into this PG (Table A5, Fig. 5). PAP17/143 represents a lamp with the channel between a filling hole area and a wick hole, and PAP17/145 was taken from a lamp with a flaring collar. In terms of elemental composition, both samples are characterised by high CaO and intermediate Cr and Ni concentrations, but PAP17/145 has higher CaO and Sr and lower SiO2 contents than PAP17/143 (Table A2). In particular, PAP17/143 fits well the reference patterns of pottery, including lamps, from Ephesus (Hughes, Leese and Smith Reference Hughes, Leese and Smith1988; Schneider Reference Schneider2000a, 530–3, table 3; Fenn Reference Fenn2016, 221–2, table 3; Table 8). The petrographic examination of both samples revealed that the matrix of PAP17/145 is dominated by micrite, which was observed also in PAP17/143 (Fig. 18bc), but in lower frequency, likely contributing to if not causing the observed differences in elemental composition. Apart from that, the thin section petrographic analysis indicated that both samples are characterised by a micaceous fabric with fragments of metamorphic rocks composed of quartz and mica (Table A3:PF6). This composition seems compatible with the geology of the area around Ephesus and the fabric mineralogy of other pottery categories produced in this region (Şenel Reference Şenel2002; Bezeczky Reference Bezeczky2013; Betina Reference Betina and von Miller2019).
Compositions (oxides are expressed in wt% and elements in ppm) of two samples classified to PG 11 and mean chemical composition and relative standard deviation (rsd) of the reference group of pottery from Ephesus (Schneider 2000, table 3). Data normalised to 100% for PG 11. For the reference group of pottery from Ephesus, major elements are normalised.
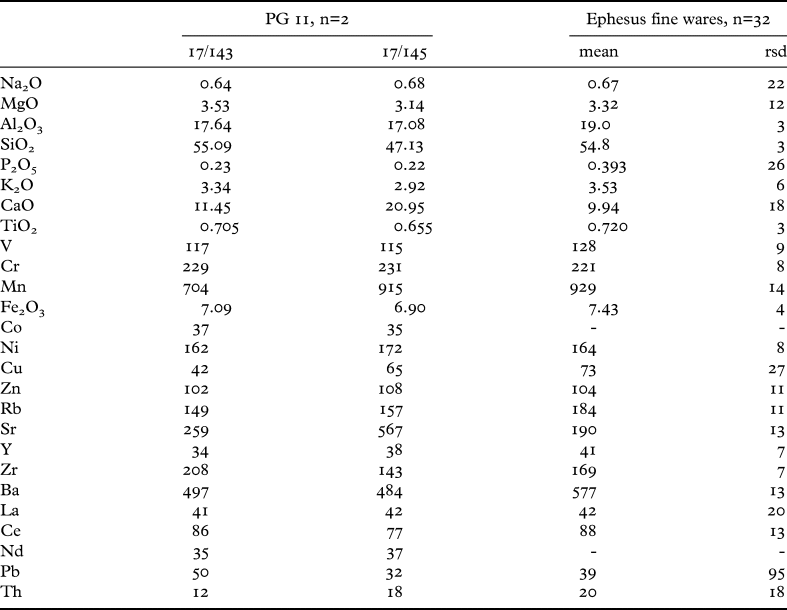
Ephesian lamps were exported across the Eastern Mediterranean during the Hellenistic period (Fig. 16).Footnote 25 It is worth mentioning that the lamps with flaring collars around the filling holes (Table A1:9) show even wider distribution than the second type (Table A1:8) (Giuliani Reference Giuliani2011, 537).
Production Group 12
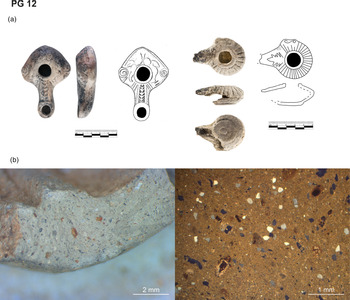
This PG consists of 32 mould-made lamps, half of them classified into two types. The first type (Table A1:10, Fig. 19a, on the left) is represented by three lamps with rhomboidal bodies in horizontal section and figural decoration on the shoulders: antithetic Erotes with an additional attribute, probably a palmette or a mask. The tops of the nozzles are often decorated with palmette and chevron, while the edges of the shoulders bear small volutes. The second type (Table A1:11, Fig. 19a, on the right) has a rounded body in horizontal section, an S-shape side lug and rays decoration, sometimes combined with chevron or petals and a single floral motif (palmette) on top of the nozzle. Thirteen lamps of this type were found at the Agora. Additionally, 16 fragments characterised by the same appearance of fabric, distinguished by grey colour and few, fine to medium, white, red, and grey inclusions (Table A4), were not assigned to any of these types due to the poor state of preservation. At the Agora, the lamps of PG 12 occur in Late Hellenistic contexts, dating between the mid-second and the last quarter of the first centuries bc. At other sites where these lamps have been found, they date back slightly earlier, i.e. from the late third century bc (Bruneau Reference Bruneau1965, 82–3; Młynarczyk Reference Młynarczyk1997, 36; Frangié Reference Frangié2011, 316–20).
Production Group 12: (a) photographs and drawings of lamps inv. nos PAP14/II/300/L1 and PAP16/IV/1052/L5 and (b) fresh break and thin section (XPL) photomicrographs of sample PAP17/132.

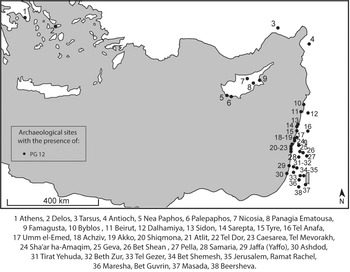
The archaeological study indicated that this PG was not produced on Cyprus. Comparison of the types and fabric to published description of lamps, associated to a specific origin on the basis of the results of laboratory analysis (Rautman Reference Rautman and Herbert1997, 218, 233–5; Dobbins Reference Dobbins, Berlin and Herbert2012, 108–10, with references), pinpoints an origin in the Levantine region. The distribution range also supports this assumption (Fig. 20).Footnote 26
The distribution of PG 12 in the Eastern Mediterranean.

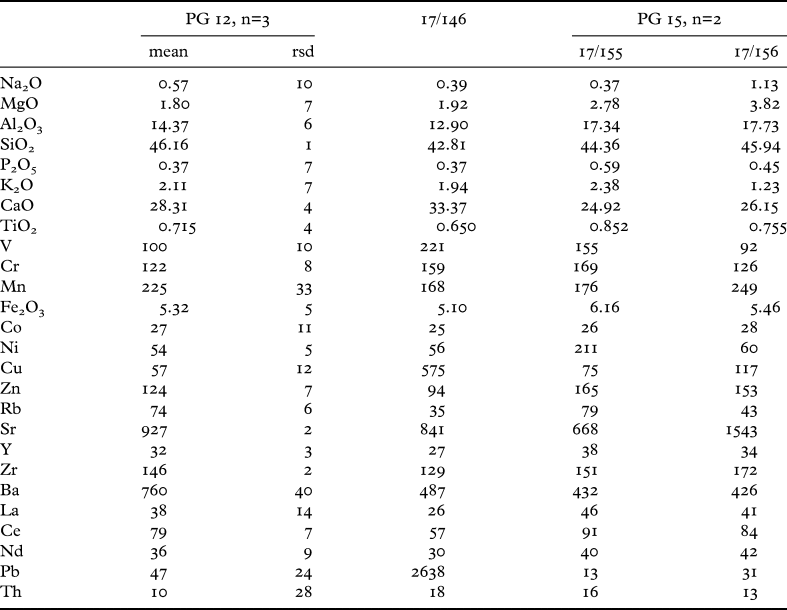
Four samples belonging to this PG were subjected to refiring tests and WD-XRF, and two of them were investigated through thin section petrography (Table A5, Fig. 5). Three samples form a homogeneous group in terms of elemental composition (Table 9). The composition of PAP17/146 is very similar, but differs slightly from other samples in this PG due to higher V concentrations. This sample has also very high Pb and Cu concentrations, probably resulting from post-depositional contamination (Table 9).
Mean chemical composition (oxides are expressed in wt% and elements in ppm) and relative standard deviation (rsd) of PG 12, and the compositions of PAP17/146 and two samples classified to PG 15. Data normalised to 100%.

The petrographic analysis of two thin sections revealed that the samples have semi-fine calcareous fabric, containing grains of sub-rounded to well-rounded quartz and micrite as well as microfossils (Table A3:PF7A). The shape and type of inclusions suggest that these lamps originate in the Levantine coast, and, more specifically, analogous fabrics have been associated with the Sidon-Tyre area.Footnote 27 Additionally, the results of the petrographic analysis indicated that PG 12 is related to Early Roman PG 15 in terms of type, size and distribution of inclusions (see Table A3:PF7AB).
Mould-made closed discus lamps
Production Group 13
This is the largest group in the entire assemblage. It consists of 237 lamps of seven different types (Table A1:12–18). Lamps assigned to PG 13 are often decorated on the discus and/or shoulders (Fig. 21a). The repertoire of motifs seems to be specific for this PG and consists of a single, central scene on the discus, such as an animal or figural depiction, rosette, or wreath. The shoulders are usually decorated with grooves (Table A1:12–15) or continuous ornament of ovules (Table A1:14,16–18). The lamps assigned to this PG date from the beginning of the first until at least the end of the second century ad. Due to different surface treatment, they can be divided into two variants showing different chronology. The lamps covered with slip seem to dominate during the first century ad, while the majority of lamps with plain surfaces date from the second century ad.
Production Group 13: (a) photographs and drawings of lamps inv. nos PAP16/II/775/L2, PAP12/I/37/L1, and PAP12/II/177/L6. Fresh break and thin section (XPL) photomicrographs of samples (b) PAP17/161 and (c) PAP17/162.
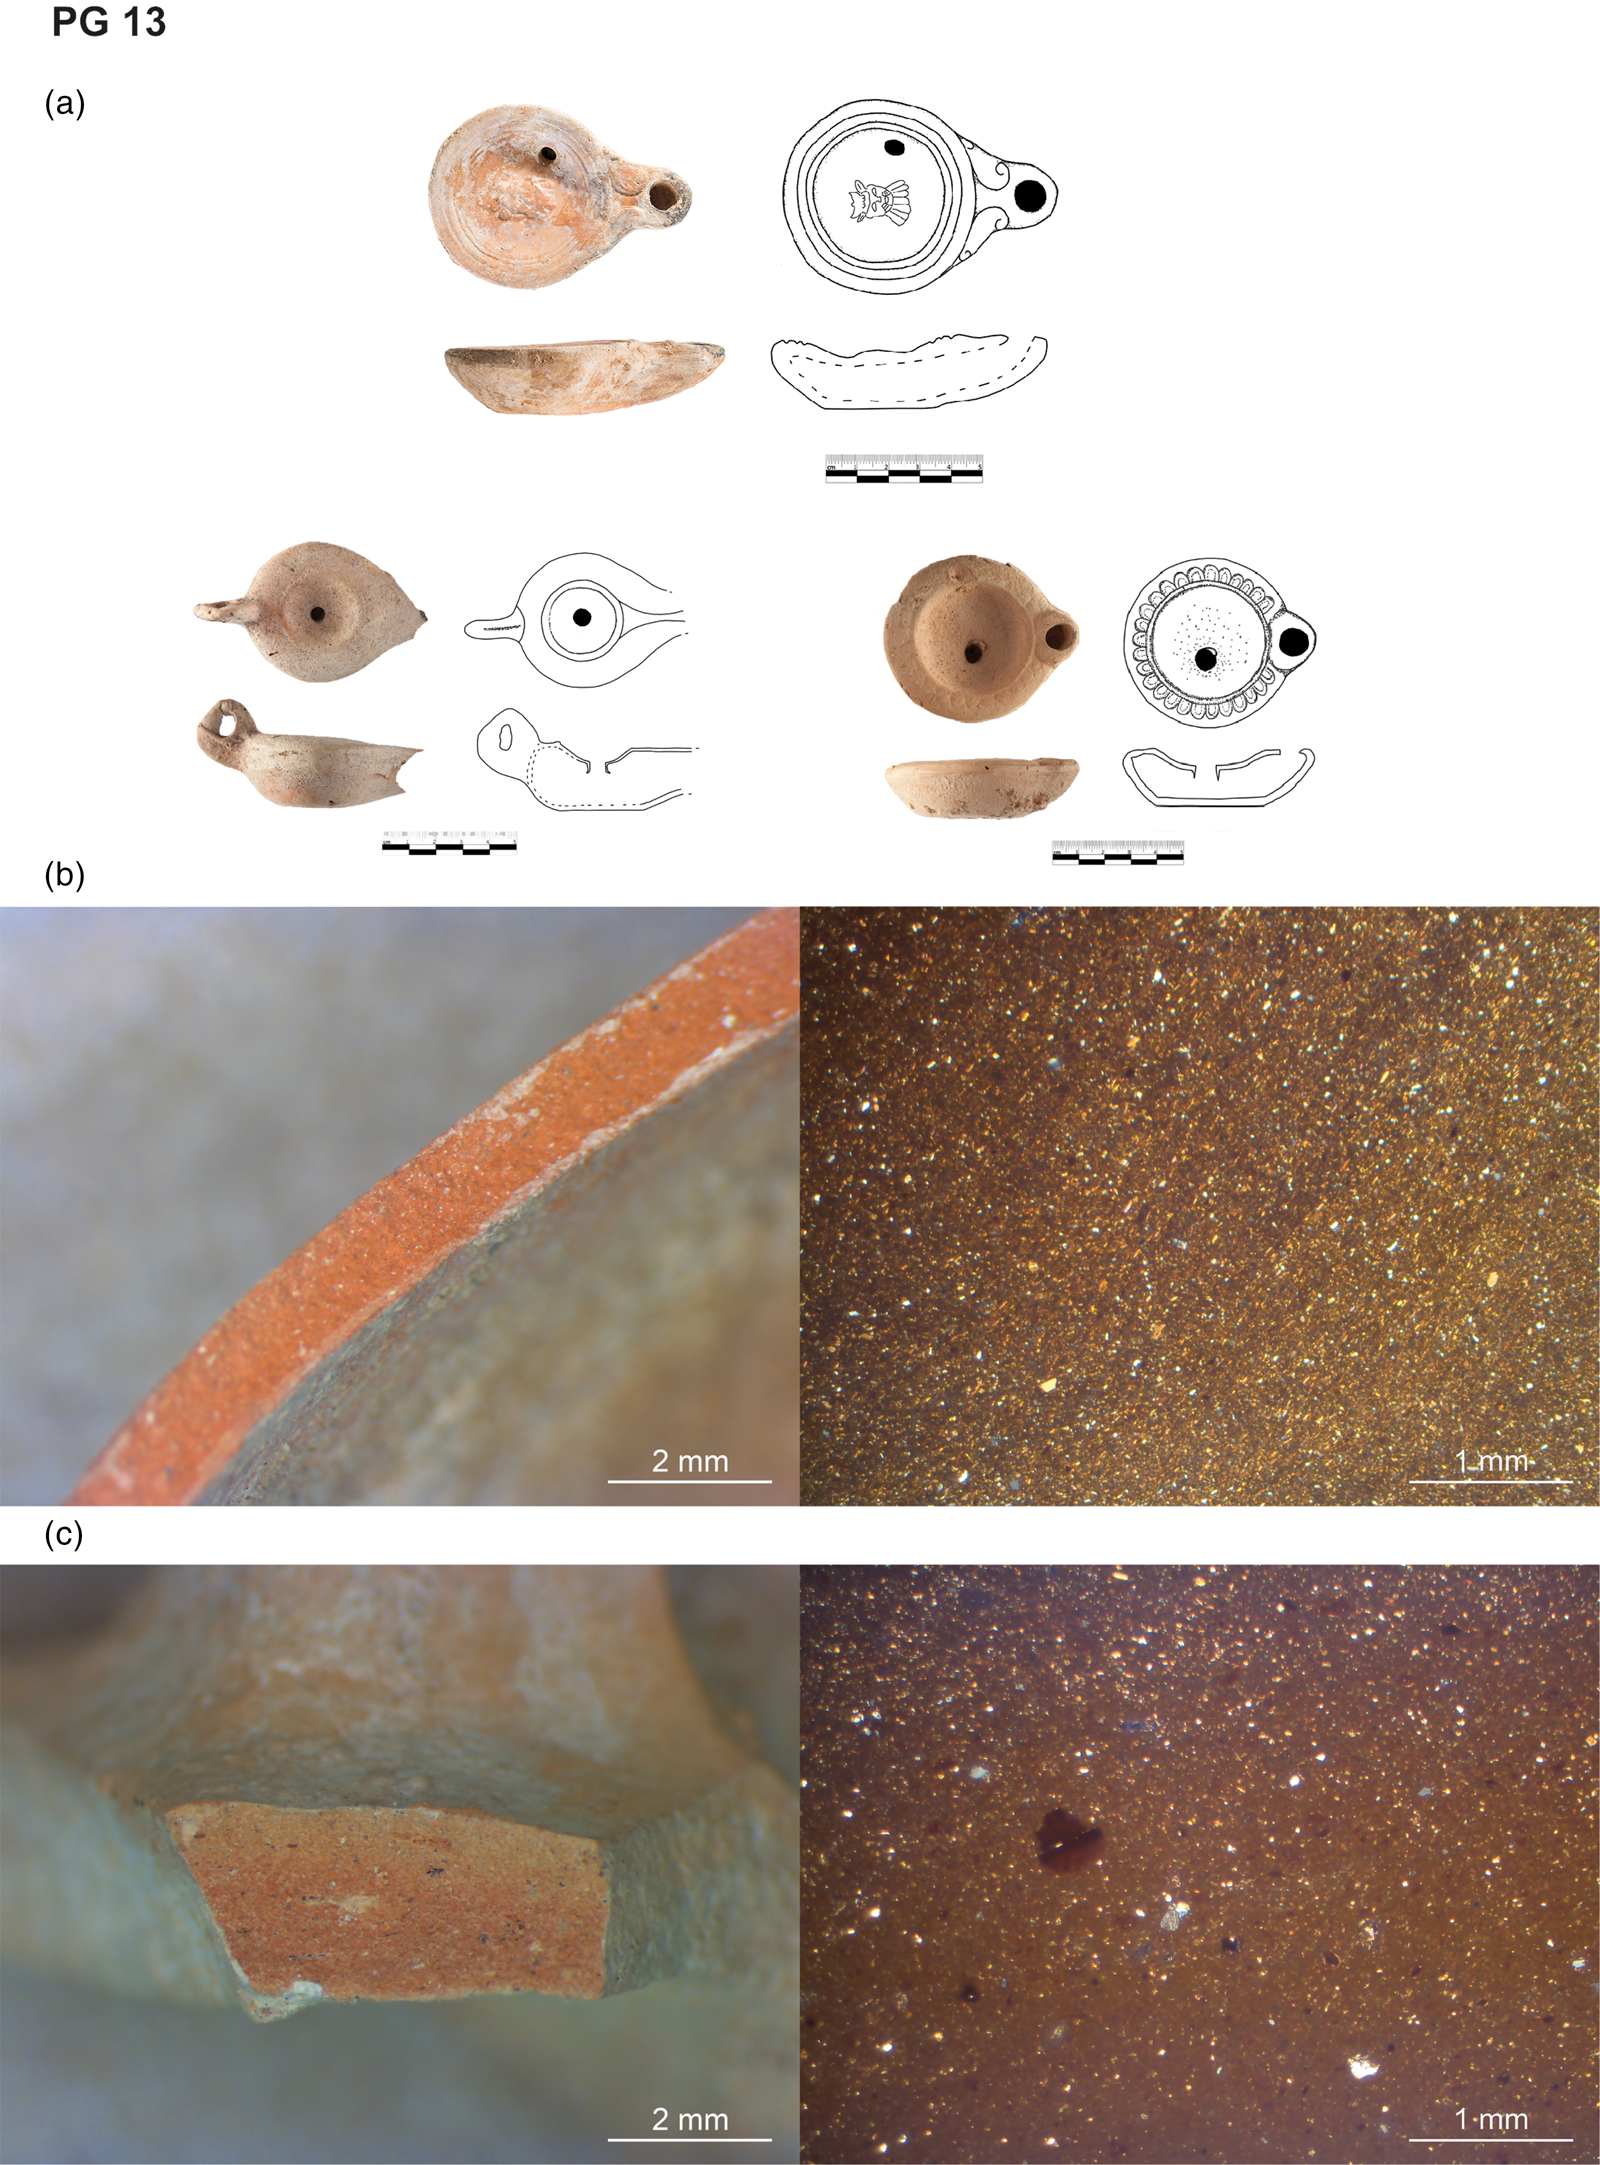
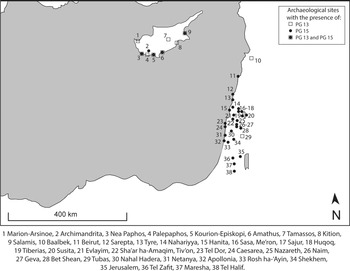
The appearance of fabric (Table A4) is similar to the Early Hellenistic lamps (PG 5) and colour-coated ware pottery (Marzec Reference Marzec2017, 190–3, Fabric Group 2; Marzec et al. Reference Marzec, Kiriatzi, Müller and Hein2018). This association was also confirmed by the results of elemental (Table 10) and petrographic analysis (Table A3:PF5). Six lamps (Table A5, Fig. 5) appear to share a common origin with Early Hellenistic ceramics (including PG 5), for which Cyprus or the Levant were proposed as potential places of production (Marzec et al. Reference Marzec, Kiriatzi, Müller and Hein2018). Taking into consideration previous studies (Młynarczyk Reference Młynarczyk1995, 208; Reference Młynarczyk, Daszewski and Meyza1998, 57–9), a distribution pattern showing the dominance of these lamps in Nea PaphosFootnote 28 and CyprusFootnote 29 (Fig. 22), as well as the remarkably high frequency and variability of lamp types in PG 13, a Cypriot origin for both Early Hellenistic and Early Roman productions appears more likely at this point.
Mean chemical composition (oxides are expressed in wt% and elements in ppm) and relative standard deviation (rsd) of PG 5, PG 13, as well as colour-coated ware (CCW) pottery Fabric Group 2 (Marzec Reference Marzec2017, Fabric Group 2; Marzec et al. Reference Marzec, Kiriatzi, Müller and Hein2018, table 4). Data normalised to 100%.

The distribution of PG 13 and PG 15 in the Eastern Mediterranean.

Production Group 14
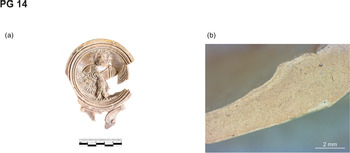
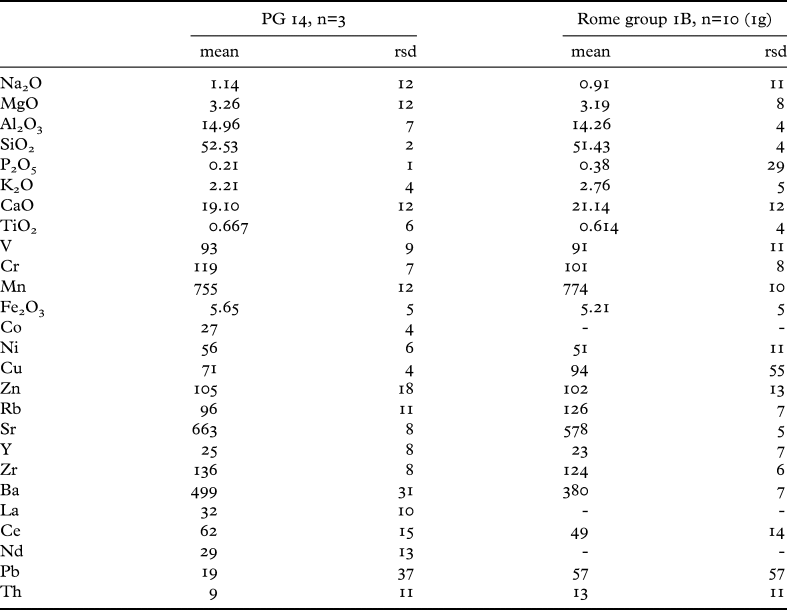
This PG consists of 34 mould-made lamps with long volute nozzles and decorated discuses, classified into four types (Table A1:12–15). The decoration is incised with a sharp outline, often showing complex figural, mythological scenes, such as Jupiter with an eagle or an armed Minerva. The lamps’ shoulders are frequently grooved or decorated with ovules or floral twigs. The fabric is very fine and pale, and the surface is covered with a dark flaky slip (Fig. 23, Table A4). These lamps have some macroscopic similarities with PG 15 in terms of fabric colour and character and colour of slip. The finds from Nea Paphos date between the late first century bc/early first century ad and the third quarter of first century ad (Młynarczyk Reference Młynarczyk, Daszewski and Meyza1998, 56; Kajzer Reference Kajzer2019, 135). However, the three samples analysed by WD-XRF spectroscopy (Table 11, Fig. 5) showed significantly different elemental composition from PG 15 (compare Table 9). Compared to the two PG 15 samples, they have lower CaO concentration. Moreover, the macroscopic re-examination of the assemblage revealed that the fabric of the PG 14 samples is finer than the lamps assigned to PG 15. Additionally, lamps of PG 14 have significantly larger bodies and more strongly sunken discuses in comparison to other Early Roman lamps.
Production Group 14: (a) photograph of lamp inv. no. PAP16/II/1217/L1 and (b) fresh break photomicrograph of sample PAP17/157.

Mean chemical composition (oxides are expressed in wt% and elements in ppm) and relative standard deviation (rsd) of PG 14 and the reference group Rome 1B (Ceci and Schneider Reference Ceci and Schneider1994, cluster 1B; see also Schneider and Daszkiewicz Reference Schneider and Daszkiewicz2019). Data normalised to 100% for PG 14. For the reference group of Rome 1B, major elements are normalised.
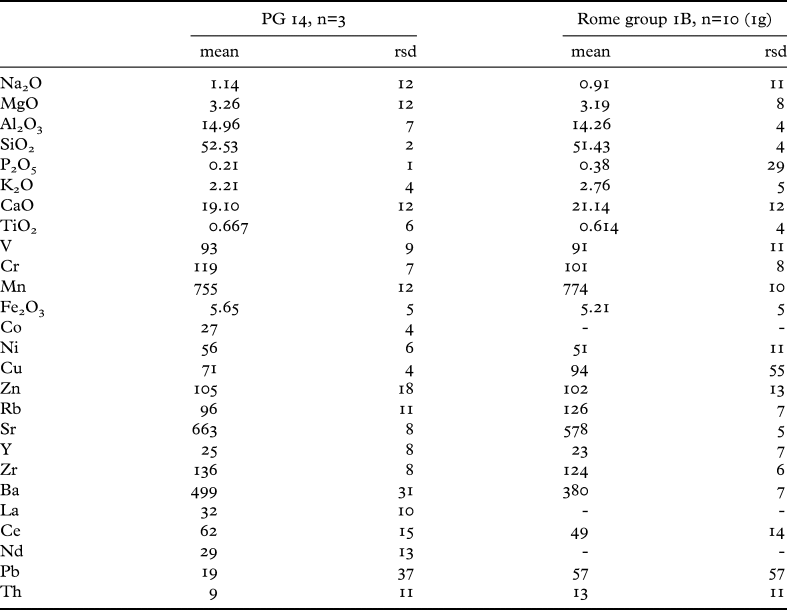
The Italian origin of this PG can be suggested on the basis of their visual similarity to lamps of supposed Italian origin in the collection of the British Museum (Bailey Reference Bailey1980). This tentative provenance assignment is also in accordance with an observation of J. Młynarczyk (Reference Młynarczyk1995; Reference Młynarczyk, Daszewski and Meyza1998), suggesting the common occurrence of Italian lamps on Cyprus, especially in contexts dated to the first third of the first century ad. The elemental composition of these samples appears to be very similar to a group of lamps found in Rome and Ostia analysed through WD-XRF by G. Schneider, as shown in Table 11, which is considered to be local (Ceci and Schneider Reference Ceci and Schneider1994, cluster 1B; see also Schneider and Daszkiewicz Reference Schneider and Daszkiewicz2019). However, the lamps analysed in the latter study represent other types, mostly the ‘factory lamps’ which were produced later (between first and second centuries ad) than PG 14 lamps.
The presence of PG 14 lamps was documented in Nea Paphos on the Agora, Fabrika Hill, the Theatre, the House of Dionysos, the House of Orpheus (Kajzer Reference Kajzer2019, 135), Maloutena (Młynarczyk Reference Młynarczyk, Daszewski and Meyza1998, 56) and the necropolis of Ktima (Raptou Reference Raptou2004, 312–13, pl. 41:3; Kajzer Reference Kajzer2019, 135).
Production Group 15
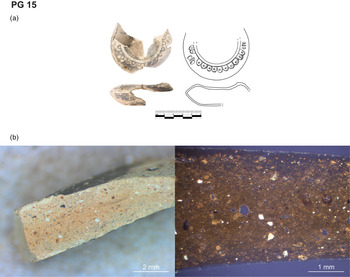
Thirteen mould-made discus lamps with short, round nozzles and without handles (Table A1:17) dated between the end of the first and the mid-second centuries ad (Sussman Reference Sussman2012, 58, 67) make up PG 15. The lamps’ discuses are undecorated but surrounded by a ring separating them from the sloping shoulders that usually bear a relief decoration of ovules and/or a motif of a rosette or a double-axe (Fig. 24a). The latter ornament is diagnostic for eastern workshops and refers to the mythological symbol of Zeus or Kronos (Sussman Reference Sussman2012, 64). The inclusions visible in the fresh break make these similar to PG 12, but the fabric has pale brown colour (Table A4). The correlation with PG 12 and iconography, popular in the presumed region of manufacture (Hayes Reference Hayes1980, 86–7, nos 351–66, pl. 42; Oziol Reference Oziol1993b, 56; Dobbins Reference Dobbins, Berlin and Herbert2012, 108; Rosenthal-Heginbottom Reference Rosenthal-Heginbottom and Chrzanovski2012; Sussman Reference Sussman2012, 55–67), suggests the Levantine region as a place of origin.
Production Group 15: (a) photograph and drawing of lamp fragment inv. no. PAP12/I/38/L1 and (b) fresh break and thin section (XPL) photomicrographs of sample PAP17/155.

The elemental composition of the two analysed samples are similar to each other but show slight variation in concentrations of Ni, Cr, Fe2O3, and V (Table 9). Petrographic analysis indicated that both samples have a semi-fine fabric with microfossils and grains of sub-rounded to well-rounded quartz and micrite (Fig. 24b), much like PG 12 samples (Table A3:PF7B). Based on these observations, both PGs (12 and 15) seem to be related to each other and likely originate from the Sidon-Tyre area. The elemental and mineralogical composition of PG 15 appears compatible with other groups of pottery produced in this region.Footnote 30 Lamps with the same typological features as those of PG 15 have been frequently recovered in the alleged production areaFootnote 31 and have been found at many sites on Cyprus (Fig. 22).Footnote 32
Loners
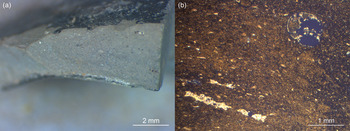
Four samples analysed by WD-XRF were defined as loners due to their distinct elemental compositions (see Table A2) and colours after refiring tests. Macroscopic re-examination of the samples confirmed these results. PAP17/127, PAP17/130 and PAP17/133 are not diagnostic, and no comparative match has been found for them. PAP17/144 (Fig. 25) is a fragment decorated with ivy-leaf. In terms of form and appearance of fabric, it is similar to lamps from the Cesnola Collection in the Metropolitan Museum of Art in New York (inv. nos 74.51.2134–6), which are associated with the region of Antioch.Footnote 33
(a) Fresh break and (b) thin section photomicrographs of sample PAP17/144.

DIRECTIONS OF SUPPLY
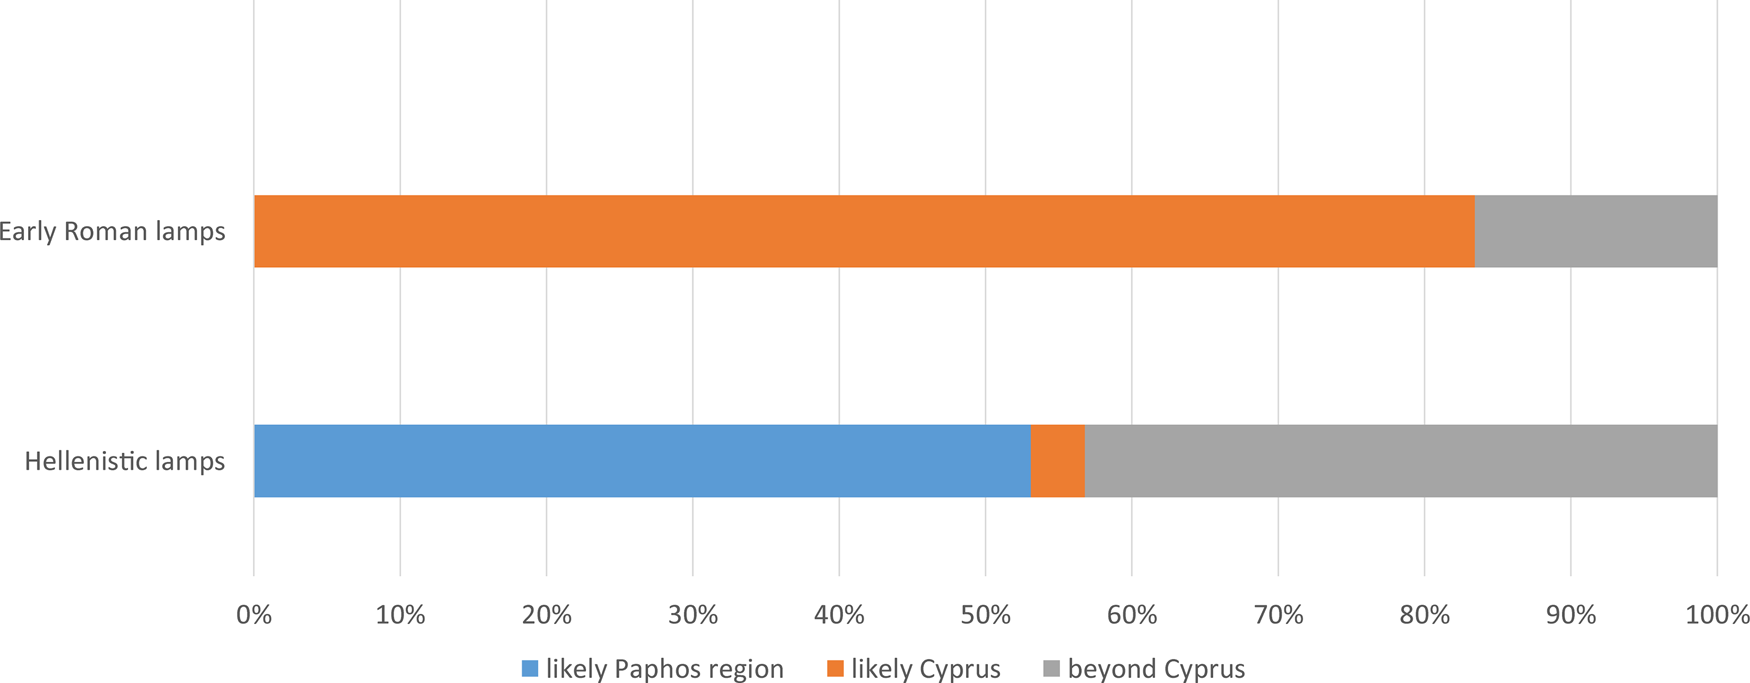
The combination of analyses and comparative studies demonstrates that a range of local and imported lamps was in circulation and use in Nea Paphos. In most cases, it was possible to assign the studied PGs to specific production centres or at least to wider regions of origin. Beyond those linked to local production, three PGs were considered as potentially associated with Cyprus, but not Paphos, and eight as long-distance imports, manufactured in locations beyond the island (Table 12).
Classification of PGs into three general zones of supply.

Local production
The results of the integrated analysis indicated that ceramic oil lamps classified into PG 1, PG 2, PG 8 and PG 10 were most likely produced in the area of Nea Paphos during the Hellenistic period. These PGs correspond with certain technological changes observed, in general, in lamp manufacture. These changes were connected with an important modification in lamp shape and manufacturing technique – from wheel-made open lamps (PG 1, PG 2), through wheel-made closed lamps (PG 8) to mould-made closed lamps (PG 10). These typological and technological transformations seem also to correlate to changes in clay recipes. These demonstrate the dynamics of local production following the new trends emerging in the rest of the Eastern Mediterranean.
The wheel-made open lamps with pinched rims have been associated with the earliest phase of local production. In association with this type, two PGs (PG 1 and PG 2) have been defined on the basis of their distinct elemental compositions (Table A2, Fig. 3c) and the different appearance of their fabrics observed both in thin section and with the naked eye. Lamps of PG 1, characterised by a very fine fabric, form a homogeneous group in terms of elemental and mineralogical composition. PG 2 shows internal variability in terms of size and frequency of inclusions as well as elemental composition (Table 2). Generally, lamps classified to this PG have fine to semi-fine fabric dominated by microfossils. Both PGs are compatible with the local geology of Paphos and have close similarities to the local production of colour-coated ware pottery (see descriptions of PG 1 and PG 2, Table A3). The coexistence of (at least) two PGs linked to the local lamp production is considered to reflect different clay paste recipes and potentially varied technological choices taken by the Early Hellenistic lamp-makers, being indicative potentially of at least two workshops or clusters of workshops in the Paphos region. Moreover, the results of the thin section analysis indicate that similar raw materials to those used for PG 2 continued to be used for the production of thrown closed lamps (PG 8) and moulded lamps (PG 10) until the end of the Hellenistic period. The differences in clay pastes used for the production of PG 2, PG 8 and PG 10 seem to be related to the size and frequency of the inclusions. Moreover, the variability observed in clay pastes composition is related to distinct forming techniques – i.e. wheel throwing and moulding – lamp types and chronology, and suggests the existence of a chronological pattern. The clay paste used to manufacture mould-made lamps is finer, contains predominantly microfossils and has a higher CaO content than the paste used for the wheel-made lamps.
Among the Hellenistic PGs, lamps attributed to the local production show the most extensive repertoire of forms (Table A1:1–4,6,7). Some types and decorations of lamps seem to be unique for Cyprus, e.g. wheel-made closed lamps with piriform bodies in vertical section (PG 8, Table A1:4) and the moulded lamps with a single application (PG 10). Other types, such as the wheel-made closed lamps with globular (PG 8, Table A1:2) and biconical bodies (PG 8, Table A1:3) in vertical section and the mould-made lamps with triangular nozzles (PG 10), seem to be highly influenced in shapes and style from different Aegean traditions, i.e. from Attica, Rhodes and Ephesus, respectively. As a result, many types of local lamps do not appear to differ from the general form development associated with the lamps elsewhere during the Hellenistic period.
It seems that lamps produced in the Paphos area were mainly distributed regionally, including in the island of Geronisos, and there is currently no evidence that they were exported elsewhere. It seems that their distribution is limited to the western part of Cyprus. This is in accordance with the regional approach proposed by J. Lund (Reference Lund, Wriedt Sørensen and Winther Jacobsen2006; Reference Lund2015, 154), who argues that pottery produced in western Cyprus was predominantly consumed locally.
The assumed locally produced lamps are the most frequently encountered ones in the Hellenistic assemblage (Fig. 26). Among these, the PG 10 lamps, mould-made and dated to the Late Hellenistic period, are the most numerous. This observation suggests that lamp production increased in Nea Paphos during the Late Hellenistic period. It seems that the transition from the Early Hellenistic to Late Hellenistic periods brought a tremendous change in the local lamp shape, manufacturing technique, clay recipe, and possibly the production organisation. The latter has been suggested not only by the large number of local lamps, but also by more homogeneous fabric than those of the Early Hellenistic period, indicating higher standardisation of the products. Moreover, the increase in lamp manufacture is in accordance with trends observed within the local production of the colour-coated table ware pottery. Previous studies (Marzec Reference Marzec2017, 245–7; Marzec et al. Reference Marzec, Kiriatzi, Müller and Hein2019, 4120–1) suggested that the increase of the colour-coated ware production during the Late Hellenistic period can be related with the growing importance of Nea Paphos, the development of the urban settlement and the subsequent growing demand for locally produced goods to meet the increasing demand for local consumption. This interpretation seems to be also valid for the lamps production.
Bar chart showing the proportions of lamps representing different zones of supply in the Hellenistic and Roman periods.

Possible Cypriot production
There is some indirect evidence for lamps imported to Nea Paphos from other, as yet unidentified, centres located possibly on Cyprus. Unfortunately, at this point, it is impossible to specify the exact production locations.
Two PGs dated to the Early Hellenistic period were classified as regional imports. The wheel-made lamps with a biconical body in vertical section classified to PG 6 are characterised by the same elemental and mineralogical compositions as well as the appearance of fabric and surface treatment as a group of Early Hellenistic colour-coated ware pottery from the Agora (Marzec Reference Marzec2017, 214, Fabric Group 3), which is characterised by the same elemental composition as group D of colour-coated ware pottery distinguished by M. Picon and F. Blondé (Reference Picon and Blondé2002, 14–15). They indicated that pottery classified to group D was produced from similar raw materials as Late Roman D/Cypriot Red Slip Ware, for which south-western Cyprus (Hayes Reference Hayes1967; Reference Hayes and Bianchi Bandinelli1985, 79; Reference Hayes1991, 37–8; Meyza Reference Meyza2002; Lund Reference Lund2015, 166–8; Bes Reference Bes2015, 19–20; Renson et al. Reference Renson, Slane, Rautman, Kidd, Guthrie and Glascock2016, 62–4; Hammond et al. Reference Hammond, Gabrieli, Ferguson, Glascock and Wismann2018, 121) or south-western Turkey (Gunneweg, Perlman and Yellin Reference Gunneweg, Perlman and Yellin1983; Jackson et al. Reference Jackson, Zelle, Vandeput and Köse2012) were suggested as potential production locations.
PG 5 consists of wheel-made lamps with a globular body in vertical section, which have the same appearance of fabric and elemental composition as a group of Early Hellenistic colour-coated pottery known from the excavations in Nea Paphos. The place of production of the colour-coated ware group remains unknown, but, based on its distribution, a production in Cyprus or the Levant has been suggested (Marzec et al. Reference Marzec, Kiriatzi, Müller and Hein2018). In view of the new data provided by this study, it seems that the origin can now be limited to Cyprus. The wheel-made lamps classified to PG 5 and the colour-coated vessels made of the same fabric occur in contexts dating from the late fourth to the mid-second century bc, and they are absent in the Late Hellenistic and Early Roman layers. However, in the Early Roman period, mould-made discus lamps (PG 13) with a similar fabric and comparable mineralogical and elemental composition to the above-mentioned Early Hellenistic ceramics are dominant among the lamp assemblage from the Agora. This suggests that the Early Hellenistic lamps (PG 5) and table wares as well as the Early Roman lamps (PG 13) were produced from the same raw materials. Based on this, and taking into consideration that there is no continuity of local lamp production during the Roman times, and PG 13 is the predominant group dated to this period (Fig. 26), it can be suggested that their production took part somewhere on Cyprus, possibly not far from Nea Paphos. However, the origin of these lamps cannot be securely pinpointed at this stage of the research.
Production beyond Cyprus
Ceramic oil lamps were minor trade goods (Bailey Reference Bailey1975, 10; Harris Reference Harris1980, 134). However, they have been found in shipwrecks as part of cargoes (Kajzer Reference Kajzer2019, 53–8), and their distribution could illustrate the directions of long-distance exchange and reflect trade routes. The study of the ceramic oil lamps from Nea Paphos allowed some general conclusions to be drawn concerning lamp mobility.
The earliest indication for the import of lamps from the North Levant dates from the late fourth/early third century bc. The wheel-made open lamps classified to PG 3 have been tentatively associated with this region. Although this association is not secure and requires further verification, previous studies suggested that table wares were imported from the North Levant throughout the entire Hellenistic and Early Roman periods.Footnote 34
The excavations in the Agora also produced further evidence for contacts of Nea Paphos with the Levant. Late Hellenistic mould-made lamps (PG 12) and Early Roman mould-made discus lamps (PG 15) are characterised by similar mineralogical composition, compatible with the Sidon-Tyre area. Apart from these lamps, other categories of Phoenician pottery, including but not limited to Late Hellenistic amphoriskoi (Hayes Reference Hayes1991, 65; Lund Reference Lund2015, 200), as well as Late Hellenistic and Roman transport amphorae (Marangou Reference Marangou2006, 55–6; Dobosz Reference Dobosz2016, 195; Reference Dobosz2020, 340, 342) and cooking pottery (Więch Reference Więch2017, 449; Nocoń Reference Nocoń2020, 307) have also been identified in Nea Paphos.
There is also evidence for the movement of pottery to Nea Paphos from the Aegean. The earliest identified lamps from the Aegean are Attic imports (PG 4). In Nea Paphos, they are usually recovered in Early Hellenistic layers; however, in other Cypriot sites they are present already in Classical contexts. This direction of material culture exchange has already been indicated by the finds of Early Hellenistic black gloss and West Slope table pottery (Hayes Reference Hayes1991, 5; Papuci-Władyka Reference Papuci-Władyka1995, 34–5; Marzec and Kajzer Reference Marzec and Kajzer2020, 225). The presence of Rhodian wheel-made lamps (PG 6) in Nea Paphos can be associated with the popularity of other products from this island and/or its territorial possessions in Asia Minor at that time. Rhodian-type transport amphorae (Oziol Reference Oziol1993b, 19; Barker Reference Barker, Lawall and Lund2013; Dobosz Reference Dobosz2016, 192–3; Reference Dobosz2020, 335–6; Lund Reference Lund2015, 192–4, 208) and table wares (Hayes Reference Hayes1991, 24; Lund Reference Lund2015, 194; Marzec Reference Marzec2017, 238; Marzec and Kajzer Reference Kajzer2020, 231–2) were widely distributed in Paphos and Cyprus, especially in the third and second centuries bc. Among the Aegean imports, wheel-made lamps with a moulded decoration (PG 9), probably produced in Knidos between the second half of the second century bc and the beginning of the first century ad, form a significant group. It is worth mentioning that among the assemblage of lamps recovered during the excavations at the Agora, there are mould-made discus lamps with the signature ‘Romanesis’ impressed on their bases, but these could not be subjected to laboratory analysis due to sampling restrictions.Footnote 35 The presence of the signature and the macroscopic appearance of fabric suggest that they can be attributed to the Romanesis workshop, which was likely located in Knidos and manufactured lamps from c. 70 to 130 ad (Heres Reference Heres1968, 203–4; Bailey Reference Bailey1988, 325–65; Gordon and Cova Reference Gordon and Cova2010, 282; Lund Reference Lund2015, 196). This movement of ceramic products, from Knidos to Nea Paphos, dated to between the second century bc and second century ad, is also supported by finds of stamped Knidian transport amphorae (Dobosz Reference Dobosz2016, 193–4; Reference Dobosz2020, 336–7) and table ware pottery (Hayes Reference Hayes1991, 12; Papuci-Władyka Reference Papuci-Władyka1995, 43, 75; Kögler Reference Kögler2011, 53–9; Lund Reference Lund2015, 194–6; Marzec Reference Marzec2017, 237–8; Marzec and Kajzer Reference Kajzer2020, 232; Kajzer and Marzec Reference Kajzer and Marzec2020, 255). The Ephesian mould-made lamps were produced on a large scale and widely distributed throughout the Mediterranean during the Late Hellenistic and Early Roman periods (Fig. 16). These lamps were also recognised among the assemblage from the Agora (PG 11) and among material from other excavations in Nea Paphos. It seems that their presence also influenced the local production of lamps during the Late Hellenistic period. Some of the local lamps have a nozzle ended with a triangular tip, a distinctive feature of the Ephesian lamps. This direction of material culture exchange has already been indicated by table ware, including relief bowls and grey ware platters (Marzec and Kajzer Reference Kajzer2020, 233; Kajzer and Marzec Reference Kajzer and Marzec2020, 256), as well as amphora finds unearthed in Nea Paphos, in Hellenistic and Roman contexts (Lawall Reference Lawall, Eiring and Lund2004; Dobosz Reference Dobosz2016, 195; Reference Dobosz2020, 332–3).
The earliest evidence for the Italian connections of Nea Paphos concern a few Gnathia amphora fragments, imported probably in the third century bc, and ‘Campana’ black gloss pottery dated to the second century bc (Lund Reference Lund2015, 186–8; Marzec and Kajzer Reference Kajzer2020, 226). However, evidence for more intensive contacts with the West dates to the Early Roman period, together with the appearance of Italian ceramics, including thin-walled pottery, sigillata (Hayes Reference Hayes1991, 59, 61; Papuci-Władyka Reference Papuci-Władyka1995, 63; Lund Reference Lund2015, 188; Marzec and Kajzer Reference Kajzer2020, 234; Kajzer and Marzec Reference Kajzer and Marzec2020, 253–4), cooking ware (Hayes Reference Hayes1991, 78–9; Lund Reference Lund2015, 188–9; Nocoń Reference Nocoń2020, 306–7), amphorae (Dobosz Reference Dobosz2016, 196; Reference Dobosz2020, 345), and possibly mould-made discus lamps (PG 14), as has been suggested in this study.
Finally, it should be mentioned that beyond the main groups discussed above, to which the majority of lamps can be assigned, there are lamps recovered at the Agora which likely come from regions not discussed in this paper. The origin of some remains unidentified; other singular examples or small groups can be attributed to Cilicia or Egypt on the basis of macroscopic analysis (Kajzer Reference Kajzer2019, 145–8, 161–4).
CHRONOLOGICAL DISTRIBUTION
Based on the current study, four chronological phases can be established, showing different production and distribution patterns. The first phase dates to the late fourth and third centuries bc, and it is characterised by the coexistence of the wheel-made open lamps and wheel-made closed lamps. The significant number of the wheel-made open lamps in the Early Hellenistic contexts corresponding to the earliest architectural phases at the Agora suggests that they were used in the newly founded city. These unslipped lamps representing a pre-Hellenistic potting tradition were probably produced in the wider region of Nea Paphos (PG 1 and PG 2) but also imported from somewhere else on Cyprus or from the North Levant (PG 3). The contemporary contexts yielded also the wheel-made closed lamps with a globular body in vertical section – the type produced in Athens since the Classical period. This type includes original black gloss imports from Attica (PG 4) and probably their Cypriot imitations (PG 5), whose surface was covered with red or black slip. The table wares from the same contexts are in the Classical tradition, both produced in Attica and on the island (Hayes Reference Hayes1991, 5; Papuci-Władyka Reference Papuci-Władyka1995, 34–5; Marzec Reference Marzec2017, 249–51; Marzec and Kajzer Reference Kajzer2020, 225–6). The lamps of this first chronological phase are related to the transitional phase between the Classical and Hellenistic periods associated with the city foundation.
The second phase dates between the mid-third and the mid-second centuries bc and sees the appearance of lamps with a biconical body in vertical section (Table A1:3), which were imported from Rhodes (PG 7) but also probably produced on Cyprus (PG 6) as well as in the Paphos region (PG 8). However, the lamps typical for the previous phase were still in use until the end of the third/early second century bc. They are followed by lamps with a piriform body in vertical section (Table A1:4), a shape typical for local production (PG 8), which appeared in the late third century bc. During this phase, Nea Paphos regained its political stability under the Ptolemaic reign, and around 203 bc it became the capital of the island.
The third phase dates from the mid-second to the end of the first century bc and is characterised by the emergence of moulding as a forming technique for lamps. The results of the analyses suggested that mould-made lamps were imported to Paphos from Ephesus (PG 11, Table A1:8,9) and the Levant (PG 12, Table A1:10,11), as well as produced locally (PG 10, Table A1:6,7). This phase is also characterised by a slow decline of wheel-made lamps, most of which went out of use until the end of the second century bc. Only Knidian grey ware wheel-made lamps (PG 9, Table A1:5), with moulded decoration, were used until the Early Roman period. Generally, the number of lamps appears to have increased and they show a more extensive repertoire of shapes than in the previous phases. A similar phenomenon has been observed for the production and consumption of colour-coated pottery, where it has been interpreted as a consequence of an increasing demand for goods related to the development of the city during the Late Hellenistic period (Marzec Reference Marzec2017, 245–7; Marzec et al. Reference Marzec, Kiriatzi, Müller and Hein2019, 4121).
The fourth phase is marked by the appearance of Early Roman mould-made discus lamps, and it dates from the beginning of first to the mid-second century ad. It is also characterised by an apparent decline in local production and the occurrence of lamps imported from other production centres likely located (elsewhere) in Cyprus (PG 13), the Levant (PG 15) and presumably Italy (PG 14). Interestingly, a similar phenomenon has been observed for colour-coated ware pottery production: this was the most common table ware pottery class during the Hellenistic period, but in Roman times its local production declined (Marzec Reference Marzec2017, 250–1; Kajzer and Marzec Reference Kajzer and Marzec2020, 260–1). The lamps of PG 13 are predominant in the Early Roman assemblage dated to between the beginning of the first and the end of second centuries ad. They show an extensive repertoire of forms (Table A1:12–18) and variability of surface treatment.
SUMMARY AND CONCLUSIONS
The assemblage of Hellenistic and Roman lamps from the Paphos Agora is highly variable in terms of forms and fabrics. This variability seems to be related not only to their morphological and technological evolution, but also to their varied origins. An important outcome of this study was the definition of the local production of lamps in Nea Paphos. The macroscopic assignment of the lamps was confirmed, to a large extent, by the results of the laboratory analysis. It seems that lamps assigned to PG 1, PG 2, PG 8 and PG 10 were made in workshops located in the Paphos region. These four PGs are characterised by different clay pastes, forming techniques, surface treatments, types and chronology. Nevertheless, it seems that the lamps belonging to all the above-mentioned PGs were manufactured from raw materials associated with the same geological unit(s), likely from the area of Paphos, covering the entire Hellenistic period. Based on the results of this study, it can be suggested that local lamp production declined at the beginning of the Roman period, and was substituted by lamps presumably produced in another centre(s) on Cyprus. A similar production pattern has been observed for colour-coated pottery (Marzec Reference Marzec2017, 249–51; Marzec et al. Reference Marzec, Kiriatzi, Müller and Hein2019), which was manufactured with the use of similar clay pastes. The possible cause of this phenomenon appears to be related to a destruction of Nea Paphos by an earthquake in 17 or 15 bc (Ambraseys Reference Ambraseys2009, 104), followed by an extensive rebuilding of the city (Młynarczyk Reference Młynarczyk1990a, 33), which caused changes in modes of production and supply (Marzec Reference Marzec2017, 247). It seems that Cypriot lamp production continued to supply the city, in particular in the Early Roman period, when, as mentioned above, lamps produced presumably in other centre(s) on Cyprus appear to have largely replaced the local production.
The presence of numerous imports within the studied assemblage witnesses the extensive cultural and economic connections Nea Paphos had developed with other centres in the Levant, Aegean and Italy. This study confirmed that lamps comprised long-distance exchange goods and underlined the role of Nea Paphos as an important commercial centre, connecting the Aegean with the Levant. The lamp distribution patterns correspond well to patterns observed for other imports from the same areas, especially table wares. It is possible that the lamps and table wares were transported together as secondary cargo or space-fillers on ships (Bes Reference Bes2015, 2; Lund Reference Lund2015, 213). Lamps, due to their small volume, did not take a lot of space in cargoes (Boardman Reference Boardman1988, 30), so that a large number of lamps could have been distributed at once, as has been suggested by the evidence from shipwrecks, such as Grand Bassin C (Gibbins Reference Gibbins1989, 20; Parker Reference Parker1992, 199), Pozzuoli (Gibbins Reference Gibbins1989, 20) and Skerki Bank D (McCann and Oleson Reference McCann and Oleson2004, 43).
It is clear that imported and local lamps were used at the same time, if not necessarily by the same people, as they are found together in the same archaeological contexts. The variety of products that must have been available on the local market may have been linked to particular demands for daily life objects and likely reflects the tastes and preferences of a diverse and widely connected society living in the city.
The interdisciplinary methodology adopted in the current study of ceramic oil lamps underlines the potential of such an approach. The first stage of this integrated research was a detailed and systematic macroscopic fabric characterisation resulting in the formation of MGs, which are traditionally considered to correspond to different production centres and/or areas, also reflecting variable chronology. It has to be underlined that macroscopic fabric examination combined with typological and stylistic analyses were informative and, as further analysis demonstrated, allowed for the identification of some valid groups (e.g. Attic lamps). However, in some cases the macroscopic analysis was not sufficient to form a proper group due to the fine nature of the fabrics and colour similarity, especially observed within grey fabrics. The use of a stereo microscope would probably improve the results and prevent some of the mistakes at this stage. Additionally, an important step was the implementation of refiring tests as a complementary method for macroscopic analysis. It was very useful for the elimination of colour diversity of the samples, caused by varied temperatures and atmosphere of the original firing or by other factors connected with lamps use and post-depositional conditions. It was especially helpful for the classification of fragments that had originally been fired in a reducing atmosphere (e.g. Knidian lamps). In the case of the latter, observation of the inclusions and comparison of the fabric colours after refiring was much easier.
The results of the WD-XRF analyses showed that some samples differ from each other in terms of elemental composition despite the same appearance of fabric, shape, decoration and classification to one PF. This is usually observed within PGs represented only by two or three lamps subjected to laboratory analysis. It is likely related to an insufficient number of analysed samples to show the continuum of the internal variability of a PG. For this reason, it is important to examine as many samples as possible. Thin section petrography proved to be an informative method for such cases, even for lamps with fine fabrics and thin walls. The observations made under the petrographic microscope allowed for a better understanding of sample associations and the causes of the internal variability of the PGs.
Overall, the research presented here revealed a complex picture of lamp production and distribution in Nea Paphos during the Hellenistic and Early Roman periods. The next step is to apply the methodology used in this study to lamps from other sites in order to increase the reference database and define lamp production centres in other parts of the island. Additionally, further investigation of supposed Cypriot fine ware pottery groups is essential to better understand lamp origins and supply patterns. To pinpoint the origin of PG 6 lamps, for example, further analysis of Late Roman D/Cypriot Red Slip Ware is necessary. To verify the assumption that they were manufactured at more than one place, namely south-western Turkey and south-western Cyprus, a large number of samples representing these wares from both locations should be investigated thoroughly using scientific analysis. Other PGs of presumably Cypriot origin, i.e. PG 5 and PG 13, as well as some long-distance imports, such as PG 3 and PG 14, also require further investigation. Undoubtedly, the discovery of actual lamp workshops or other direct evidence of manufacture is essential for understanding their origin and supply patterns.
ACKNOWLEDGEMENTS
The project was carried out within the framework of the grant PRELUDIUM 10 – no. 2015/19/N/HS3/01810 financed by the National Science Centre, Poland. Additional financial support has been provided by the European Social Fund – programme POWER – no. WND-POWR.03.02.00-00-1025/17 – for the thin-section petrography. This research would not have been possible without the support of E. Papuci-Władyka, the director of the Paphos Agora Project, who granted the permission to study and publish the lamps, as well as the Department of Antiquities, Cyprus, which issued the sampling permit. The illustrations presented in the paper were made by A. Oleksiak (the photographs of the lamps and their fragments), A. Jurkiewicz-Cora (some of the drawings) and the authors.
Typology and chronology of lamps from the Paphos Agora excavations and concordance with Production Groups (PG) and existing classifications.

Elemental composition of the samples; oxides, LOI (loss on ignition) and sum are expressed in wt% and elements in ppm.

Petrographic descriptions. Abbreviations used: PG = Production Group; PPL = plane polarised light; XPL = crossed polarised light; a = angular; sa = subangular; r = rounded; wr = well rounded; TCFs = textural concentration features.

The macroscopic characterisation of production groups (PG). Definition of terms used in the table: Frequency: Rare = less than 2%; Few = 2–15%, Frequent = 15–30%; Common = 30–50%; Size: Fine = smaller than 0.25 mm; Medium = 0.25–0.5 mm; Coarse = 0.5–1 mm; Hardness: Soft = can be easily scratched with a fingernail; Fairly Hard = can be hardly scratched with a fingernail; Hard = can be scratched with a knife; Very Hard = can't be scratched with a knife; Feel of Surface: Smooth = no irregularities can be felt; Powdery = leaves powder on the finger; Slightly rough = with few irregularities; Rough = with frequent irregularities; Texture of Fresh Break: Conchoidal = porcelains, high fired fabrics without inclusions, breaks like flint, obsidian or glass; Smooth = flat, without ripple marks; Irregular = with frequent inclusions, medium and angular irregularities; Rather hackly = with common inclusions, large and angular irregularities. The colours were recorded using the Munsell Soil Color Charts (2013).

List of samples subjected to refiring, WD-XRF and thin section petrography, including information about inventory numbers, part of lamp, and photographs. The samples are presented according to Production Group (PG).