Nomenclature
Abbreviations
- AP
-
approach
- BED
-
battery energy density [Wh/kg]
- CL
-
climb
- FEM
-
finite element modelling
- FoM
-
figure of merit
- HEA
-
hybrid-electric aircraft
- ID
-
idle
- MTOW
-
maximum take-off weight
- OEW
-
operating empty weight
- REI
-
reference emission index
- TO
-
take-off
- VLM
-
vortex lattice method
Symbols
- a
-
fitting parameter [g/kg]
- b
-
fitting parameter [min/kg]
- E
-
emission [g]
-
 $\dot{E}$
-
time derivative of E [g/min]
-
${E}_{{{C}}{{{O}}_{{2}}}}$
-
${{C}}{{{O}}_{{2}}}$
emission [g]
- EI
-
emission index [g/kg]
-
${{E}}{{{I}}_{{{C}}{{{O}}_{{2}}}_{{f}}}}$
-
mass of
${{C}}{{{O}}_{{2}}}\;$
emitted per kilogram of fuel burned [g/kg] -
${{E}}{{{I}}_{{{C}}{{{O}}_{{2}}}_{{f}}}}$
-
mass of
${{C}}{{{O}}_{{2}}}$
emitted per unit of kWh of electricity produced [g/kg] - H
-
humidity correction factor
-
${H_{{P}}}$
-
hybridisation factor
-
${m_{{b}}}$
-
battery mass [kg]
-
${m_{{f}}}$
-
fuel mass [kg]
-
${m_{{{fb}}}}$
-
block fuel [kg]
-
${{\dot{m}}_{{{fr}}}}$
-
reference fuel flow [kg/min]
-
${{\dot{m}}_{{f}}}$
-
fuel flow [kg/min]
-
${m_{{p}}}$
-
payload mass [kg]
- M
-
Mach number
-
${P}_{{r}}$
-
thermal engine pressure ratio
-
${P}_{{i}}^{{e}}$
-
installed electric motor power [W]
-
${P}_{{i}}^{{t}}$
-
installed thermal engine power [W]
-
${P}_{{k}}^{{t}}$
-
thermal engine supplied power [W]
- t
-
time [min]
- V
-
aircraft true air speed [m/s]
- x
-
design variables vector
- W/S
-
wing loading [kg/m2]
- W oe
-
operating empty weight [
${{k}}{{{g}}_{{f}}}$
] - Subscript cl
-
climb
- Subscript cr
-
cruise
- Subscript de
-
descent
- Subscript i
-
installed
- Subscript k
-
phase of the mission
- Superscript e
-
electric motor
- Superscript t
-
thermal engine


Greek letters
- δ
-
altitude-sea level air temperature ratio
- Φ
-
power fraction
-
${{\varPhi }}_{{{k,max}}}^{{e}}$
-
maximum electric motor power fraction
- θ
-
altitude-sea level air pressure ratio

1.0 Introduction
The development of hybrid-electric propulsion for transport aircraft has become increasingly relevant within aerospace research [Reference Abu Salem, Palaia and Quarta1, Reference Kuśmierek, Galiński and Stalewski2]. This technology offers the potential to significantly reduce pollutant emissions directly associated with flight operations, hence contributing to a reduction in aviation’s environmental footprint. However, its practical implementation on transport aircraft faces several challenges that currently limit its widespread adoption. These challenges include the integration of electric components into the aircraft architecture [Reference Barzkar and Ghassemi3], the consistent evaluation of reliability and safety standards [Reference Moebs, Eisenhut, Windels, van der Pols and Strohmayer4, Reference Papathakis, Burkhardt, David and Alaric5], and the compatibility with current infrastructures [Reference Trainelli, Salucci, Riboldi, Rolando and Bigoni6, Reference Meindl, de Ruiter and Marciello7]. Above all, the key challenge remains advancing the technological maturity of the primary electric components of the powertrain [Reference Benzaquen, He and Mirafzal8]. This is particularly crucial when moving from conceptual designs to practical implementations. Specifically, the development of battery technology is a critical enabler for hybrid-electric propulsion systems, with the current low gravimetric energy density representing a significant obstacle [Reference Viswanathan, Epstein and Chiang9, Reference Palaia, Abu Salem and Quarta10]. Even the most optimistic projections regarding battery advancements suggest that hybrid-electric propulsion will be feasible only for aircraft within the regional category [Reference Abu Salem, Palaia, Quarta and Chiarelli11]. Without disruptive breakthroughs in electrical energy storage devices, it is likely that hybrid-electric propulsion in the coming decades will remain limited to aircraft with constrained range and payload capabilities, likely no more than 800 nm and 80 passengers, aligning with the regional turboprop market [Reference Prapotnik, Kamnik, Marksel and Božičnik12, Reference Eisenhut, Moebs, Windels, Bergmann, Geiß, Reis and Strohmayer13]. Furthermore, the potential environmental benefits, although promising, must be weighed against the lifecycle impacts of the energy storage systems, which could introduce new sustainability challenges, such as material shortage and recycling concerns [Reference Scholz, Trifonov and Hornung14, Reference Thonemann, Saavedra-Rubio and Pierrat15]. Finally, the overall scenario of aircraft operations, starting form ground facilities, considering energy production issues, and performing sound emissions computations is necessary to provide a comprehensive picture.
Through a discussion on possible methods for estimating hybrid-electric aircraft emissions, this paper aims to provide a general and qualitative examination of the potential environmental benefits that could result from the adoption of this technology, focusing mainly on emissions assessments. The limited availability of data and specific information on this innovation presents notable challenges, which are analysed in this work, highlighting key issues that must be addressed in order to rigorously assess the environmental impact of hybrid-electric aircraft. The discussion is supported by a broad evaluation of the potential environmental impacts of this technology. Specifically, the analysis is organised on two levels, addressing two distinct concerns related to flight-related emissions: the degradation of local air quality, and the contribution to climate change. The first issue relates primarily to air pollution caused by aircraft operations at ground level and low altitudes, which mainly affects the areas surrounding airports, often densely populated. There is clear evidence that the degradation of air quality in these areas is driven by non-
 ${{C}}{{{O}}_{{2}}}$
emissions (e.g.,
 ${{N}}{{{O}}_{{x}}}$
,
 ${{S}}{{{O}}_{{x}}}$
, particulate matter, etc.) from aircraft exhausts, and this phenomenon has been shown to significantly affect the quality of life and the health of nearby residents [Reference Brooker16, Reference Stettler, Eastham and Barrett17]. Reducing such emissions could potentially alleviate health-related issues in these regions. Conversely, the implications of air transport for climate change are more complex [Reference Parker18, Reference Lee, Pitari and Grewe19]; over the long term,
 ${{C}}{{{O}}_{{2}}}$
emissions are the primary driver of global warming, while there remain uncertainties regarding the quantification of the impact of non-
 ${{C}}{{{O}}_{{2}}}$
greenhouse gases. These emissions appear to introduce effects on shorter time scales, complicating their assessment [Reference Brazzola, Patt and Wohland20, Reference Rogelj21]. The early estimation of aircraft emissions, even during the conceptual design phase, provides a valuable preliminary insight into the potential global warming impact, as demonstrated in refs. [Reference Proesmans and Vos22, Reference Tasca, Cipolla, Abu Salem and Puccini23].
The discussion presented in this paper aims to establish a foundation for addressing: i) the preliminary assessment of the impact that converting regional aircraft to hybrid-electric propulsion would have on emissions; and ii) the technological and methodological limitations in obtaining reliable estimates for these assessments. To comprehensively evaluate the environmental impact of hybrid-electric powertrains, it is essential to accurately characterise pollutant emissions over the entire operating envelope of the aircraft, considering both
 ${{C}}{{{O}}_{{2}}}$
and non-
 ${{C}}{{{O}}_{{2}}}$
substances. For turboshaft engines currently in use on full-thermal regional aircraft, there are established databases and predictive models that enable reasonably accurate estimations of these emissions [Reference Filippone and Parkes24, Reference Filippone and Bojdo25]. However, several recent studies indicate that hybrid-electric powertrains optimised to minimise fuel consumption may require thermal power system operating conditions that diverge significantly from current standard cases, as low power output or reduced fuel flow from the thermal engine during specific flight phases. It is thus critical to highlight the potential limitations and uncertainties of emission prediction models when applied to these non-standard or off-design operating regimes.
From a technological perspective, it is further emphasised that without a rapid and substantial shift toward fully renewable energy sources in ground-based electricity production, the introduction of hybrid-electric propulsion technologies alone may not be sufficient to achieve significant reductions in
 ${{C}}{{{O}}_{{2}}}$
emissions. This underscores the importance of a holistic approach to decarbonising the aviation sector, wherein advancements in propulsion systems must be accompanied by broader systemic changes in energy infrastructure. The discussion presented, which is based on conceptual studies, literature data and technological forecasts, aims to offer a qualitative overview that emphasises both the potential environmental benefits and the critical challenges associated with the practical development of hybrid-electric propulsion for regional aircraft, along with its broader environmental implications.
2.0 Material and methods
This section presents the methods and tools employed to achieve the results supporting the discussion in this paper. Specifically, Section 2.1 details the assumptions and requirements guiding the conceptual design of the regional aircraft; Section 2.2 provides a concise description of the conceptual design framework developed for sizing and analysing hybrid-electric regional aircraft. Sections 2.3 and 2.4 describe the models used to calculate both
 ${{C}}{{{O}}_{{2}}}$
and non-
 ${{C}}{{{O}}_{{2}}}$
emissions resulting from the operation of turboshaft engines.
2.1 Preliminaries and assumptions
Among the various transport aircraft categories, the regional transport sector is considered the most suitable for integrating hybrid-electric propulsion systems [Reference Abu Salem, Palaia and Quarta1]. Therefore, in this conceptual study, the design requirements are aligned with those of the ATR-42, a turboprop-powered regional aircraft designed to carry 40 passengers over a range of 200–600 nm. The cruise Mach number is set at 0.4, with a cruise altitude of 6,096 m. The aircraft is equipped with two propellers powered by hybrid-electric powertrains utilising a parallel architecture, which enables the thermal and electric sources to provide power independently to the propeller. Both the electric motor and the thermal engine are connected to the propeller via a gearbox. With an expected entry into service beyond 2035, the key performance parameters for the electric powertrain components are: a battery energy density (BED) of 500 Wh/kg at the pack level and an electric motor power density of 15 kW/kg. Further details on the requirements and assumptions underlying the aircraft design process can be found in Ref. [Reference Abu Salem, Palaia and Quarta1]. These parameters reflect forecasted technological advancements, which are critical to achieving the performance targets necessary for the successful integration of hybrid-electric systems into regional aircraft.
2.2 Hybrid-electric aircraft design
An in-house-developed multidisciplinary design procedure has been used for the conceptual design and performance analysis of hybrid-electric aircraft. The procedure enables integrates key interdisciplinary aspects that characterise the conceptual phase of the aircraft design process. Given that the primary objective of this paper is to examine the environmental impact of hybrid-electric regional aircraft, only a brief overview of the design methodology is provided here; for a more in-depth explanation of the methods employed, readers are referred to Refs [Reference Abu Salem, Palaia and Quarta1, Reference Palaia, Zanetti and Abu Salem26, Reference Palaia27]. The developed procedure performs the sizing of hybrid-electric aircraft starting from a set of top-level aircraft requirements (TLARs). The initial geometry of the lifting system is computed by means of a vortex lattice method (VLM)-based aerodynamic optimisation, see Refs [Reference Rizzo and Frediani28, Reference Abu Salem, Palaia and Cipolla29]. Subsequently, the configuration undergoes an iterative process aimed at achieving convergence on the maximum take-off weight (MTOW). Aerodynamic performance, including lift coefficient, induced drag, and stability derivatives, are computed using a VLM solver (see Ref. [Reference Drela and Youngren30]), while parasitic drag is estimated through established literature models [Reference Raymer31] and numerical procedures, see Ref. [Reference Drela and Youngren32]. The structural weight of the lifting surfaces is calculated via FEM-based surrogate models, as outlined in Refs. [Reference Cipolla, Abu Salem, Palaia, Binante and Zanetti33, Reference Palaia, Abu Salem, Binante and Carrera34]. The weights of the fuselage, landing gear, secondary structures, on-board systems and cabin furnishings are determined using semi-empirical models reported in Ref. [Reference Wells, Horvath and McCullers35]. The hybrid-electric powertrain is sized by constructing a matching chart, a diagram that relates wing loading (W/S) to specific power (P/W) across different phases of the mission, as described in Ref. [Reference Sforza36]. This chart plays a crucial role in identifying the appropriate balance between the electric and thermal powertrains, and the distribution of installed power between these two chains is governed by the hybridisation factor (
 ${H}_{{P}}$
) [Reference Pornet and Isikveren37], a design variable defined as:
 \begin{align}{{{H}}_{{P}}}{{\; = \;}}\frac{{{{P}}_{{i}}^{{e}}}}{{{{P}}_{{i}}^{{e}}{{\; + \;P}}_{{i}}^{{t}}}}\end{align}
where
 ${{P}}_{{i}}^{{e}}$
represents the installed electric power and
 ${{P}}_{{i}}^{{t}}$
denotes the installed thermal power. Following these multidisciplinary evaluations, a simulation of the design mission is conducted by time-integrating the point-mass equations of motion for the aircraft, as outlined in Ref. [Reference Palaia and Abu Salem38]. The results from the mission simulation allow the computation of all relevant flight performance metrics, including the quantities of fuel and battery mass required for the mission, as well as reserves. At this point, the design loop is iteratively refined until convergence on the MTOW is achieved.
When sizing a hybrid-electric aircraft, it is essential to establish an effective mission power supply strategy. This strategy should delineate the contributions of both thermal and electric systems to satisfy power requirements throughout the flight. In this study, the mission is segmented into sub-phases, with the power supply strategy defined as follows: during ground manoeuvres (i.e., taxi-out and taxi-in), only electric power is employed, to minimise local air pollution; during take-off, both electric and thermal power are supplied to provide the maximum available thrust; for climb, cruise and descent phases, the designer has the flexibility to adjust the ratios of thermal and electric power needed to meet varying power demands. In this work, the power fractions for these phases, namely
 ${{\varPhi }}_{{{cl}}}^{{t}}$
,
 ${{\varPhi }}_{{{cr}}}^{{t}}$
and
 ${{\varPhi }}_{{{de}}}^{{t}}$
, are determined by means of an optimisation procedure, formalised as follows:
 \begin{align}\left\{ {\begin{array}{*{20}{c}}{{{min}}\left( {{{FoM}}\left( {{x}} \right)} \right)}\\{{{\;0\; \lt \;}}{{{H}}_{{P}}}{{\; \lt \;0}}{{.7}}}\\{{{250\; \lt \;W/S\; \lt \;325}}}\\{{{0\; \lt \varPhi }}_{{{cl}}}^{{t}}{{ \lt \;0}}{{.56}}}\\{{{0\; \lt \varPhi }}_{{{cr}}}^{{t}}{{ \lt \;0}}{{.56}}}\\{{{0\; \lt \varPhi }}_{{{de}}}^{{t}}{{ \lt \;0}}{{.56}}}\\{{{\varPhi }}_{{k}}^{{e}} \lt {{\varPhi }}_{{{k,max}}}^{{e}}}\end{array}} \right.\end{align}
The optimisation, aimed at minimising the selected figure of merit (FoM), relies on a multi-start approach, which employs gradient-based optimum search algorithms for each considered starting point. The optimiser can manage the electric power share installed on board through the
 ${{{H}}_{{P}}}$
design variable, and can also search for the best power split supply strategy for the mission, by acting on the fraction of supplied thermal power
 ${{\varPhi }}_{{k}}^{{t}}$
, defined as:
 \begin{align}{{\varPhi }}_{{k}}^{{t}}{{\; = \;}}\frac{{{{P}}_{{k}}^{{t}}}}{{{{P}}_{{i}}^{{t}}}}\end{align}
where
 ${{P}}_{{k}}^{{t}}$
represents the thermal power supplied in the k-th mission phase. Considering a parallel powertrain architecture, knowing
 ${{\varPhi }}_{{k}}^{{t}}$
it is also possible to compute
 ${{\varPhi }}_{{k}}^{{e}}$
, i.e., the electric power fraction supplied in the same phase, as the total required power at each instant of the flight is known from the mission simulation module. The thermal engine efficiency has been considered constant throughout the mission, so the brake specific fuel consumption (BSFC) is assumed equal to 0.2675 kg/kWh. For a more detailed description, the reader can refer to Ref. [Reference Palaia and Abu Salem38]. The diversion phase, that is to be considered in the sizing process of a transport aircraft, is constrained by the designer to be carried out only with thermal power; indeed, diversion impacts on the aircraft and powertrain sizing, but it is only completed in very rare cases of emergencies or unforeseen occurrences. Hence, this design choice allows to prevent installing heavier battery pack that are left unused in standard operations (avoiding introducing severe snowball effect on aircraft MTOW), without affecting its effectiveness. Figure 1 reports a generic example of the mission time profile of the thermal and electric power supply for a regional hybrid-electric aircraft and the corresponding thermal and electric power fractions
 ${{\varPhi }}$
.
2.3 Non-
${{C}}{{{O}}_{{2}}}$
emissions assessment

The proposed method allows for the calculation of emissions of a transport aircraft during the ground (taxiing and take-off) and airborne (climb, cruise and descent) phases. The methodology has been applied to estimate the main non-
 ${{C}}{{{O}}_{{2}}}$
emissions resulting from engine operations and fuel combustion, namely nitrous oxide
 ${{N}}{{{O}}_{{x}}}$
, sulphur dioxide
 ${{S}}{{{O}}_{{2}}}$
, hydrocarbons HC, carbon monoxide CO and water vapour
 ${{{H}}_{{2}}}$
O. The method used in this work estimates the emissions by previously computing the emission index (EI), a parameter that indicates the mass of the pollutant emitted, measured in grams, per unit mass of fuel burned, measured in kilograms. The emissions of
 ${{S}}{{{O}}_{{2}}}$
and H2O are proportional to fuel flow and therefore have a constant EI, reported in Table 1.
EI of H2O and SO2

Example of flight time-profile of the thermal (top) and electric (bottom) power supply.

The estimation of CO, HC and NOx emissions is based on the Boeing fuel flow method 2 [Reference DuBois and Paynter41, Reference Baughcum, Tritz, Henderson and Pickett42], which adheres to the scheme shown in Fig. 2. Specifically, the following steps are carried out: i) use of flight data such as air density, temperature and Mach number which are taken from flight simulation analysis, ii) calculation of the reference fuel flow
 ${{\dot{m}}_{{{fr}}}}$
, iii) calculation of the reference emission index REI, iv) calculation of the emission index, v) calculation of the emission. The adjective ‘reference’ refers to the standard atmospheric conditions defined by ICAO, i.e. at sea level and temperature of 15°C.
Workflow to assess pollutant emissions.

As a first step, air pressure, temperature, flight Mach and fuel flow
 ${{\dot{ m}}_{{f}}}$
are taken from the flight simulation data of the mission under analysis. These data are used as input of the second step, which calculates the reference fuel flow by means of Equation (4):
 \begin{align}{{\dot{ m}}_{{{fr}}}}{{\; = \;}}{{\dot{ m}}_{{f}}}\frac{{{{{\theta }}^{{{3}}{{.8}}}}}}{{{\delta }}}{{{e}}^{{{0}}{{.2}}{{{M}}^{{2}}}}}\end{align}
where M is the flight Mach,
 ${{\delta }}$
is the ratio between the air pressure at the flight altitude and the reference air pressure,
 ${{\theta }}$
is the ratio between the air temperature at the flight altitude and the reference air temperature. Figure 3 shows the differences between the fuel flow and the reference fuel flow of the mission described in Section 2.1 the difference between the fuel flows emerges in the airborne phases, i.e. climb, cruise and descent.
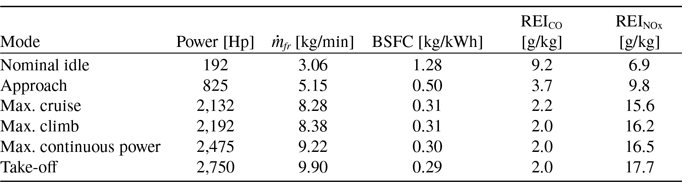
The REI is calculated from engine emission charts that report REI vs. the reference fuel flow (see Refs. [Reference DuBois and Paynter41, Reference Baughcum, Tritz, Henderson and Pickett42]); these data are typically obtained by the engine manufacturers by means of ground tests on the engine operating at different power levels, ranging from idle (7% of installed power) to take-off (100% of installed power). As an example, Table 2 shows data of the ground test for PW127M, a turboshaft used for current regional aircraft.
REI of PW127M [43]

Fuel flow and reference fuel flow vs time.

When dealing with the conceptual design of a novel aircraft, the emission curves of potential new engines are not available, and it is necessary to use models from the literature to reasonably estimate the REI. This is even more important when designing hybrid-electric aircraft, that may require thermal engines different that those typically used currently on aircraft of comparable category, and whose predicted emission outputs are not available. The research described in Ref. [Reference Filippone and Bojdo25] allows, thanks to the analysis of a large turboshaft/turboprop database, to estimate the REI of a wide range of engines already at the conceptual stage. Specifically, Ref. [Reference Filippone and Bojdo25] establishes that the REI (of CO, HC and
 ${{N}}{{{O}}_{{x}}}$
) depends on the engine pressure ratio
 ${{{P}}_{{r}}}$
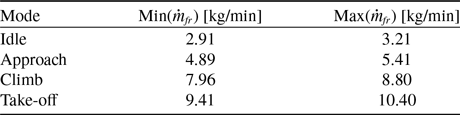
and the reference fuel flow and, accordingly, defines a mathematical relationship between REI, fuel flow and engine pressure ratio. This mathematical relationship, which can be represented in the form of a response surface, is generated in case of four different engine operating conditions, namely idle (ID), approach (AP), climb (CL) and take-off (TO), as shown in Fig. 4. The fuel flow boundaries for each operating condition, also reported in Table 3, are here obtained by varying the reference engine PW127M fuel flow values of Table 2 by ± 5% for each condition.
Maximum and minimum fuel flow values for each engine operating condition

REI of
 ${{N}}{{{O}}_{{x}}}$
of four operating configurations (idle, approach, climb and take-off) vs reference fuel flow and pressure ratio.

For the present study case, the value of
 ${{{P}}_{{r}}}$
is set equal to 15, in line with current values for engines used in regional aircraft [Reference Filippone and Bojdo25]. Hence, the data extracted from the response surfaces of Fig. 4 for the selected value of
 ${{{P}}_{{r}}}$
are plotted on a REI vs. reference fuel flow diagrams and an interpolation curve is identified for each pollutant substance. In particular, as reported in Ref. [Reference DuBois and Paynter41], it is assumed that CO and HC data are distributed according to an exponential (decreasing) trend, whereas
 ${{N}}{{{O}}_{{x}}}$
data are distributed according to a power function. Equations (5 and 6) has been used to fit the data, and the parameters a and b are determined by the least square method.
 \begin{align}{{RE}}{{{I}}_{{{CO - HC}}}}{{\; = \;a\;}}{{{e}}^{{{ - b}}{{{\dot{ m}}}_{{{fr}}}}}}\end{align}
 \begin{align}{{RE}}{{{I}}_{{{N}}{{{O}}_{{x}}}}}\; = \;a\dot { {m}}_{{{fr}}}^{{b}}\end{align}
Figure 5 depicts the fitting curves of Equations (5 and 6) together with the data of REI extracted from Ref. [Reference Filippone and Bojdo25], and Table 4 details the data of the parameters a and b and the R 2 value.
According to the selected boundaries for fuel flow, based on data relating to the PW127M, Equations (5 and 6) provide the REI value in the case of fuel flow ranging from 2.91 kg/min to 10.40 kg/min. Fuel flow values above or below these limits must be calculated by extrapolating the fitting curves; in particular, as can be inferred by Fig. 5, CO and HC REI estimates are not trivial for fuel flows below the lower limit. In fact, if data are extrapolated according to Equation (5), as shown in Fig. 6, we would have a very high REI prediction for the cases of very low fuel flow. Instead, a linear extrapolation shows that fuel flow values below 2.91 kg/min gives an estimation of the REI of CO and HC that may seem more plausible; however, a refined model for low values of fuel flow is necessary to rigorously provide reliable assessments. In fact, as stated in Ref. [Reference Schaefer and Bartosch44], special care must be taken when estimating the REI corresponding to fuel flow values at low engine power rating, which could lead to high REI estimate. In our study, a linear extrapolation was assumed.
a, b and R2 values

REI vs reference fuel flow of CO (top-left), HC (top-right),
 ${{N}}{{{O}}_{{x}}}$
(bottom).

Extrapolation of data at low reference fuel flow rates for CO (left) and HC (right).

The EI value at each time of the mission is now calculated using Equations (7 and 8), where H is a humidity correction factor. These equations represent the so-called Boeing fuel flow method 2, described in detail in Ref. [Reference DuBois and Paynter41, Reference Baughcum, Tritz, Henderson and Pickett42]. The emission E is then calculated by means of Equation (9), where t is the time extent of the mission.
 \begin{align}{{E}}{{{I}}_{{{CO - HC}}}}{{ = RE}}{{{I}}_{{{CO - HC}}}}\frac{{{{{\theta }}^{{{3}}{{.3}}}}}}{{{{{\delta }}^{{{1}}{{.02}}}}}}\end{align}
 \begin{align}{{E}}{{{I}}_{{{N}}{{{O}}_{{x}}}}}{{ = RE}}{{{I}}_{{{N}}{{{O}}_{{x}}}}}\sqrt {\frac{{{{{\delta }}^{{{1}}{{.02}}}}}}{{{{{\theta }}^{{{3}}{{.3}}}}}}} {{{e}}^{{H}}}\end{align}
 \begin{align}{{E = }}\mathop \smallint \nolimits_{{0}}^{{{\;\;t}}} {{EI}}{{\dot{ m}}_{{f}}}{{dt}}\end{align}
2.4
$\;{{C}}{{{O}}_{{2}}}$
emissions assessment

The emission of
 ${{C}}{{{O}}_{{2}}}$
(
 ${{{E}}_{{{C}}{{{O}}_{{2}}}}}$
) is calculated as follows:
 \begin{align}{{{E}}_{{{C}}{{{O}}_{{2}}}}}{{\; = \;E}}{{{I}}_{{{C}}{{{O}}_{{2}}}_{{f}}}}{{\;}}{{{m}}_{{{fb}}}}{{\; + \;E}}{{{I}}_{{{C}}{{{O}}_{{2}}}_{{e}}}}{{\;}}{{{m}}_{{b}}}{{(BED/1}}{{{0}}^{{3}}})\end{align}
where
 ${{E}}{{{I}}_{{{C}}{{{O}}_{{2}}}_{{f}}}}$
is the mass of
 ${{C}}{{{O}}_{{2}}}$
emitted per kilogram of fuel burned, set equal to
 ${{3}}{{.16}}$
kg/kg, see Ref. [Reference Overton45], and
 ${{\;}}{{{m}}_{{{fb}}}}$
is the block fuel mass.
 ${{E}}{{{I}}_{{{C}}{{{O}}_{{2}}}_{{e}}}}$
is the mass of
 ${{C}}{{{O}}_{{2}}}$
emitted per unit of kWh of electricity produced,
 ${{\;}}{{{m}}_{{b}}}$
is the battery mass and BED is the gravimetric battery energy density. Five different values of
 ${{E}}{{{I}}_{{{C}}{{{O}}_{{2}}}_{{e}}}}$
were considered, i.e. {0.42, 0.315, 0.21, 0.105, 0} kg/kWh; the highest value indicates the amount of emission per unit of electric energy production in line with the current energy mix [Reference Hoelzen, Liu, Bensmann, Winnefeld, Elham, Friedrichs and Hanke-Rauschenbach46], and the other values provide reduced emissions as a growing share of energy produced by renewable sources is considered, up to a future scenario in which the whole production is renewable-based, as expected by some policy makers, see Ref. [Reference Hainsch, Göke, Kemfert, Oei and Hirschhausen47, Reference Kougias, Taylor, Kakoulaki and Jäger-Waldau48].
3.0 Results
This section presents the results of the conceptual assessment of the emissions deriving from hybrid-electric regional aircraft operations, by considering the non-
 ${{C}}{{{O}}_{{2}}}$
(Section 3.1) and the
 ${{C}}{{{O}}_{{2}}}$
(Section 3.2) contributions.
3.1 Non-
${{C}}{{{O}}_{{2}}}$
emissions

This section presents the main results obtained using the methodology described in Section 2.2 and selecting the block fuel as objective function to be minimised within the optimisation process. Specifically, two different configurations are analysed, one full-thermal and one hybrid-electric. Both configurations were designed using the same conceptual design code and the same TLARs (see Section 2.1]; Table 5 shows the main data of the two configurations, including operating empty weight
 ${{{W}}_{{{oe}}}}$
and payload mass
 ${{{m}}_{{p}}}$
. The weight of electric components of the powertrain, i.e. electric motors and related inverters and power electronics is 286 kg, and the cable weight is 281 kg.
Main data of hybrid electric and thermal aircraft configuration

Figure 7-left shows the comparison of fuel flow throughout the mission between the full-thermal and the hybrid-electric configuration; in particular, the considered hybrid-electric configuration reduces fuel consumption in the climb and descent phases.Footnote 1 The detail of fuel flow for ground phases, i.e. taxi-out and take-off, is highlighted in Fig. 9-right: the hybrid-electric configuration shows a lower fuel consumption in take-off, and it is completely eliminated in during taxiing phase, as this stage is accomplished only with electric power.
Fuel flow vs. time, profile for the mission (left) and zoom on taxi and take-off (right).

EI vs time of CO (top-left), HC (top-right) and
 ${{N}}{{{O}}_{{x}}}$
(bottom).

 $\dot {{E}}$
vs time of CO (top-left), HC (top-right) and
 ${{N}}{{{O}}_{{x}}}$
(bottom).

The fuel flow directly affects the quantity of emissions; in particular, pollutants such as
 ${{S}}{{{O}}_{{2}}}$
and
 ${{{H}}_{{2}}}$
O (in form of water vapour) have a constant EI with respect to fuel flow, which implies that reductions in fuel consumption are proportional to these emissions. On the other hand, considering HC, CO and
 ${{N}}{{{O}}_{{x}}}$
emission indices, it is necessary to take into account how the related EI vary during the different phases of the mission. As shown in Fig. 5, the trends of the HC and CO curves are opposite to that of
 ${{N}}{{{O}}_{{x}}}$
; in fact, reductions in fuel flow generate an increase (reduction) in the REI of HC and CO (
 ${{N}}{{{O}}_{{x}}}$
). Figure 8 show how HC, CO and
 ${{N}}{{{O}}_{{x}}}$
EI vary in case of the considered test-cases of hybrid-electric and full-thermal aircraft. The results show that during climb and descent, the lower fuel flow required to the thermal engine of the hybrid-electric powertrain results in higher
 ${{E}}{{{I}}_{{{HC}}}}$
and
 ${{E}}{{{I}}_{{{CO}}}}{{\;}}$
than the thermal aircraft. The opposite occurs in the case of
 ${{E}}{{{I}}_{{{NOx}}}}$
, which results lower for hybrid-electric aircraft. During the cruise phase, the hybrid-electric aircraft burns an amount of comparable fuel to the thermal configuration, this reflects in a quite similar situation for cruise EI of HC, CO and
 ${{N}}{{{O}}_{{x}}}$
.
Figure 9 depicts the emission rate
 $\dot {{E}}$
(i.e. the time derivative of the emission, calculated as reported in Equation 11) of CO, HC and
 ${{N}}{{{O}}_{{x}}}$
throughout the mission. This results qualitatively summarise both the effects of the trends of fuel flow and EI, cf. Figs. 7 and 8.
 \begin{align}{\dot E = EI\;\dot {{m}}}\end{align}
The absolute values of fuel consumption and corresponding emissions calculated in each phase of the mission are shown in Table 6. The data show that the hybrid-electric aircraft, thanks to its overall lower fuel consumption, allows to reduce emissions of all pollutants if the whole mission budget is considered. Analysing the mission phase breakdown, it is shown that during the taxiing phase, there is a 100% reduction of emissions, as this phase is accomplished using only the electric propulsion. During the take-off and climb phases, emissions are reduced, except for HC and CO; this is related to the results shown in Fig. 9 (top-left, top-right), that highlight the higher emission rate of the hybrid-electric aircraft for these substances; however, in the overall mission budget for these pollutants, the impact of these phases is minor. In general, this highlights that current turboshaft may underperform for off-design conditions for changed applications, as hybrid-electric powertrains. This opens the field for tailored development of thermal power units for these applications. During the cruise phase, fuel consumption is slightly higher for the hybrid-electric configuration, resulting in increased emissions of pollutants proportional to the fuel flow for
 ${{S}}{{{O}}_{{2}}}$
and
 ${{{H}}_{{2}}}$
O, and increase of
 ${{N}}{{{O}}_{{x}}}$
emission, but a reduction in HC and CO emissions. In the descent phase, a reduction of all pollutants is observed. This latter aspect highlights the fact that although the EI of pollutants such as HC and CO can be higher for the hybrid-electric aircraft (see Fig. 8], the lower fuel flow could allow a reduction in the overall emission.
Emission data of hybrid-electric (HEA) and reference thermal aircraft for the entire mission

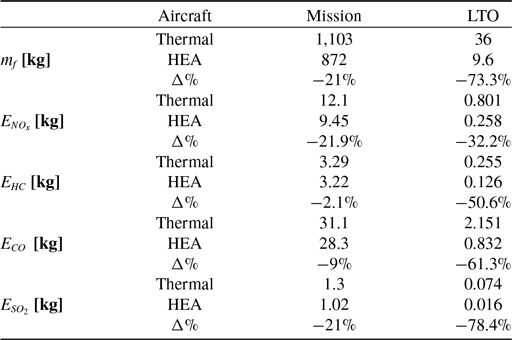
An important aspect to be analysed is the emission assessment for the take-off and landing (LTO) cycle, which includes the taxiing, take-off and climb phase up to an altitude of 915 m [Reference Brooker16]. This aspect is of particular interest for the improvement of the local air quality. The data are presented in Table 7 and show that the hybrid-electric aircraft can provide room to reduce emissions of all pollutants both in the whole mission and in the LTO.
Emission data of hybrid-electric and reference thermal aircraft for LTO

3.2
${{C}}{{{O}}_{{2}}}$
emissions

This section presents the results for hybrid-electric configurations, designed according to the methodology described in Section 2.2, and optimised to minimise
 ${{C}}{{{O}}_{{2}}}$
emissions, estimated by Equation (10). Five different scenarios are considered:
 ${{C}}{{{O}}_{{2}}}_{{e}}$
, namely the emission related to the generation of the electricity, and in the following also named ‘indirect emissions’, is considered varying starting from the scenario based on the current mix of energy sources; in this case
 ${{C}}{{{O}}_{{2}}}_{{e}}$
is equal to 0.42 kg/kWh. For the other scenarios,
 ${{C}}{{{O}}_{{2}}}_{{e}}$
is decreased up to the value of 0 kg/kWh, hence the case of the whole electricity production is based on renewable sources. The intermediate scenarios represent energy mix with an increasing share of renewable-based electric energy production; the selected
 ${{C}}{{{O}}_{{2}}}_{{e}}$
values are [0.42, 0.315, 0.21, 0.105, 0] kg/kWh for the scenario labels named as [V IV III II I]. The values for the different scenarios adopted in this work are extracted from the data reported in Ref. [Reference Hoelzen, Liu, Bensmann, Winnefeld, Elham, Friedrichs and Hanke-Rauschenbach46]. To provide a general overview of the regional market, four different ranges are used to design and optimise different hybrid-electric regional aircraft, namely 200, 400, 600 and 800 nm.
To evaluate the actual effects of the hybrid-electric propulsion in terms of overall climate impact reduction, it is necessary to assess the impact that optimised regional aircraft have in terms of
 ${{C}}{{{O}}_{{2}}}$
emissions reductions compared to a full-thermal benchmark. Figure 10 reports the outputs of
 ${{C}}{{{O}}_{{2}}}$
emissions for the different five scenarios adopted in this conceptual study; the emissions breakdown is divided between those related to the in-flight fuel combustion and those deriving from electricity production; the
 ${{C}}{{{O}}_{{2}}}$
values related to the thermal competitors are marked by a grey star in the charts. Some general but clear conclusions can be extracted by analysing the outcomes presented in Fig. 10: i) in the current scenario, named ‘Scenario V’ (see left part of Fig. 10], some limited
 ${{C}}{{{O}}_{{2}}}$
emissions reductions can be obtained from the introduction of hybrid-electric propulsion only for very short routes, i.e. 200 nm, whereas for routes longer than 200 nm practically no noticeable benefits are detected. Indeed for progressively increasing design ranges, the optimised configuration minimising the
 ${{C}}{{{O}}_{{2}}}$
emissions is almost coincident with a full-thermal solution, without thus deviating from the state-of-the-art option. It therefore becomes clear that the indirect contribution of
 ${{C}}{{{O}}_{{2}}}$
emissions has a decisive impact on the actual benefits to be expected from the technological implementation of electric propulsion; ii) in the case of the intermediate scenarios having gradually reduced indirect emissions
 ${{C}}{{{O}}_{{2}}}_{{e}}$
contributions, i.e. ‘Scenarios IV, III, II’, the reduction in
 ${{C}}{{{O}}_{{2}}}$
resulting from the introduction of hybrid-electric propulsion provides potential gains also for the 400 nm design range. Also in these scenarios, thus, the indirect contributions to
 ${{C}}{{{O}}_{{2}}}$
emissions prevent to achieve actual benefits for longer ranges; iii) finally, in the ‘Scenario I’, in which electricity production is entirely relying on renewable sources (see right part of Fig. 10], a total cut of
 ${{C}}{{{O}}_{{2}}}$
emissions is achieved up to 400 nm, a halving of emissions for the 600 nm design range, while no benefits are obtained for longer flight distances, where again a solution similar to the full-thermal one is found. In this latter case, as there are not indirect emissions, the reason of this result relies on the technological limitations of the batteries, that for longer routes would introduce severe increments of weight, preventing the aircraft from having better performance than a state-of-the-art configuration.
Breakdown of
 ${{C}}{{{O}}_{{2}}}$
emissions of the optimised configurations for the five scenarios.

To better frame the optimiser’s results and assess the scenario impact on aircraft design, two key outcomes deserve attention: the power supply split during the mission and the used energy sources. As demonstrated in Ref. [Reference Abu Salem, Palaia and Quarta1], the primary impact on regional hybrid-electric aircraft performance is the thermal/electric power supply split during cruise. The outcomes of Ref. [Reference Abu Salem, Palaia and Quarta1], in a nutshell, claim that the larger the electric power share supplied at cruise, the higher the reduction in fuel consumption, but also the larger the increase in aircraft weight due to the presence of the heavy battery packs. This becomes more relevant for longer ranges. In addition to these considerations, it is possible to assess how the
 ${{C}}{{{O}}_{{2}}}$
emissions used as an objective function and how the varying contribution of
 ${{C}}{{{O}}_{{2}}}_{{e}}$
have an impact on these results. The results show that, in the case of Scenario V, electric power is used in cruise only for the 200 nm mission; a small fraction of electric power is supplied in the standard mission for the 400 nm case as well, while the cruises covering longer distances are all accomplished by means of thermal power supply only. It should be noted that the power fractions supplied in the various mission phases are among the design variables managed by the optimiser. The time profile of the power supply of both the thermal and the electric chains, for the five different scenarios and the four different ranges considered, are reported in Appendix A. These results show that the introduction of hybrid-electric propulsion introduces no benefits in terms of
 ${{C}}{{{O}}_{{2}}}$
emissions, except for very short distances, if the ground-based scenario remains at the status quo in terms of electricity production. Improving the context of indirect emissions, thus moving from Scenario V towards Scenario I, allows hybrid-electric propulsion to introduce benefits also for the 400 nm route, where the optimiser finds solutions exploiting electric power to accomplish the cruise phase. The situation is different for the 600 nm, where only a fully renewable-based scenario allows the full exploitation of hybrid-electric propulsion to reduce
 ${{C}}{{{O}}_{{2}}}$
emissions. In any scenario, the introduction of this technology leads to no benefits in the case of longer routes, i.e. 800 nm, where the supply of thermal power is therefore favoured; it is the BED of batteries that introduces these limitations.
Related considerations can be made by commenting on the amount of energy sources mass (batteries and fuel) to be taken on board to accomplish the standard mission of the optimised configurations, as shown in Fig. 11. The fully renewable-based Scenario I provides solutions with very high masses of batteries, proving that meeting the energy demand of the flight using electric energy is a favourable solution in terms of reduction of
 ${{C}}{{{O}}_{{2}}}$
emissions; as mentioned before, this applies up to 600 nm, while increases in range would lead to increases in battery mass that would undermine the feasibility of the aircraft. In all scenarios, the optimiser tends to reduce, as much as possible, block fuel consumption in the 200 nm and 400 nm reference flight cases. It should also be noted that the BED of the batteries introduces strong penalties in terms of aircraft weight; in the future Scenario I, although benefits can be obtained from an emissions perspective on a 600 nm reference mission, this will only be possible with massive increases in MTOW, see Fig. 12. This aspect introduces strong penalties in terms of operating cost and design development, as discussed in Ref. [Reference Abu Salem, Palaia and Quarta49], and must be strongly taken into account from the early stages of conceptual and feasibility studies for this type of aircraft. Indeed, battery allocation may be a non trivial issue which has to be addressed in the design process; as shown in Ref. [Reference Abu Salem, Palaia and Quarta1], the battery pack can be housed within the fuselage, below the passenger floor. A detailed assessment of the aircraft centre of gravity remains essential, as battery positioning plays a crucial role in achieving a balanced and effective aeromechanical design. Furthermore, the increased weight necessitates a larger wing area and, in particular, an increased wingspan, potentially exceeding the ICAO Category C limit (36 m), typical for aprons dedicated to regional aircraft. This represents critical constraints since, if not met, affects compatibility with current infrastructural constraints, compromising aircraft operating capabilities. Aircraft low-speed performance is another critical aspect, and a detailed design of high-lift system should prove the aircraft capability to fulfil constraints on take-off and landing.
Breakdown of energy sources mass of the optimised configurations for the five considered scenarios.

MTOW of the optimised configurations for the five considered scenarios.

4.0 Discussion
In this section some final remarks of the previous discussion are reported. In this study, the emissions of the main pollutants deriving from the combustion of jet fuel into a thermal engine have been estimated. Specifically, the framework developed uses the method proposed by Boeing [Reference DuBois and Paynter41] coupled with the model proposed in Ref. [Reference Filippone and Bojdo25]. This model was used to compare the emissions of a thermal aircraft and a hybrid-electric aircraft sized using the same design methodology. The results obtained show that hybrid-electric aircraft could provide the possibility to reduce emissions of all pollutants in the whole mission and also in the LTO cycle, as shown in Fig. 13.
Percentage variation of emission for the mission and the LTO cycle between hybrid-electric and thermal aircraft.

In particular, the strategy of accomplishing the taxiing phase by using the only electric power allows a significant reduction in pollutants in the LTO cycle. However, some limitations of the proposed methodology should be raised: the estimation of hybrid-electric aircraft emissions is not trivial in case of fuel flow lower than current state-of-the art values; in fact, current models do not consider these data, and extrapolations are necessary. Extrapolating data is not a reliable operation when the physical boundaries of the problem are unknown, and this could lead to undetectable errors. The development of novel physics-based models is essential for this purpose.
Regarding
 ${{C}}{{{O}}_{{2}}}$
emissions, the overview proposed in Section 3.2, even if conceptual, indicates that introducing hybrid-electric propulsion on regional aircraft, considering currently available battery technology forecasts, does not distinctively lead to the necessary environmental targets to be achieved in the near future. Short and extra-short flights are more suitable to achieve
 ${{C}}{{{O}}_{{2}}}$
emissions reductions, but if a significant benefit is to be achieved from the adoption of this technology, a fundamental conversion of the entire energy system is necessary, transitioning swiftly towards a scenario where electricity production relies exclusively on renewable sources.
5.0 Conclusion
This paper aimed to introduce and discuss methods for estimating emissions from hybrid-electric aircraft, focusing on the connected potential environmental benefits and also on the challenges related to limitations of the available approaches. Specifically, this study addressed the impact of introducing hybrid-electric propulsion for regional transport aircraft in terms of pollutant and greenhouse emissions. This impact is quantitatively assessed by comparing the results with those of a comparable reference full-thermal powered configuration. The models used are based on in-house conceptual aircraft design tools and emissions models and database available in the literature. From a methodological perspective, it emerges that there is the need to increase the reliability and resolution of predictive emission models in order to obtain increasingly accurate emissions estimates. Considering the environmental performance, the main outcomes show that:
-
• the hybrid-electric aircraft, sized through an optimisation procedure that considers block fuel as figure of merit, allows for emissions reductions for all the main pollutants, both over the entire mission and in the LTO cycle;
-
• the hybrid-electric aircraft, optimised to minimise both direct (flight-related) and indirect (electricity generation-related) CO2 emissions, shows a reduction in CO2 emissions for ranges under 400 nm, based on the current electric power generation scenario. A shift towards renewable-based electricity generation could extend these benefits to ranges up to 600 nm. However, for longer ranges, such as 800 nm, hybrid-electric propulsion becomes ineffective due to the weight penalties introduced by the batteries.
The proposed results indicate that the hybrid-electric aircraft could have a potential to contribute to the decarbonisation of the regional transport sector and to the improvement of local air quality. However, it must be stressed that the development of hybrid-electric aircraft is strictly dependent on the technological development of the electric components, in particular the batteries, and to the improvement of the ground-based scenario. From an actual impact assessment standpoint, models that translate emissions into metrics directly related to climate change and global warming can be introduced as figures of merit steering the conceptual optimisation of hybrid-electric aircraft.
Competing interest
The author(s) declare none.
Appendix
This Appendix provides insight on the time profiles of power supply, both electrical and thermal, for the optimised configurations discussed in Section 3.2. These profiles are shown in Fig. 14.
Mission time-profile of thermal and electric power supply for the optimised configurations in the five considered scenarios.