Introduction
The long-term psychological and physical trauma caused by female genital mutilation (FGM) and the world-wide advocacy to eradicate the practice have led researchers to adopt different analytical procedures to examine the origin, types and factors that favour the practice, especially in the developing world (Foster, Reference Foster1992; Obi, Reference Obi2004; Jeremiah et al., Reference Jeremiah, Kalio and Akani2014; Setegn et al., Reference Setegn, Lakew and Deribe2016). However, since FGM data are usually collected over several locations and thus geo-referenced, most of the adopted methods, especially classical linear regression or correlation estimations, assume that the relationships being modelled are the same everywhere, thereby estimating, for each variable under consideration, a single value for all study locations. Thus, information about possible local variations that show how the variables exact influence across different locations is concealed. Due to the marked differences in local context and characteristics of most geographical settings in developing countries like Nigeria, there is sufficient evidence to believe that the factors that drive the continued practice of FGM vary spatially. Existing theories have suggested that demographic and health indicators vary in accordance with how they are influenced by economic structures, culture, social interactions and policy implementation strategies (Axinn & Yabiku, Reference Axinn and Yabiku2001; Gayawan & Turra, Reference Gayawan and Turra2015). Thus, it could be misleading to summarize the relationship between FGM and social, economic, cultural or policy-related factors with any modelling technique that subjects different locations to uniform treatment.
The existence of massive inequality in demographic and socioeconomic status of the populace of most sub-Saharan African countries, coupled with marked differences in cultural values, have bred lopsided patterns of most health indicators based of geographical location in the region (NPC et al., 2012; Adebayo et al., Reference Adebayo, Gayawan, Ujuju and Ankomah2013; Gayawan et al., Reference Gayawan, Adarabioyo, Okewole, Fashoto and Ukaegbu2016). The risk factors of any health indicator are equally expected to vary according to locations since most communities are made up of people who share similar social beliefs and cultural practices, which in turn dictate the tune of their lifestyles, thereby enhancing or inhibiting their well-being. To this end, the analysis of the spatially varying relationships among the factors that drive attitudes towards the continued practice of FGM in Nigeria, which is the main focus of this study, provides a valuable tool that can aid the identification of geographical areas with similar influence, thus exposing locations with high or low risks.
Background to FGM in Nigeria
The practice of FGM has continued unabated in most sub-Saharan African countries despite the strong advocacy against it. In places where it is commonly practised, it is becoming a major part of people’s social life. Some of the populace have considered it a way of life because their elders and village heads believe in it while others do so because their mothers practised it (Foster, Reference Foster1992; Freymeyer & Johnson, Reference Freymeyer and Johnson2007). There are cultures that hold the view that FGM enhances the well-being and sexual pleasure of both men and women, while others believe it increases fertility and improves the health of an unborn child (Van der Kwaar, 1992). A study among Yoruba-speaking women living in rural areas of the South West region of Nigeria reported about 77% of women believed that their circumcision lowered the potential dangers to an unborn child, while less than 10% realized the increased risks of childbearing after being cut (Orubuloye et al., Reference Orubuloye, Caldwell and Caldwell2000). In Port Harcourt city in Nigeria, Jeremiah et al. (Reference Jeremiah, Kalio and Akani2014) found reduction of sexual passion in order to preserve virginity until marriage as a reason for cutting women. Other reasons for the practice include religious requirement, a prerequisite for marriage and initiation of girls into womanhood (Simister, Reference Simister2010; Kandala & Komba, Reference Kandala and Komba2015). However, the consequences for the victims are enormous. The rate of transmission of HIV following FGM has been found to increase (Klouman et al., Reference Klouman, Manongi and Klepp2005). It can increase complications in childbirth and result in maternal death. Other consequences include severe pain, haemorrhage, tetanus infection, infertility, urinary incontinence, severe sexual problems and psychological issues including bitterness, anger and feelings of betrayal (Population Reference Bureau, 2017).
The World Health Organization classified FGM into four types: excision of the prepuce with or without excision of part or all of the clitoris (Type I); excision of the clitoris with partial or total excision of the labia minora (Type II); infibulation – the excision of part or all of the external genitalia and stitching or narrowing of the vaginal opening (type III); and any other form including pricking, piercing or incision of the clitoris and/or labia, burning of the clitoris and surrounding tissue, scraping of tissue surrounding the opening of the vagina (angurya cuts) or cutting of the vagina (gishiri cuts), and introduction of corrosive substances or herbs into the vagina to cause bleeding or to tighten or narrow the vagina (Type IV). The three major forms of FGM in Nigeria are female circumcision, angurya cuts and gishiri cuts (Mandara, Reference Mandara2004).
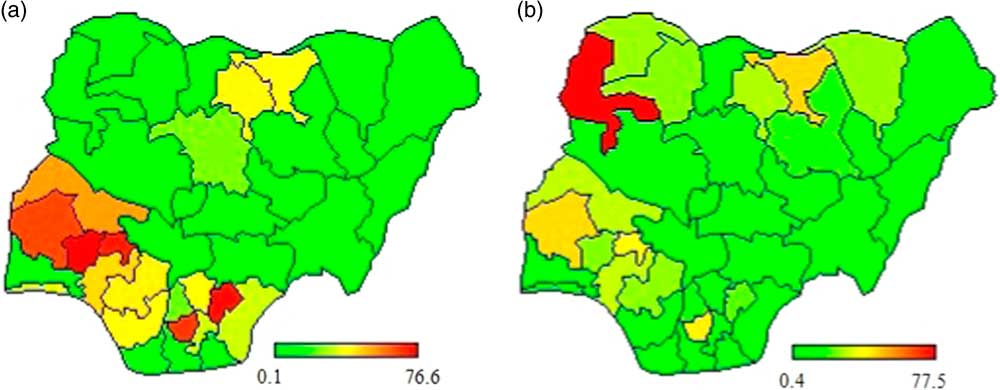
Notwithstanding the harmful nature of FGM, it was only recently that a federal law, the Violence Against Persons (Prohibition) Act 2015, outlawing the practice was enacted in Nigeria. The law is, however, only applicable to the Federal Capital Territory (FCT), Abuja. In the states, some state governments have equally enacted laws prohibiting FGM, yet the practice continues in many parts of the country. The most recent Nigeria Demographic and Health Survey (NDHS) conducted in 2013 reported a national FGM prevalence rate of about 25%, but with huge geographical variations, showing a prevalence of as low as 0.1% in Katsina and as high as 77% in Osun. Figure 1a presents the prevalence rates for all Nigerian states and the FCT, demonstrating this variation.
Maps of Nigeria showing (a) the prevalence of FGM and (b) support for continuation of FGM.
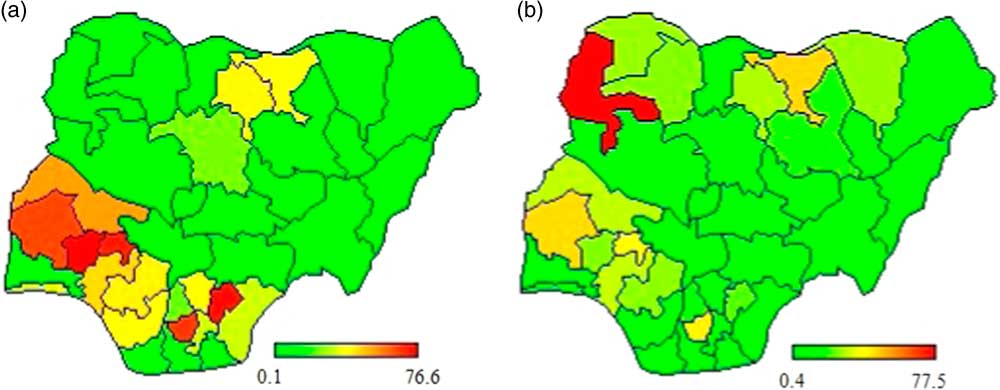
The majority of the victims of FGM in Nigeria are minors who are cut very early in life, and are thus incapable of consenting to it, thereby seriously abusing their human rights. Of the circumcised women in the country, the NDHS showed that 82% were cut before the age of 5 years. The report further showed that nationally, about 23% of women and 27% of men interviewed expressed support for its continuation. Again, the proportion of those supporting FGM varied substantially across states, with 0.4% and 77.5% of women supporting its continuation in Katsina and Kebbi states, respectively. Figure 1b presents the spatial variations in the proportion of women across the country who expressed support for continuation of the practice. With worsening poverty levels and low budgetary provisions for the health sector, the country would certainly be unable to bear the health burden and cost implications arising from complications of FGM.
There are scholarly interests in analysing the spatial variations in FGM practice in Nigeria and other African countries (Kandala et al., Reference Kandala, Nwakeze and Kandala2009, Reference Kandala, Kinyoki, Sarki, Gathara, Komba and Shellduncan2017; Achia, Reference Achia2014; Kandala & Komba, Reference Kandala and Komba2015; Setegn et al., Reference Setegn, Lakew and Deribe2016). These studies confirmed the existence of spatial heterogeneity in the practice across locations. For effective intervention strategies, policymakers are not only interested in understanding the geographical distributions of health outcomes, but also how the possible determinants of these outcomes exact influence across different geographical locations. Therefore the mapping of FGM risk factors across the Nigerian states becomes valuable, as this would expose locations where these determinants have unmatched influence on the support for FGM practice in the country, where about 20 million women and girls have been, or are at high risk of being, cut (UNICEF, 2013, 2016).
Methods
Data
The study relied on data from the 2013 NDHS, the fifth DHS to be conducted in Nigeria, implemented by the country’s National Population Commission with technical support provided by ICF International. The survey, aimed at providing data to monitor the population and health situation in Nigeria with the objective of providing reliable information about maternal and child health, collected representative data from the country’s 36 states and the Federal Capital Territory, Abuja. The intention was to provide policymakers and programme managers with guiding tools for evaluating and designing programmes and strategies for the improvement of health and family planning services in the country.
The list of enumeration areas (EAs) used for the 2006 Population and Housing Census of the Federal Republic of Nigeria was adopted for the purpose of the survey. The clusters were defined on the basis of the EA census frame while the sample was selected using a stratified three-stage cluster design comprising 904 clusters – 372 in urban areas and 532 in rural areas. A minimum of 943 households were interviewed in each of the 36 states and the FCT. All women aged 15–49 who were either permanent residents of the selected households or visitors present on the night before the survey were eligible to be interviewed. In all, a total of 39,902 women were identified as eligible for individual interviews, and 98% of them were successfully interviewed. The 2013 NDHS collected information about FGM in Nigeria from all the interviewed women. The topics covered included knowledge and prevalence of FGC, type of circumcision, age at female circumcision and attitudes towards the practice of circumcision. The variable of interest was ‘support for continuation of FGM’. The binary indicator took the value 1 if a woman respondent supported the continuation of FGM and 0 if otherwise.
Statistical analysis
Geographically Weighted Regression (GWR) was adopted to explore the spatially varying relationship between attitude towards the continuation of FGM and relevant socioeconomic variables. Considering the binary nature of the variable of interest, Geographically Weighted Logistic Regression (GWLR) was considered appropriate. Basically, following Fotheringham et al. (Reference Fotheringham, Brunsdon and Charlton2002), the GWR model is given by
 $$y_{i} {\equals}\beta _{{0i}} \left( {u_{i} ,v_{i} } \right){\plus}\mathop{\sum}\limits_{j{\equals}1}^k {\beta _{{ji}} \left( {u_{i} ,v_{i} } \right)x_{{ji}} {\plus}{\varepsilon}_{i} } $$
where y i is the response variable, (u i, v i) are the co-ordinates of the centroid of state i and β ij is the location-specific coefficient for the j th predictor for state i. In the case of a binary response, let π ik be the probability that the k th individual from state i favours the continuation of FGM, then:
 $$\pi _{{ik}} {\equals}{{e^{{\beta _{0} \left( {u_{i} ,v_{i} } \right){\plus}\mathop{\sum}\limits_{j{\equals}1}^k {\beta _{{ji}} \left( {u_{i} ,v_{i} } \right)x_{{ji}} } }} } \over {1{\plus}e^{{\beta _{0} \left( {u_{i} ,v_{i} } \right){\plus}\mathop{\sum}\limits_{j{\equals}1}^k {\beta _{{ji}} \left( {u_{i} ,v_{i} } \right)x_{{ji}} } }} }}$$
So that
 $$\ln \left( {{{\pi _{{ik}} } \over {1{\minus}\pi _{{ik}} }}} \right){\equals}\beta _{{0i}} \left( {u_{i} ,v_{i} } \right){\plus}\mathop{\sum}\limits_{j{\equals}1}^k {\beta _{{ji}} \left( {u_{i} ,v_{i} } \right)x_{{ji}} {\plus}{\varepsilon}_{i} } $$
An important aspect of GWR is the determination of the weighting function for estimating localized parameters. The functions are based on the distance between the various locations such that the weights vary based on the location point of state i, which reflects the proximity of each data point to the location of i, whereby more weights are assigned to points with closer proximity. Thus, regression coefficients are estimated independently for each location using a location-specific weighting scheme. Based on Fotheringham et al. (Reference Fotheringham, Brunsdon and Charlton2002), a number of kernels are possible for computing the weighting function w(u i, v i). The two major kernels are the Gaussian and the bi-square functions. The Gaussian function used in this study is given by:
 $$w_{{ij}} {\equals}Exp\left[ {{\minus}{1 \over 2}\left( {{\raise0.7ex\hbox{${d_{{ij}} }$} \!\mathord{\left/ {\vphantom {{d_{{ij}} } b}}\right.\kern-\nulldelimiterspace}\!\lower0.7ex\hbox{$b$}}} \right)} \right]$$
where d ij denotes the distance between locations i and j, and b is a fixed parameter for the bandwidth (smoothing parameter), which controls for the variance in the weighting function. Similar to the classical logistics regression, parameters of the GWLR are estimated using iterative numerical methods. The glm function in R statistical software was used for parameter estimation in the study.
Results
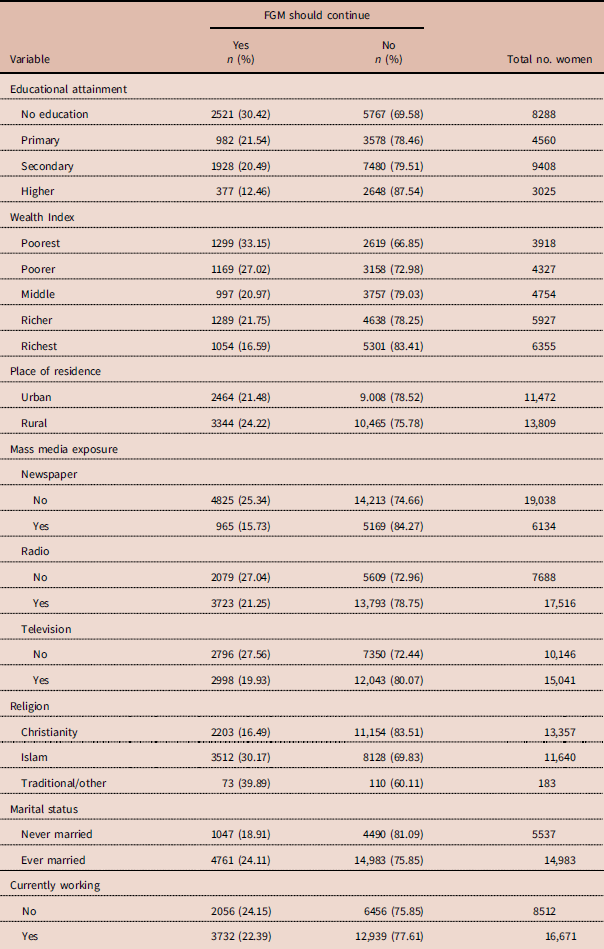
Table 1 presents the frequency distribution of the study women by their views on the continuation of FGM in the country. The proportion of women who supported the continuation of the practice reduced with increase in level of education. About 30% of women who had no education supported its continuation, whereas 12% did so among those who attained a higher level of education. Findings on household wealth were similar, with the proportion of women supporting FGM reducing from about 33% among the poorest to 17% among the richest households. About 21% of women residing in urban areas expressed support for female cutting, against 24% of those in rural areas. The proportion of women supporting cutting was lower among women with access to any of radio, newspaper or television at least once a week compared with their counterparts without such access. About 40% of women belonging to traditional/other religious groups supported the continuation of FGM, whereas only 16% and 30% of those from Christian and Islamic religious groups, respectively, held this view. The proportion of those in support of the continuation of FGM was higher among ever-married (24%) than among never-married (19%) respondents. However, it was slightly lower among working women (22%) than among those who were not working (24%).
Frequency distribution of study women (percentages in parentheses) based on their view on the continuation of FGM in Nigeria

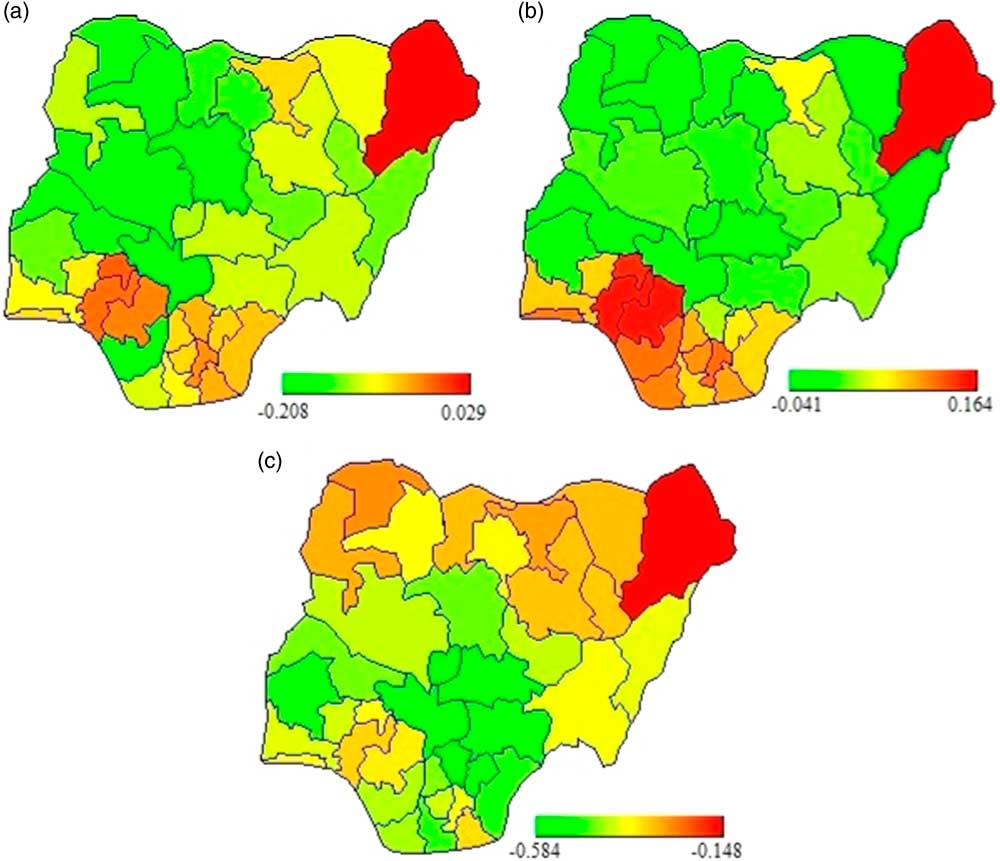
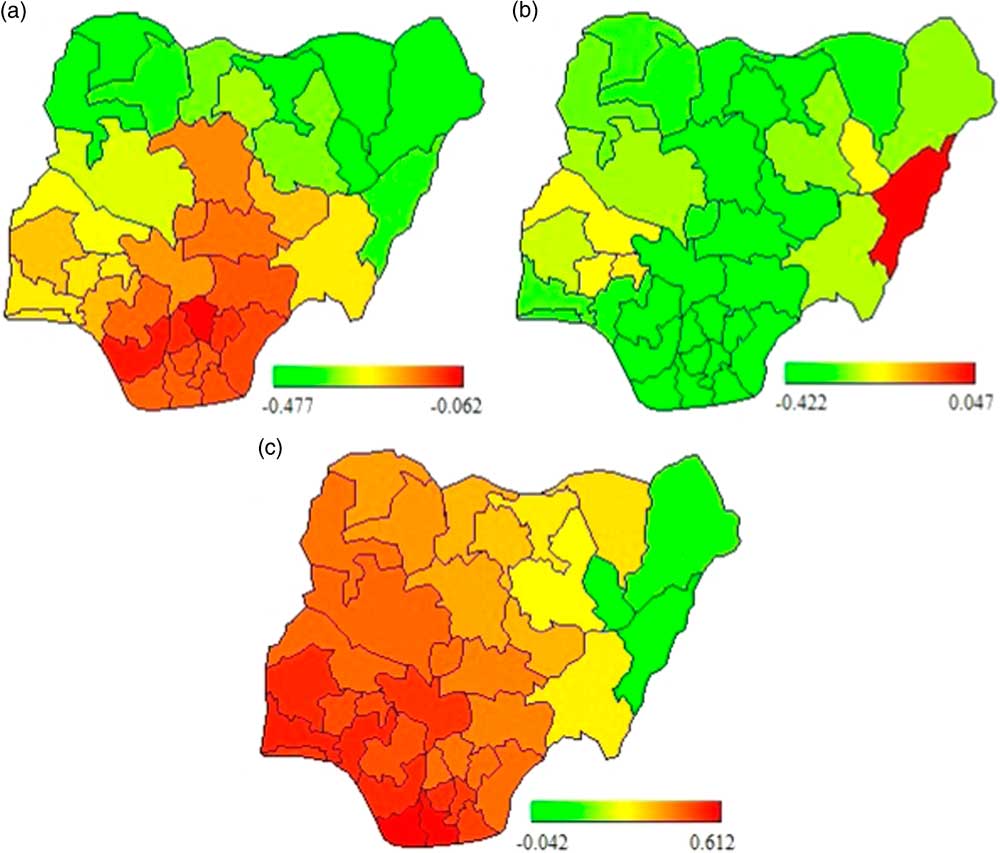
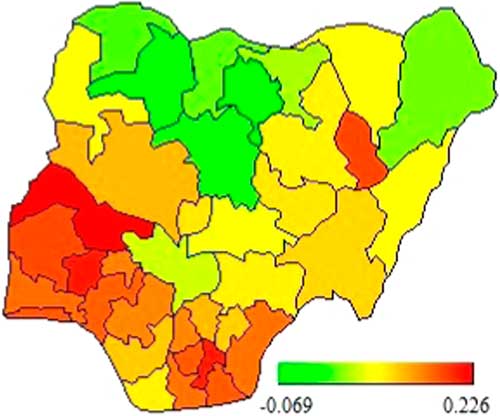
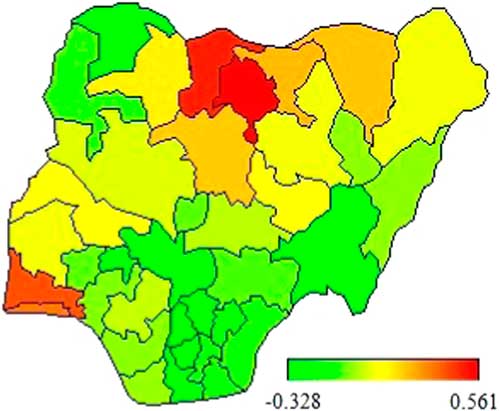
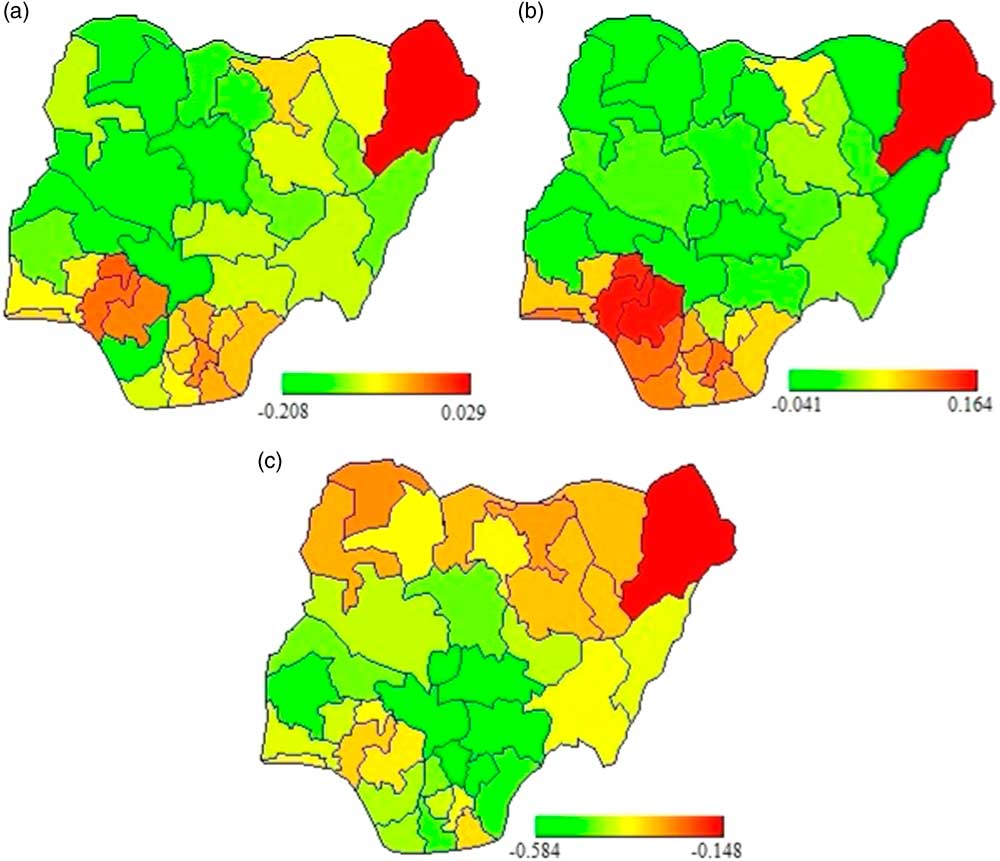
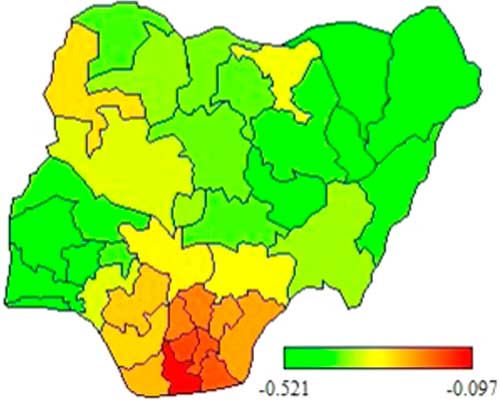
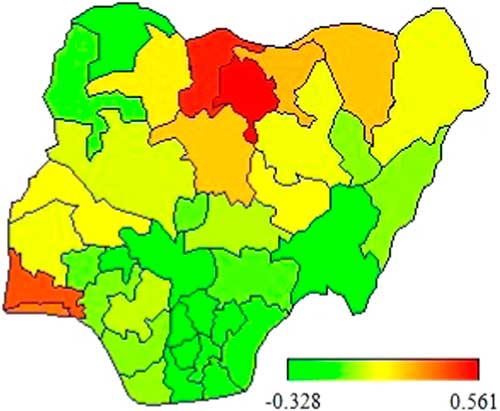
The results of the spatial analysis are presented in Figures 2–9. The maps show the marginal effects of each variable on women’s support for FGM, after controlling for other effects. Figure 2 shows that possessing primary or secondary education has varying effects on the attitude towards continuation of FGM across states when compared with having no education. Whereas this has positive effects in some states, the effect is negative in others. For instance, women from many of the southern states such as Ekiti, Ondo, Edo, Lagos, Delta, Bayelsa, Imo, Abia, and Borno in the North East region, who had attained primary or secondary education were more likely to support the continuation of FGM, but their counterparts from Kogi, Kwara, Niger, Kaduna, Sokoto, Zamfara, Adamawa, Yobe and Nasarawa were less likely to do so. On the other hand, throughout the country, women with a higher level of education were less likely to express support for FGM (Fig. 2c). Similarly, women residing in rural areas throughout the country were less likely to support the continuation of FGM compared with those from urban areas (Fig. 3).
Marginal effects of women’s educational level (with ‘no education’ as reference) on level of support for the continuation of FGM by Nigerian states: (a) primary; (b) secondary; and (c) higher level education. The bars indicate the lowest and highest values of marginal estimates.
Marginal effects of rural–urban residency (with ‘urban’ as reference) on level of support for continuation of FGM by Nigerian states. The bars indicate the lowest and highest values of marginal estimates.
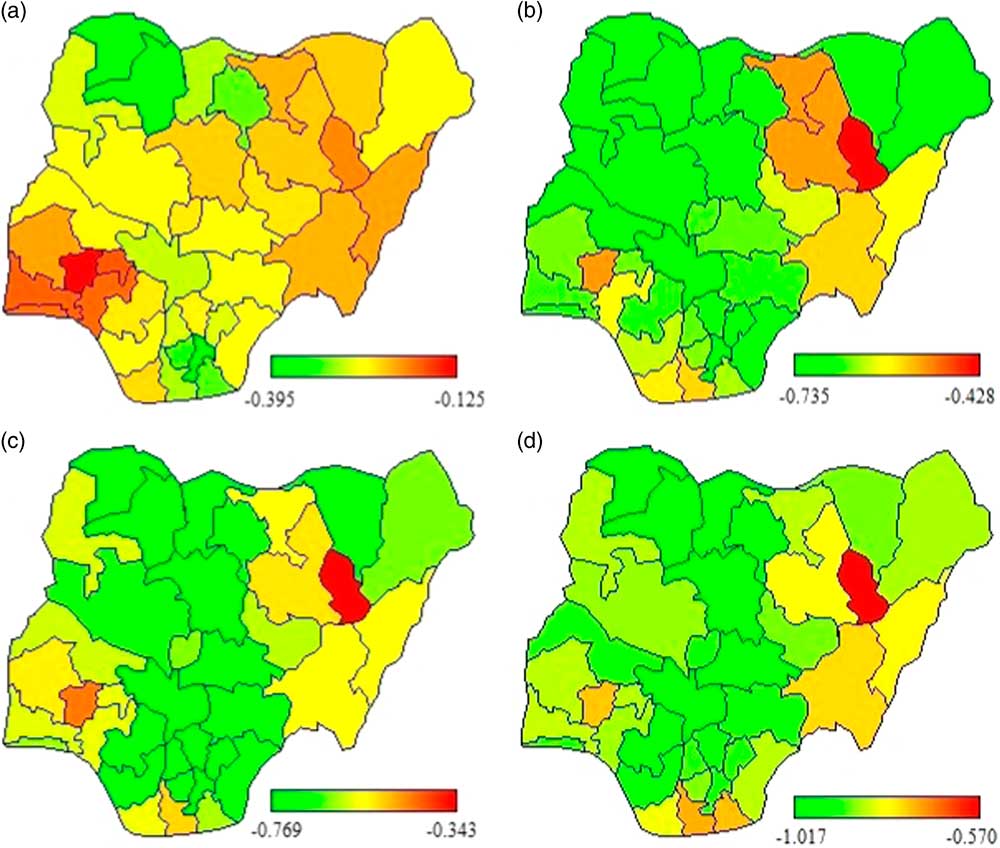
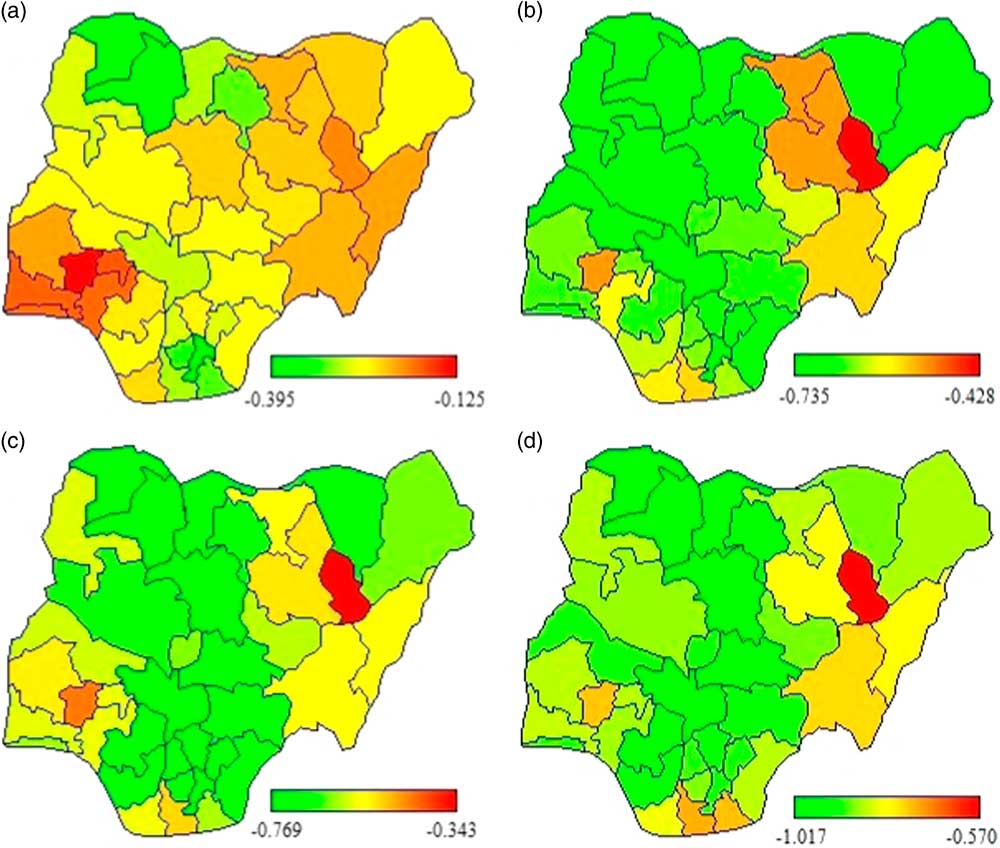
Marginal effects of household wealth index (with ‘poorest’ as reference): (a) poorer; (b) middle; (c) richer; and (d) richest wealth index. The bars indicate the lowest and highest values of marginal estimates.
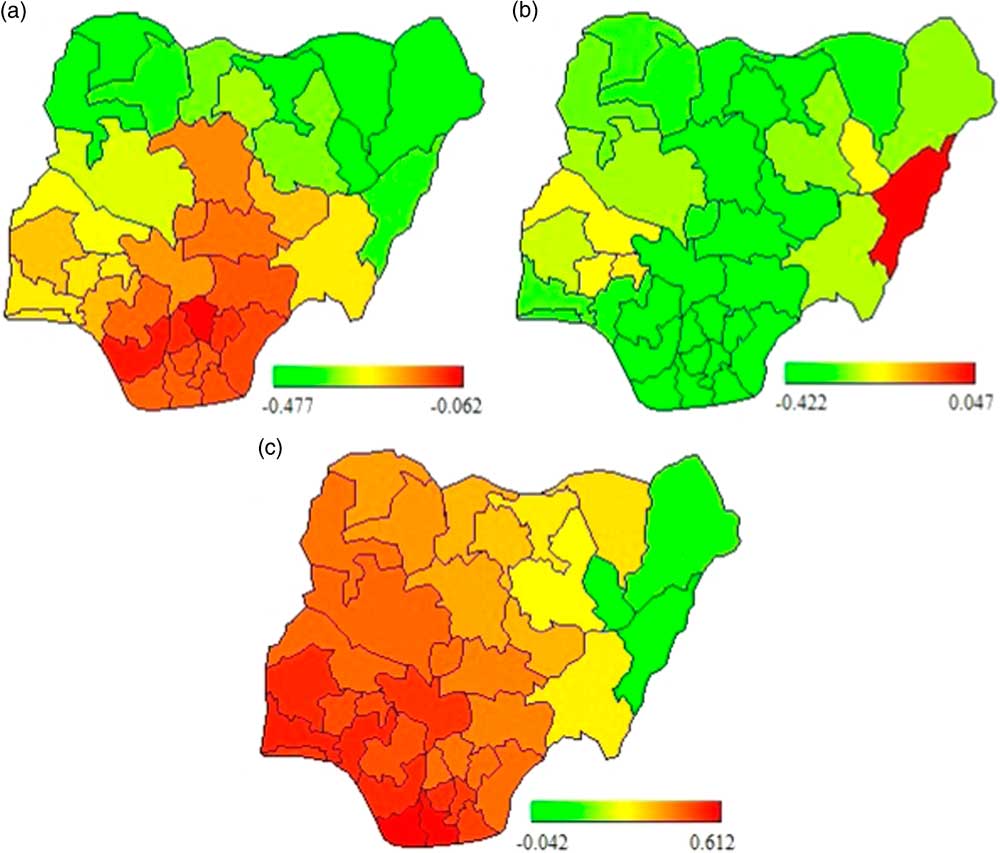
Marginal effects of access to mass media (with ‘no access’ as reference): (a) newspaper/magazine; (b) radio; and (c) television. The bars indicate the lowest and highest values of marginal estimates.
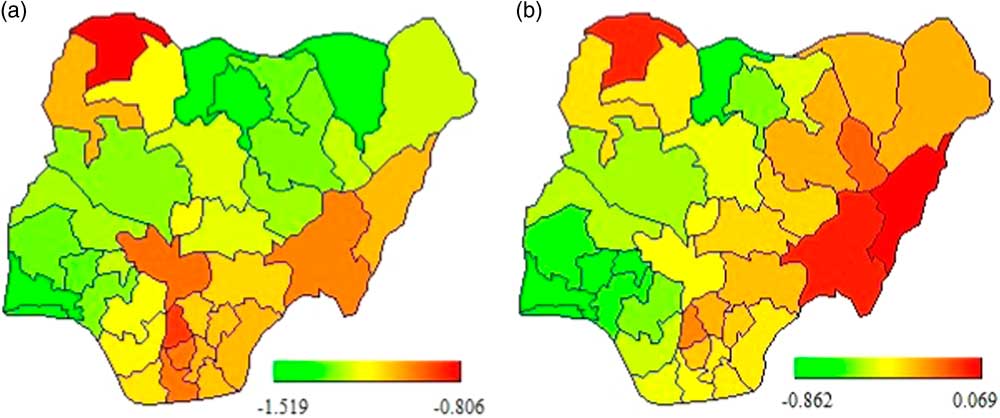
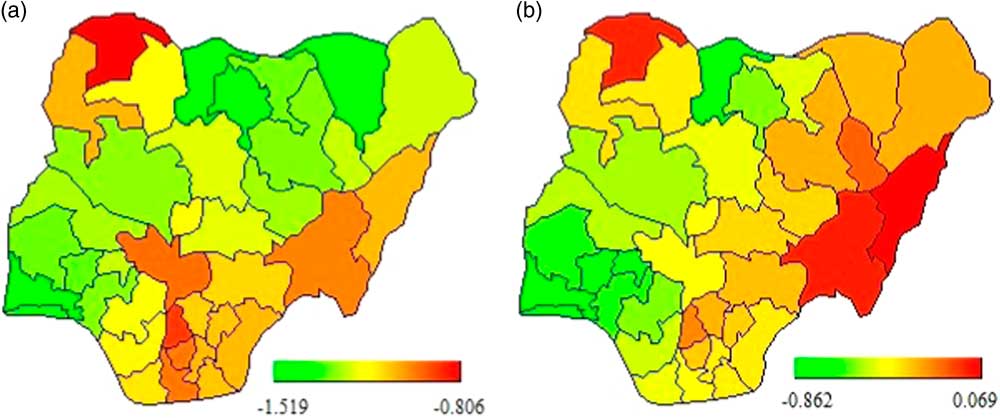
Marginal effects of religious affiliation (with ‘traditional/none’ as reference): (a) Christianity and (b) Islam. The bars indicate the lowest and highest values of marginal estimates.
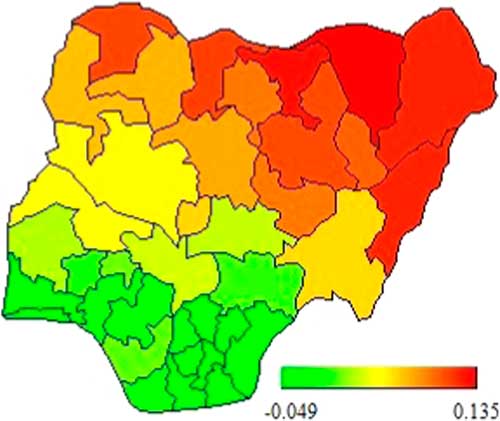
Marginal effects of ever-married (with ‘never-married’ as reference). The bars indicate the lowest and highest values of marginal estimates.
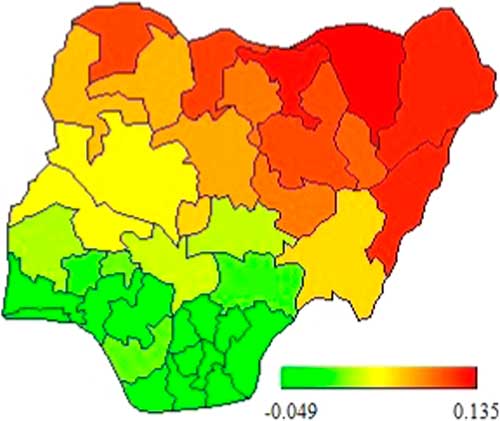
Marginal effects of working status (with ‘not working’ as reference). The bars indicate the lowest and highest values of marginal estimates.
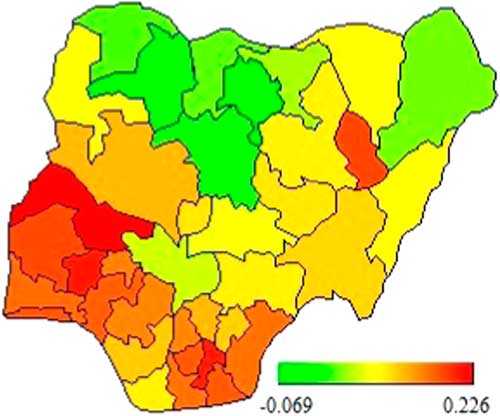
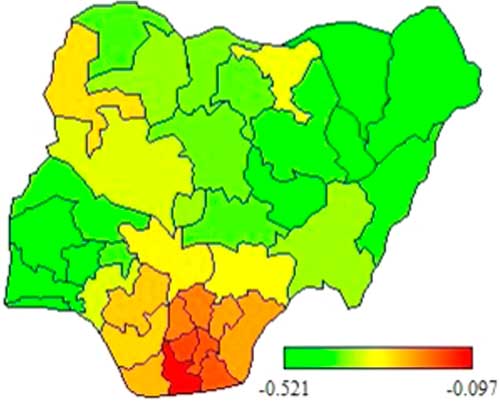
Marginal effects of model intercept. The bars indicate the lowest and highest values of marginal estimates.
Throughout the country, women from the highest four wealth categories (poorer and above) did not tend to support the continuation of FGM when compared with those from the poorest households (Fig. 4). The effect of access to mass media varied across states. Whereas women who read newspapers/magazines at least once a week tended not to support the continuation of FGM throughout the country, this was not the case for those who listened to the radio or watched television (Fig. 5). Women who listened to the radio in Adamawa state tended to belong to the group preferring continuation of the practice, but the majority of women from the southern states and Kaduna, Kano, Jigawa, Plateau, Nasarawa, Benue and the FCT did not want the practice to continue. On the other hand, women with access to television in Adamawa, Borno and Gombe states tended not to support the continuation FGM, but the majority of those in the three southern states and in the North Central region supported the practice.
Compared with women of traditional/other religious groups, those practising the Christian religion were not in support of the continuation of FGM throughout the country, but the views of women of Islamic religion varied across the states (Fig. 6). For instance, women from the neighbouring states of Adamawa, Taraba and Gombe, and those from Sokoto state, did support the practice, but in the six South West states, and Edo, Katsina and Kano, Islamic women tended not to support its continuation. The findings on marital status showed an interesting north–south divide (Fig. 7). While ever-married women from the southern part of the country did not support the practice of FGM, their northern counterparts were of the view that it should be allowed to continue. However, working women from the southern part of the country and Gombe state supported the continuation of FGM, while those from the northern fring, especially Kaduna, Sokoto, Zamfara, Katsina, Kano, Jigawa and Borno states, did not support its continuation (Fig. 8).
The results for the model intercept presented in Fig. 9 demonstrate the views of women in the reference categories for all the variables analysed. Specifically, the figure shows that non-working women from the poorest households with no formal education, residing in urban centres, who did not have access to any form of mass media, who practised traditional religion and had never married tended to support the continuation of FGM in Kano, Katsina, Lagos and Ogun states, while such women in other parts of the country tended not be in favour of the practice.
Discussion
The practice of FGM has remained unacceptably high in Nigeria despite years of effort by the government and other agencies to curtail it. More worrisome is the fact that even though women naturally bear a severe burden if they become victims, there are those among them who support the practice being allowed to continue. This study provides insight into the importance of place in understanding the variations in the factors that influence the support by women of reproductive age for the continuation of FGM in Nigeria. The manner in which the observed factors exact an influence over the support for FGM was found to vary across the country, with some factors displaying opposing effects in neighbouring locations. The findings contrast with those of earlier studies that assumed matching effects across locations where single estimates were obtained for each variable, thus assuming single effects across different locations (Kandala et al., Reference Kandala, Nwakeze and Kandala2009; Achia, Reference Achia2014).
Higher level of education and household wealth are found to lower support for continuing female circumcision throughout the country. Women in this category have been consistently reported to be less likely to cut their female children (Mandara, Reference Mandara2004; 28 Too Many, 2016). Education and wealth can undoubtedly empower women both mentally and financially, giving them greater awareness of the health consequences of FGM, and making them capable of thinking beyond the status quo and able to challenge unpleasant traditional practices. Such women would strive for the elimination of the practice (Nussbaum, Reference Nussbaum1999). Women with higher levels of education are less likely to have their children cut – an indication of a positive inter-generational change (NPC & ICF International, 2014). A good strategy for Nigeria would be to ensure that the core education programme targets discontinuation of FGM, and that the message is disseminated through non-formal education so that out-of-school women can also benefit. For instance, anti-FGM messages could be presented in the form of playlets within small communities across the country. However, women from some southern states with primary and secondary levels of education were found to be inclined towards the continuation of FGM. A recent report from the Population Council identified monetary profit from the practice as a key factor in its continuation in this part of the country, particularly in the South West states. Those performing FGM consider it to be a good source of money, as well as a means of elevating their status (Mberu, Reference Mberu2017). Thus, this could fuel the desire for FGM continuation among people with less than a higher level of education.
The findings suggest that, in general, women residing in rural areas are less likely to support the continuation of the practice of FGM, compared with those in urban areas, throughout the country. Though survey reports have suggested that female circumcision rates are lower among women residing in rural areas as against those in urban areas in Nigeria (NPC & ICF International, 2014), the prevalence by current place of residence may not present a true picture of where the actual act was carried out as most women in Nigeria undergo the practice at younger ages, mostly before their fifth birthday (NPC & ICF International, 2014), and these women may later migrate to urban centres upon marriage or move in search of a better life. These women, in their new-found dwelling areas, might want to see the practice sustained, possibly because they consider the cultural practice important for social acceptance and better marriage prospects. Studies have proved that some communities consider being cut as a ticket to becoming a member of good standing among the women in a community (Shell-Duncan et al., Reference Shell-Duncan, Wander, Hernlund and Moreau2011).
Mass media has been integral to many campaigns against female cutting in Nigeria over the years. However, the role of the media in combatting FGM varies across the country by media. Of the three types of media considered, accessing a newspaper/magazine at least once a week is associated with less support for the practice in all parts of the country. This result is not surprising because newspapers/magazines are usually only accessed by a few women, most of whom are highly educated. Radio is less expensive and more widely available, and does not require the same level of literacy as print media. Radio programmes against FGM and other health issues are broadcast throughout the country (Orubuloye et al., Reference Orubuloye, Caldwell and Caldwell2000). With the exception of Adamawa state, where women who listen to the radio show support for circumcision, the use of the radio to send anti-FGM messages needs to be intensified, so as to reach more people in both rural areas and urban centres. In the case of television, the negative impact it has on the support for FGM might result from the fact that women who watch TV spend more time watching entertainment programmes through home videos rather than paying attention to health adverts. Women in Adamawa state could be targeted through television programmes containing FGM messages, as this medium could be more promising than the use of radio.
The findings on religion show that being a Christian lowers the probability of supporting female circumcision everywhere in the country, but this is not the case for Islam in some few states. There is no evidence in Christian or Islamic religious teachings for the support of female cutting (Yerima & Atidoga, Reference Yerima and Atidoga2014). Faith leaders of both religious groups need to continue acting as agents of change and challenge misconceptions about FGM, particularly in the states where women of the Islam religion show support for the practice. Opposition to FGM among married women has been shown to be on the increase in Egypt (Rossem, et al., Reference Rossem, Meekers and Gage2015). This could also be achieved in Nigeria if anti-FGM messages were targeted at women in the northern part of the country while ensuring that those in the southern states continue to lend their support for halting it.
In conclusion, the importance of geographical location in understanding the factors that encourage the continuation of FGM cannot be overemphasized. The unmatched influence of the factors across locations in Nigeria suggests that culture and economic structures contribute to these determinants leading to the varying effects of the latter on the practice of FGM at different locations. In Nigeria, culture forms people’s attitudes towards life without recourse to their socioeconomic status. Concerted efforts need to be made by the Nigerian government at all levels to make people realize that they can give up this harmful and inhuman practice without necessarily undermining their cultural inclinations. Advocating education and supporting the education of girls to secondary level and beyond are pivotal links to curtailing the practice across the country. Effectual and diverse media campaigns reaching out to women in different sections of the society, and securing the support of religious leaders, should be considered in policy formulation and implementation. Targeting women alone in efforts to end the practice might, however, be insufficient to bring the required attitudinal change, as women are usually not in a position to make decisions about health issues in many Nigerian societies. Decisions on having a girl cut might be taken by the family, which in most cases derives its views from the community. Notwithstanding that the findings point to the importance of local approaches to containing FGM in the country, uniform approaches based on some of the factors can still be useful everywhere in Nigeria.
Acknowledgment
The authors appreciate the permission of the DHS Program to use the data analysed in the study.
Ethical Approval
The authors assert that the data utilized in this study were obtained from a secondary source after informed consent was obtained.
Conflicts of Interest
The authors have no conflicts of interest to declare.
Funding
This research received no specific grant from any funding agency, commercial entity or not-for-profit organization.