Introduction
The adaptations of higher plants growing in exposed or shaded habitats have been well studied (Mathur et al. Reference Mathur, Jain and Jajoo2018; Greer Reference Greer, Munns, Schmidt, Beveridge and Mathesius2022). ‘Sun’ plants that grow in exposed habitats are characterized by having the potential for high rates of photosynthesis, with photosynthesis that saturates at high light levels, lower chlorophyll contents, higher chlorophyll a/b ratios and various forms of photoprotection. The adaptations of lichen photobionts to varying light levels have been much less studied. While lichens share some of these classic sun adaptations with higher plants (Piccotto & Tretiach Reference Piccotto and Tretiach2010), their symbiotic nature probably means that their photobionts also display unique adaptations to light stress. For example, lichen photobionts display higher tolerance to excess light when part of a functioning lichen thallus than when grown as isolated cultures (Kranner et al. Reference Kranner, Cram, Zorn, Wornik, Yoshimura, Stabentheiner and Pfeifhofer2005), although the reasons for this increased tolerance remain unclear.
In lichens, as for other photosynthetic organisms, an effective protective mechanism that dissipates excess absorbed light energy is non-photochemical quenching (NPQ) (Beckett et al. Reference Beckett, Minibayeva, Solhaug and Roach2021). NPQ is comprised of several components. One important component is energy dependent quenching (qE), which is rapidly induced and typically relaxes completely during the first few minutes of darkness (Pinnola Reference Pinnola2019). When the thylakoid lumen becomes acidified, quenching of the ‘energized’ form of chlorophyll (1Chl*) is activated, increasing qE (Tian et al. Reference Tian, Nawrocki, Liu, Polukhina, van Stokkum and Croce2019). Although little studied in lichens, activation of qE in free-living chlorophycean algae depends on the Light-Harvesting Complex Stress-Related (LHCSR) proteins (Pinnola Reference Pinnola2019). While the precise way that qE dissipates light energy as heat remains unclear, LHCSRs probably enable interactions between excited chlorophyll molecules and xanthophyll cycle pigments, allowing dissipation of the excess energy (Ruban & Wilson Reference Ruban and Wilson2021). A second important component of NPQ is qT, deriving from state transitions, a process whereby plants adjust the distribution of light energy between the photosystems (Shang et al. Reference Shang, Li and Pan2023; Minagawa Reference Minagawa2025). Briefly, when photosystem II (PSII) becomes overexcited, a protein called STN7 kinase (or in chlorophycean algae Stt7 kinase) detects this imbalance and phosphorylates light-harvesting complex II (LHCII). A portion of LHCII becomes detached, and some of the detached portion then becomes attached to photosystem I (PSI). Balancing energy absorption can reduce the harmful effects of excess energy on PSII. qT typically dissipates after 5 to 10 min of relaxation in the dark, and can theoretically be distinguished from qE due to its slower relaxation time. While Stt7 kinase activity has not been studied directly in lichens, evidence from NPQ relaxation kinetics suggests that qT can form a significant fraction of overall NPQ (Mishra et al. Reference Mishra, Vítek, Barták and Mishra2025). A third component of NPQ is photoinhibitory quenching (qI), which probably results from damage to PSII (Ruban Reference Ruban2016). qI can be defined as the NPQ remaining after, for example, 10 min of darkness. Taken together, the components of NPQ act like a safety valve, and can effectively reduce photodamage. However, due to the unique nature of the symbiosis, it should not be assumed that NPQ plays equivalent ecological and physiological roles in lichens and vascular plants. For example, as poikilohydric organisms, lichens undergo cycles of drying. During these dry phases, when the risk of photoinhibition rises, they can strongly induce non-photochemical quenching as a protective response (Calatayud et al. Reference Calatayud, Deltoro, Barreno and del Valle-Tascon1997). Conversely, photoinhibition can occur when thalli are oversaturated, because CO2 diffusion will be limited while light continues to be intercepted (Leisner et al. Reference Leisner, Green and Lange1997), although the precise role of NPQ under these conditions remains unclear.
Recently, we used chlorophyll fluorescence to compare photoprotection in collections of the same lichen species from exposed and from more shaded locations in the Afromontane region of KwaZulu Natal, South Africa (Mkhize et al. Reference Mkhize, Minibayeva and Beckett2022). Species chosen had trebouxioid photobionts and normally grow in more exposed, or ‘sun’, microhabitats but can also be readily collected from more shaded locations in close proximity. Results showed that shade forms display much higher NPQ, presumably to reduce the harmful effects of occasional rapid increases in light levels that occur when sunflecks strike lichens growing in shaded woodland microhabitats. A further reason for the higher NPQ in shade forms could be that they spend more time hydrated than sun forms. As discussed above, fixation of CO2 is reduced in moist thalli while photophosphorylation continues, and high NPQ may reduce the formation of reactive oxygen species (ROS) during sudden exposure to light (Ndhlovu et al. Reference Ndhlovu, Khuzwayo, Minibayeva and Beckett2025). Mkhize et al. (Reference Mkhize, Minibayeva and Beckett2022) also found that maximal relative electron transport rates (rETRMAX) are lower in shade than sun collections, probably reflecting a downregulation of photosynthetic capacity to reduce energy costs. In a later study of photoprotection of PSI, Beckett et al. (Reference Beckett, Roach, Minibayeva and Werth2023) showed that sun species displayed higher flavodiiron (FLV)-mediated pseudocyclic electron flow (PCEF) than shade species; all collections were made in summer. Furthermore, all species displayed high rates of cyclic electron flow (CEF). However, there have been no comparisons of alternative electron flows around PSI in sun and shade collections of the same species, and no studies that have compared summer and winter collections of lichens.
In addition to growing in a wide variety of sunny and shaded microhabitats, lichens are obviously ‘perennial’ and can photosynthesize year-round when conditions allow. They must therefore be able to show acclimatization to seasonal variation in light availability. The classical gas exchange measurements made by Kershaw (Reference Kershaw1985) confirmed the ability of lichens to adapt to seasonal changes in their light environment, in particular in their maximum rates of photosynthesis. However, seasonal variations in biochemical mechanisms used by lichen photobionts to protect themselves against the effects of high light have rarely been studied. The lichen material used by Mkhize et al. (Reference Mkhize, Minibayeva and Beckett2022) was collected during the Southern Hemisphere summer months of February and March. Unlike the winter-rainfall areas of the Mediterranean climatic regions of South Africa in the Cape Province, in the Afromontane region of KwaZulu Natal significant summer rainfall occurs (Nel Reference Nel2009). During the summer, leaves are present on typical host trees such as Leucosidea sericea, reducing light levels for shade collections. During the winter, host trees shed their leaves increasing light availability for shade collections, although days are shorter. When comparisons were made between sun and shade forms of the same species collected in winter, far smaller differences in NPQ and rETR were found. As Mkhize et al. (Reference Mkhize, Minibayeva and Beckett2022) have already well characterized PSII activity in summer collections of Afromontane lichens, our first aim in the present study was to compare sun and shade thalli of Ramalina celastri (Spreng.) Krog & Swinscow and Usnea undulata Stirt. collected in the Southern Hemisphere winter (June to August) from a diversity of sites. The second aim was to compare PCEF and CEF in winter collections of sun and shade lichens. Results showed that, in contrast to summer collections, during the winter months the differences in PSII activity between sun and shade lichens are much smaller. Similarly, in winter, PCEF and CEF were very similar in both sun and shade collections. We discuss possible reasons for the seasonal differences.
Materials and Methods
Lichen material
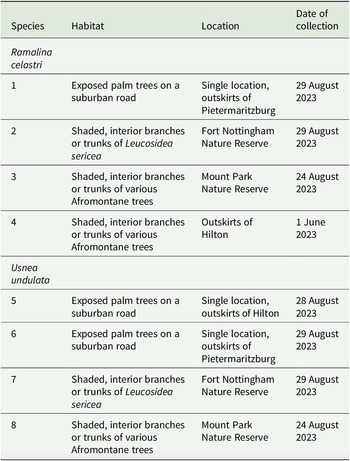
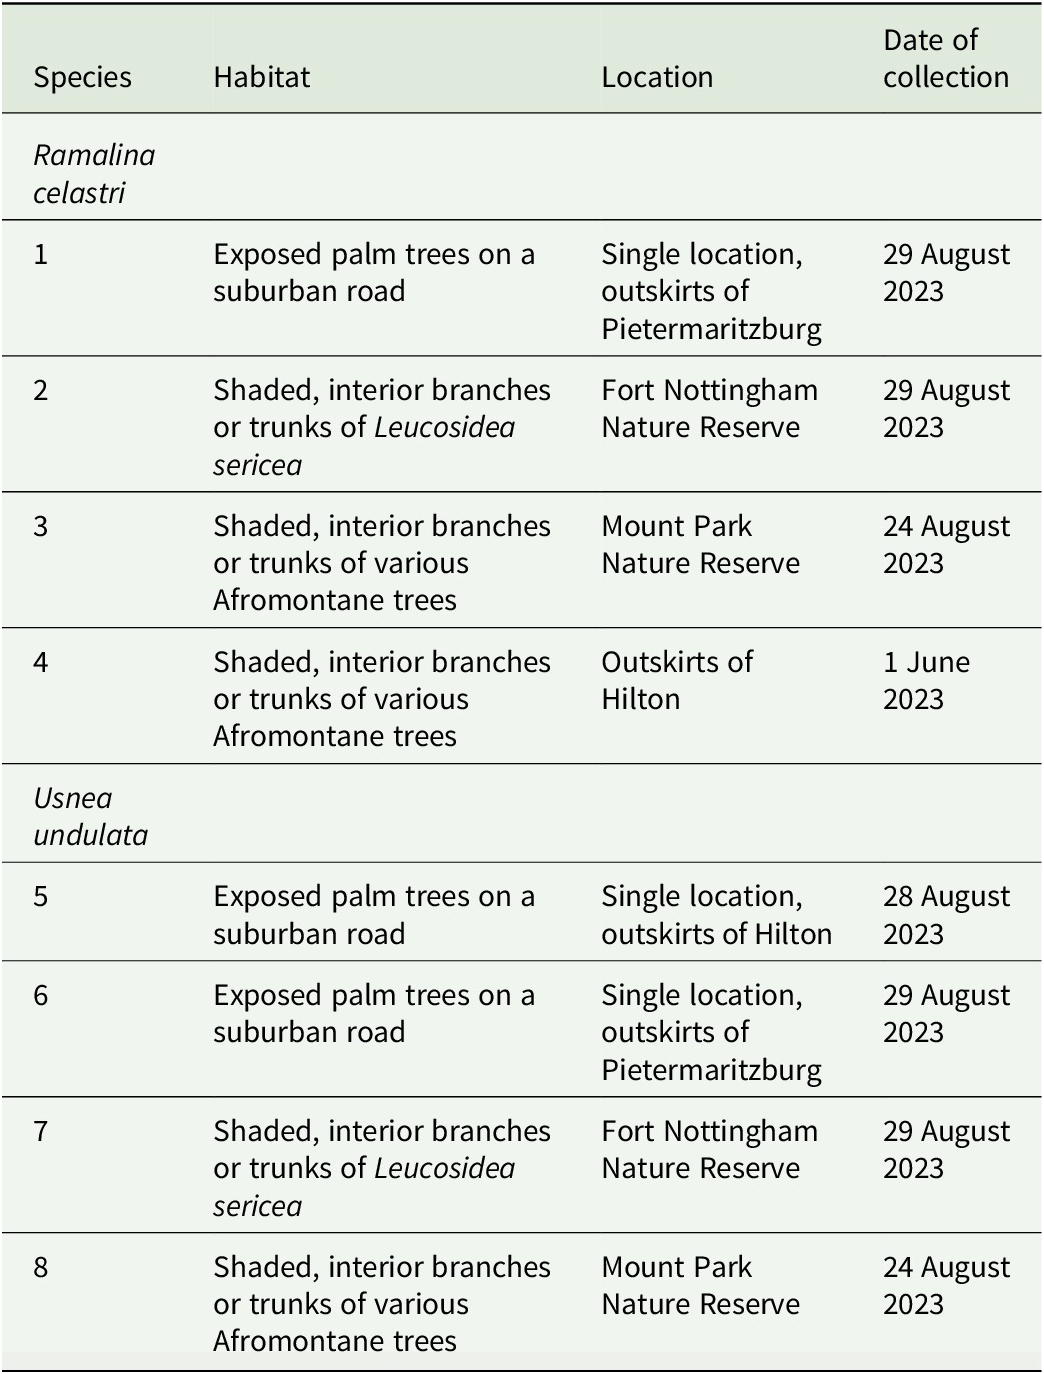
All lichens were collected from Afromontane parts of the KwaZulu Natal midlands, which is in the south-eastern part of the Southern Hemisphere country of South Africa. The two species used were Ramalina celastri and Usnea undulata, which were collected from a variety of shaded and sunny locations as outlined in Table 1. Most collections were made towards the end of winter (August 2023), when average maximum and minimum day temperatures were 24 °C and 6 °C respectively, and the average precipitation was 8 mm for the month (Anonymous 2003). In contrast, during the summer (February) average maximum and minimum day temperatures were 28 °C and 18 °C respectively, and the average precipitation was 121 mm for the month. Information on summer weather is provided to enable comparisons to be made between typical ambient conditions in summer and winter. Fluorescence parameters obtained from the summer collections of lichens used by Mkhize et al. (Reference Mkhize, Minibayeva and Beckett2022) are presented in Table 2. Material was immediately cleaned and stored at −20 °C for up to 8 weeks. The day before experimentation, 1.5 cm thallus segments were cut, and then hydrated by placing them on wet filter paper. Thalli were kept overnight in cool (15 °C) conditions in darkness. Each treatment comprised 10–12 replicates of thallus segments selected from 10–12 different thalli.
Collection sites of sun and shade forms of Ramalina celastri and Usnea undulata sampled during the winter from the KwaZulu Natal midlands.
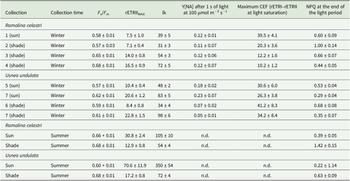
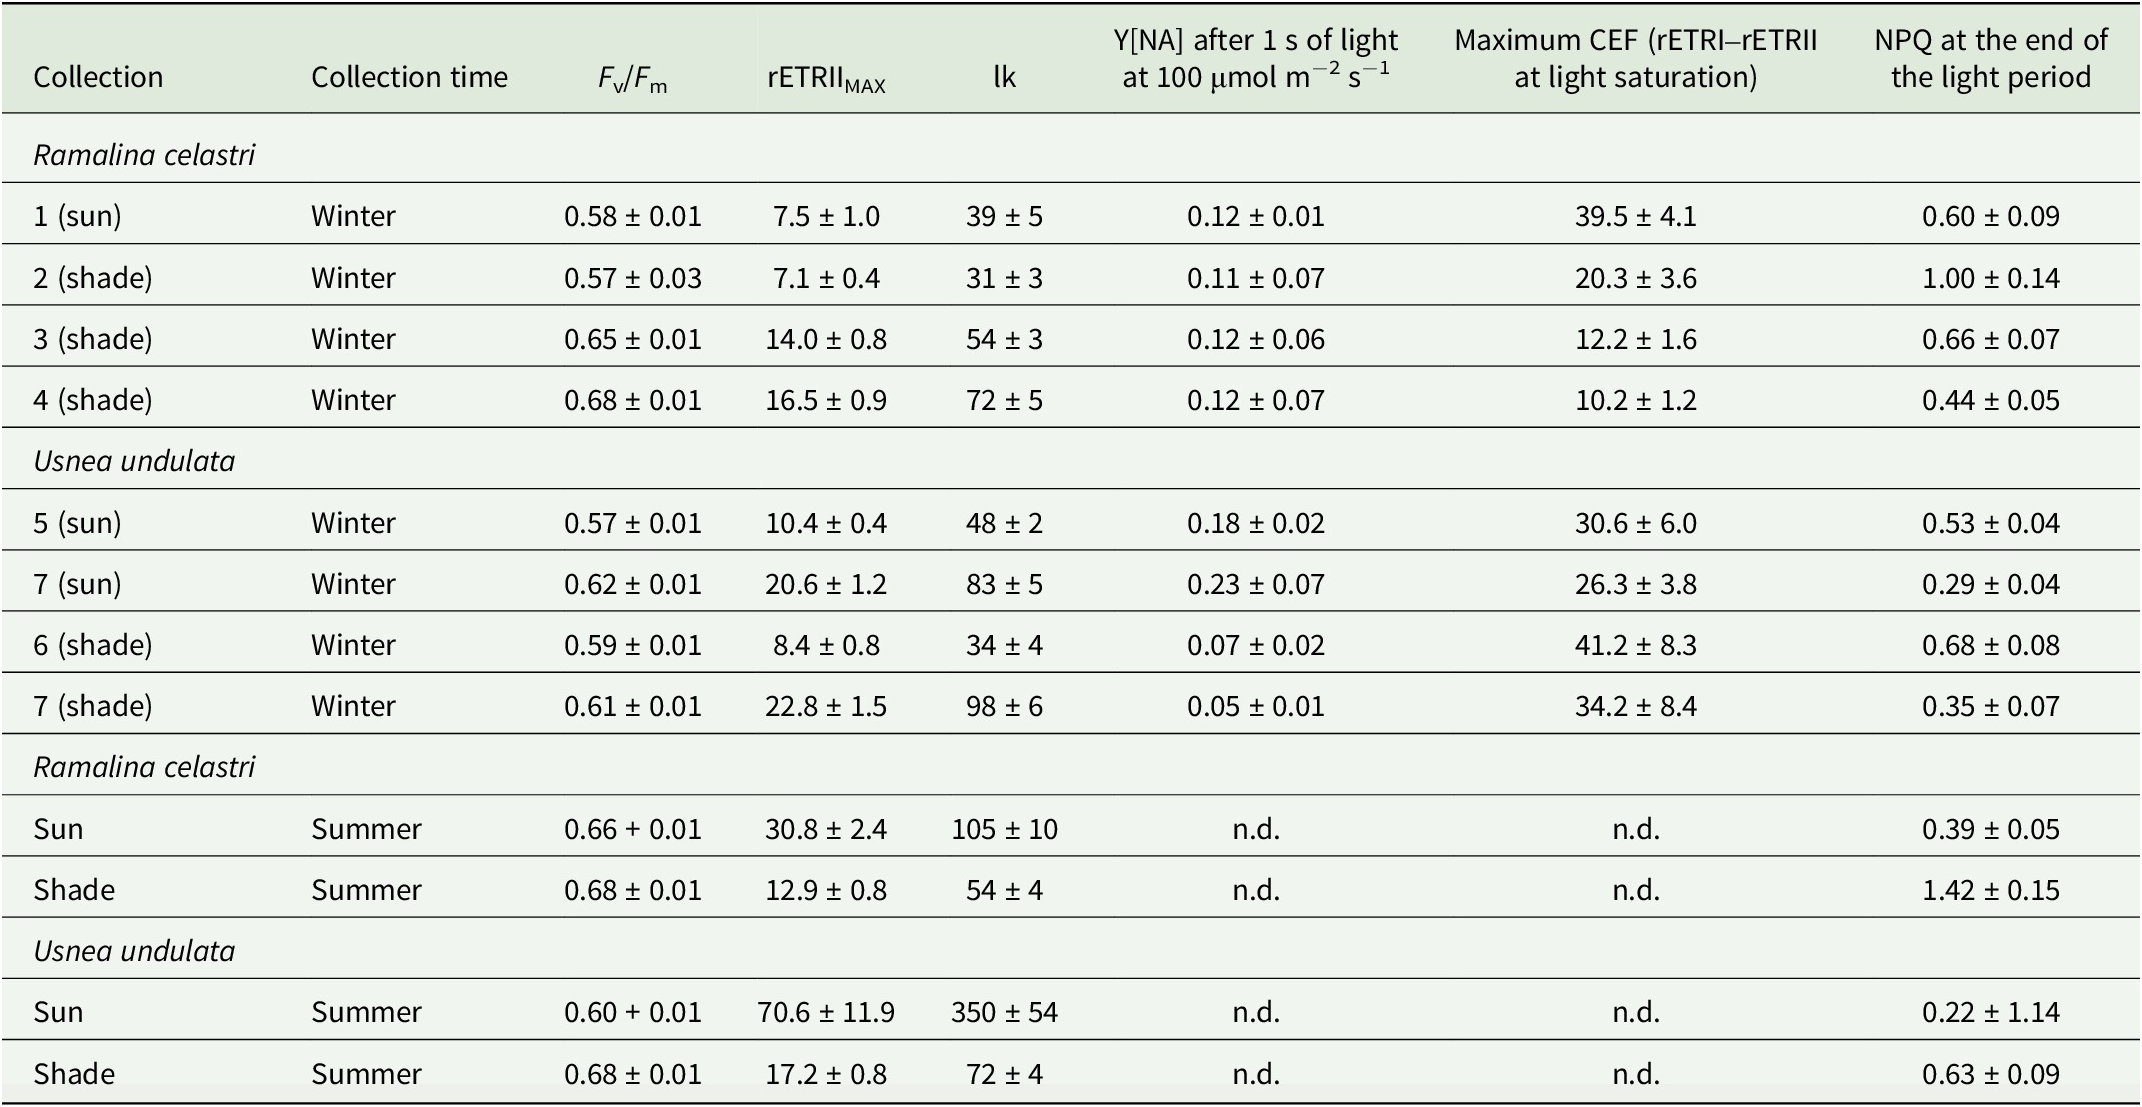
Characteristics of photosystem I (PSI) and photosystem II (PSII) activity in winter collections of sun and shade forms of Ramalina celastri and Usnea undulata from the Afromontane region in the KwaZulu Natal midlands. Figures are given ± SE, n = 10. For comparison, data for summer collections are extracted from Mkhize et al. (Reference Mkhize, Minibayeva and Beckett2022). F v/F m = maximum quantum efficiency of PSII; rETRIIMAX = maximum electron transport rate of photosystem II; lk = the light intensity at which saturation sets in; Y[NA] = acceptor side limitation of photosystem II; CEF = cyclic electron flow; rETRI = relative electron transport rate of photosystem I; rETRII = relative electron transport rate of photosystem II; NPQ = non-photochemical quenching.
Chlorophyll fluorescence and P700 measurements
Chlorophyll fluorescence, as an indicator of PSII activity, and changes in the redox state of the PSI primary electron donor (P700), as an indicator of PSI activity, were measured simultaneously with a Dual-PAM-100 fluorimeter (Walz, Effeltrich, Germany) using the ‘red’ version of the DUAL-DR measuring head. The thalli were dark-adapted for a minimum of 10 min before the experiments. The minimum fluorescence (F 0) was determined before applying a saturating flash to determine maximum fluorescence (F m). The maximum quantum efficiency of PSII was calculated as:
 $$ {F}_{\mathrm{v}}/{F}_{\mathrm{m}}=\left({F}_{\mathrm{m}}-{F}_0\right)/{F}_{\mathrm{m}} $$
The maximal fluorescence in the light (F m’) was determined by applying a saturating flash of light when thalli were illuminated.
NPQ was calculated using the formula of Bilger et al. (Reference Bilger, Schreiber and Bock1995) as:
 $$ \mathrm{NPQ}=\left({F}_{\mathrm{m}}-{F}_{{\mathrm{m}}^{,}}\right)/{F}_{{\mathrm{m}}^{,}} $$
P700 was measured in the dual-wavelength mode, using the difference of absorbance at 875 and 830 nm. Briefly, light reaching the PSI centres can either lead to photochemical charge separation with quantum yield Y[I], or be non-photochemically converted to heat, first because P700 is oxidized (P700+) due to donor side limitation (Y[ND]), or second no charge separation is possible due to acceptor side limitation (Y[NA]). By analogy to F m, the maximal P700+ signal, Pm, was determined by the application of a saturation pulse, but in the presence of a far red (FR) light (setting ‘3’ on the Dual PAM) switched on 10 s beforehand. The minimal P700 signal, P0, was determined when a complete reduction of P700 was induced after the saturation pulse and in the absence of FR light. Pm’, the maximal P700+ signal induced by a saturation pulse under actinic light, was measured after 1 s illumination at 100 μmol m−2 s−1, and was used to calculate Y[NA] as a reliable marker of FLV activity (Gerotto et al. Reference Gerotto, Alboresi, Meneghesso, Jokel, Suorsa, Aro and Morosinotto2016). P is the signal in actinic light. The PSI parameters were calculated after Klughammer & Schreiber (Reference Klughammer and Schreiber1994) and Schreiber & Klughammer (Reference Schreiber and Klughammer2008) as follows:
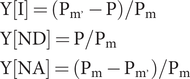 $$ {\displaystyle \begin{array}{l}\mathrm{Y}\left[\mathrm{I}\right]=\left({\mathrm{P}}_{{\mathrm{m}}^{,}}-\mathrm{P}\right)/{\mathrm{P}}_{\mathrm{m}}\\ {}\mathrm{Y}\left[\mathrm{ND}\right]=\mathrm{P}/{\mathrm{P}}_{\mathrm{m}}\\ {}\mathrm{Y}\left[\mathrm{NA}\right]=\left({\mathrm{P}}_{\mathrm{m}}-{\mathrm{P}}_{{\mathrm{m}}^{,}}\right)/{\mathrm{P}}_{\mathrm{m}}\end{array}} $$
The sum of Y[I], Y[ND], and Y[NA] = 1 (i.e. 100%).
The rates of relative electron transport from PSII (rETRII) and PSI (rETRI) were calculated as:
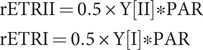 $$ {\displaystyle \begin{array}{l}\mathrm{rETRI}\mathrm{I}=0.5\times \mathrm{Y}\left[\mathrm{I}\mathrm{I}\right]\ast \mathrm{PAR}\\ {}\mathrm{rETRI}=0.5\times \mathrm{Y}\left[\mathrm{I}\right]\ast \mathrm{PAR}\end{array}} $$
where PAR = photosynthetically active radiation, and Y[II] and Y [I] are the effective quantum yields of PSII and PSI photochemistry, calculated as (F m’ – F t)/F m and (Pm’ – P)/Pm, respectively. F t is the fluorescence signal in actinic light without the influence of a saturating pulse.
After overnight hydration as described above, lichens were lightly blotted to remove excess superficial water and kept on moist filter paper during measurement. Tests showed no drop-off in basic fluorimetry parameters (such as rETRII or F v/F m) during the time needed to take a series of measurements (11 min).
Induction kinetics and rapid light curves for calculating rETRII MAX and CEF
To test for the induction of rETR and the induction and relaxation of NPQ, thalli were dark-adapted for 10 min and then an actinic light at 100 μmol m−2 s−1 was switched on. Parameters were then measured every 20–40 s for 6 min. The actinic light was then switched off, and relaxation of NPQ was measured for the following 5 min. Rapid light response curves of rETRI and rETRII were measured by progressively increasing the level of the actinic light. Light levels of 16, 28, 41, 64, 88, 115, 151, 199, 258 and 330 μmol m−2 s−1 were used, for 10–20 s at each level, and a saturating flash was applied at the end of exposure to each light level. However, measurements were stopped when a particular light level appeared to cause photoinhibition. From the relationship between rETRII and actinic light intensity, the equations described by Eilers & Peeters (Reference Eilers and Peeters1988) were used to estimate maximum rETRII (rETRIIMAX), and lk, the light intensity at which saturation sets in. The calculation rETRI–rETRII was used to estimate CEF (Miyake et al. Reference Miyake, Shinzaki, Miyata and Tomizawa2004), although technically it is only an approximation because of the existence of alternative electron sinks such as the Mehler reaction, chlororespiration and respiration.
Statistical Analysis
All data were analyzed using repeated measure two-way ANOVAs in R v. 4.4.0 using the rstatix package of Kassambara (Reference Kassambara2019). The two factors were: 1) time of measurement in the fluorimeter; 2) collection site. After ANOVA, pairwise t-tests were carried out between the collection sites listed in Table 1 using the Bonferroni correction for P values. Graphs were plotted using ggplot2.
Results
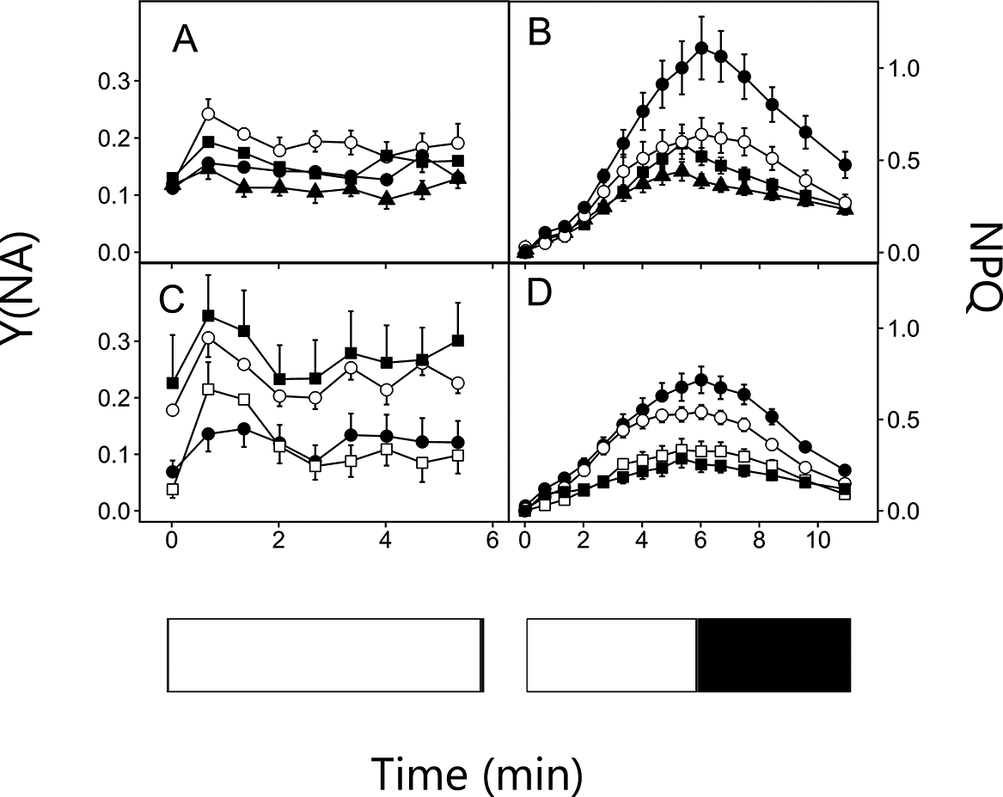
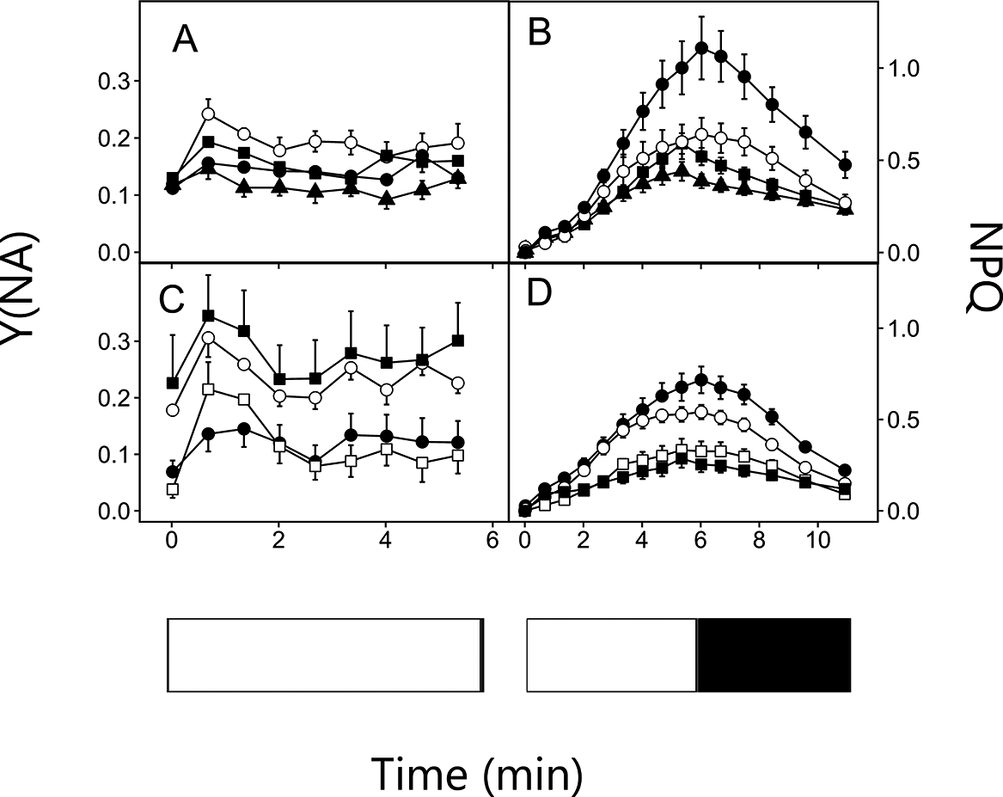
Values of F v/F m for Ramalina and Usnea indicated that the lichens used here were healthy; values did not differ markedly between winter and previous data from summer collections (Table 2). FLV activity was estimated using acceptor side limitation of PSI (Y[NA]) after 1 s. Y[NA] was very low in all collections of both species (Fig. 1A & C, Table 2), indicating high FLV activity. All collections showed a similar pattern of induction and relaxation of NPQ, with both induction and relaxation occurring slowly, with low maximum values of NPQ (Fig. 1B & D, Table 2). There were no consistent significant differences between sun and shade collections (Table 3). For example, although the sun collection of Ramalina (site 1) had significantly lower NPQ than material from the shaded site 2, values were significantly higher than those from material collected from the shaded site 4 (Table 3).
Acceptor side limitation of PSI (Y[NA]) as a function of illumination time (A, C) and NPQ induction in the light (100 μmol m−2 s−1) and relaxation in the dark (B, D). Sun collections are denoted by open symbols, shade collections by solid symbols. A & B, Ramalina celastri (○ = sun collection from outskirts of Pietermaritzburg (1), ● = shade collection from Fort Nottingham (2), ▲ = shade collection from Mount Park (3), ■ = shade collection from Hilton (4)). C & D, Usnea undulata (○ = sun collection from Hilton (5), □ = sun collection from Pietermaritzburg (6), ● = shade collection from Fort Nottingham (7), ■ = shade collection from Mount Park (8)). Numbers correspond to the collection localities given in Table 1. Data are mean ± SE (n = 10–12 thallus segments). Bars at the bottom of the figure indicate periods of illumination and darkness.
Repeated measure two-way ANOVA on chlorophyll fluorescence parameters of sun and shade collections of Ramalina celastri and Usnea undulata collected in winter. For each species, ten thallus segments were measured at intervals (‘time’) during induction in the light (rETR, Y[NA]) and relaxation in the dark (NPQ) following the switching on of light at 100 μmol m−2 s−1 as indicated in Figs 1 and 2. In addition, pairwise t-tests were carried out between the collection sites listed in Table 1 using the Bonferroni correction for P values. For R. celastri, site 1 was a sun site, while 2,3 and 4 were shade sites. For U. undulata, sites 5 and 6 were sun sites, while 7 and 8 were shade sites. NPQ = non-photochemical quenching; Y[NA] = acceptor side limitation of photosystem II; rETRI = relative electron transport rate of photosystem I; rETRII = relative electron transport rate of photosystem II; CEF = cyclic electron flow. * = P < 0.05; ** = P < 0.01; *** = P < 0.001.
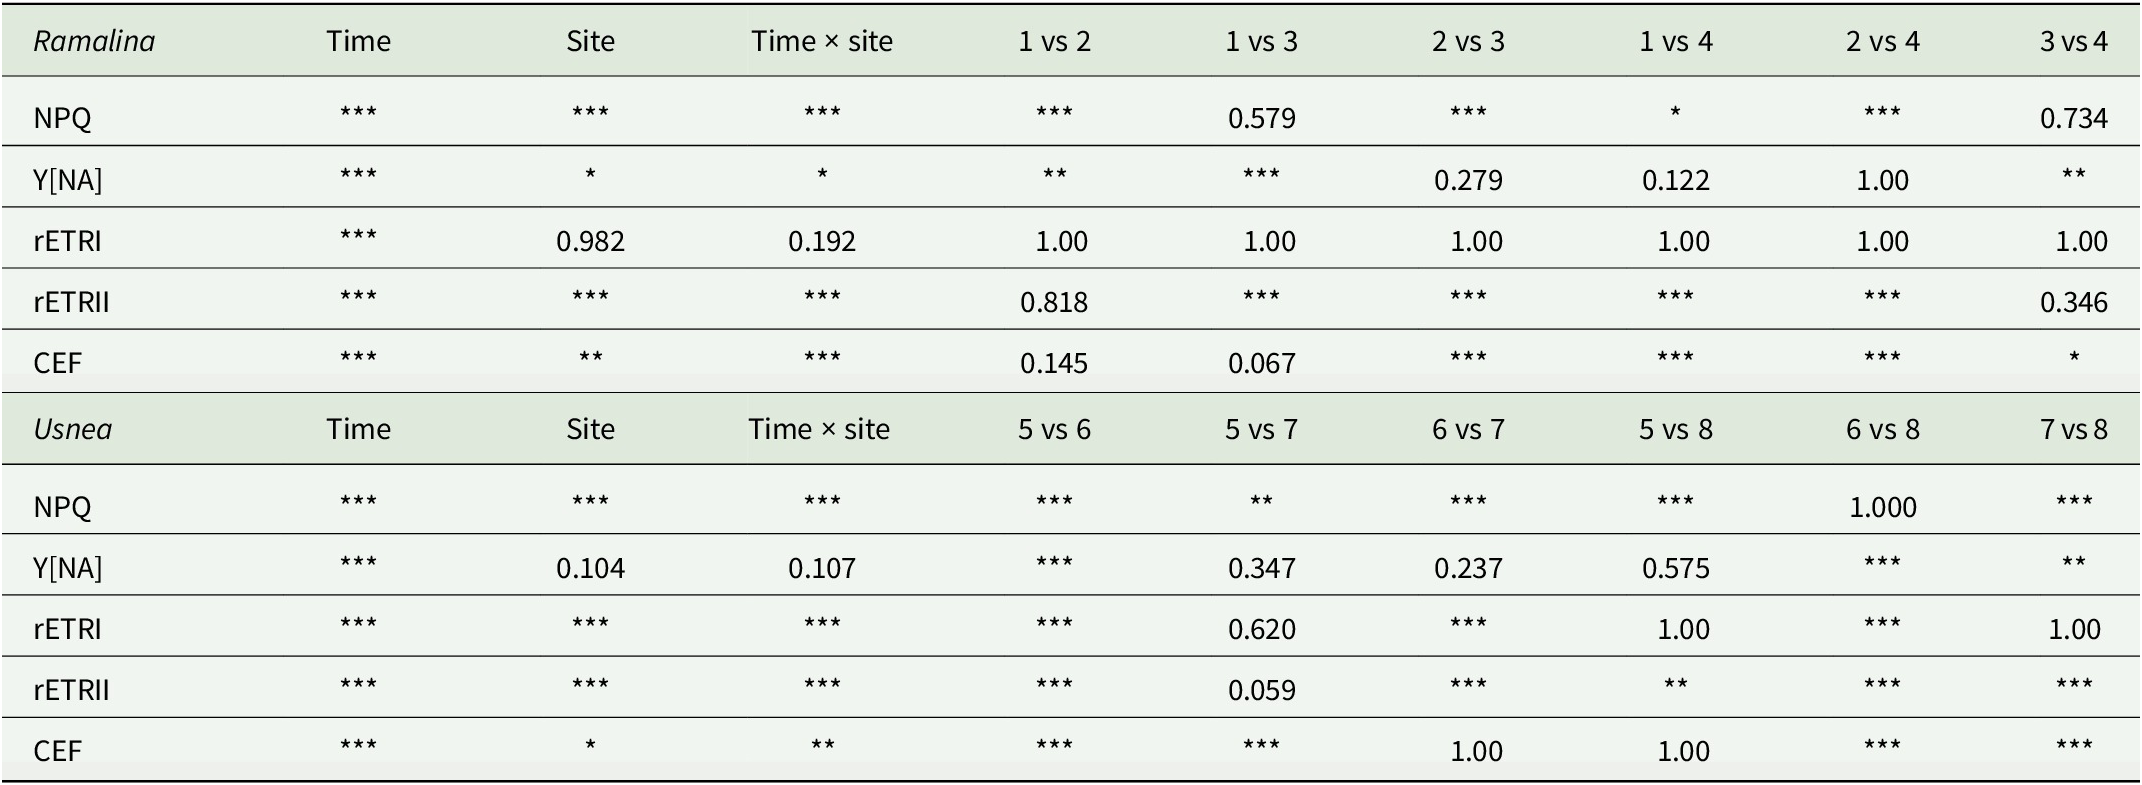
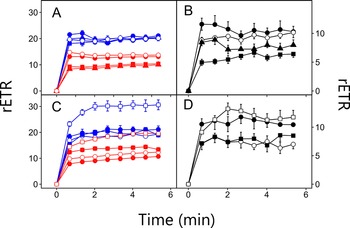
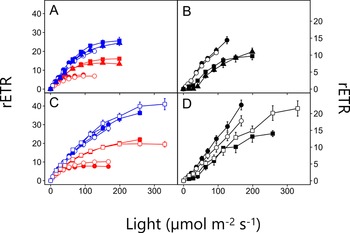
The induction of rETRI and rETRII was rapid in all collections (Fig. 2A & C). There were no consistent significant differences between sun and shade collections (Table 3), although two shade collections of Ramalina (from sites 3 and 4) displayed slightly lower rates of CEF (Fig. 2B). In Usnea, one sun collection (site 6) displayed significantly higher rates of ETRI, ETRII and CEF than the shade collections (Fig. 2C & D, Table 3), but for the other sun collection (site 5) rates were similar to those of the shade collections.
Induction of the relative electron transport rate of photosystem I (rETRI) (blue lines and symbols) and the relative electron transport rate of photosystem II (rETRII) (red lines and symbols) (A & C), and cyclic electron flow (black lines and symbols) (B & D) at 100 μmol m−2 s−1 in Ramalina celastri and Usnea undulata. Left y-axis labelling of rETR refers to the induction of rETRI and rETRII, while right y-axis labelling of rETR refers to the induction of cyclic electron flow (CEF). Sun collections are denoted by open symbols, shade collections by solid symbols. A & B, Ramalina celastri (○ = sun collection from outskirts of Pietermaritzburg (1), ● = shade collection from Fort Nottingham (2), ▲ = shade collection from Mount Park (3), ■ = shade collection from Hilton (4)). C & D, Usnea undulata (○ = sun collection from Hilton (5), □ = sun collection from Pietermaritzburg (6), ● = shade collection from Fort Nottingham (7), ■ = shade collection from Mount Park (8)). Numbers correspond to the collection localities given in Table 1. Data are mean ± SE (n = 10–12 thallus segments).
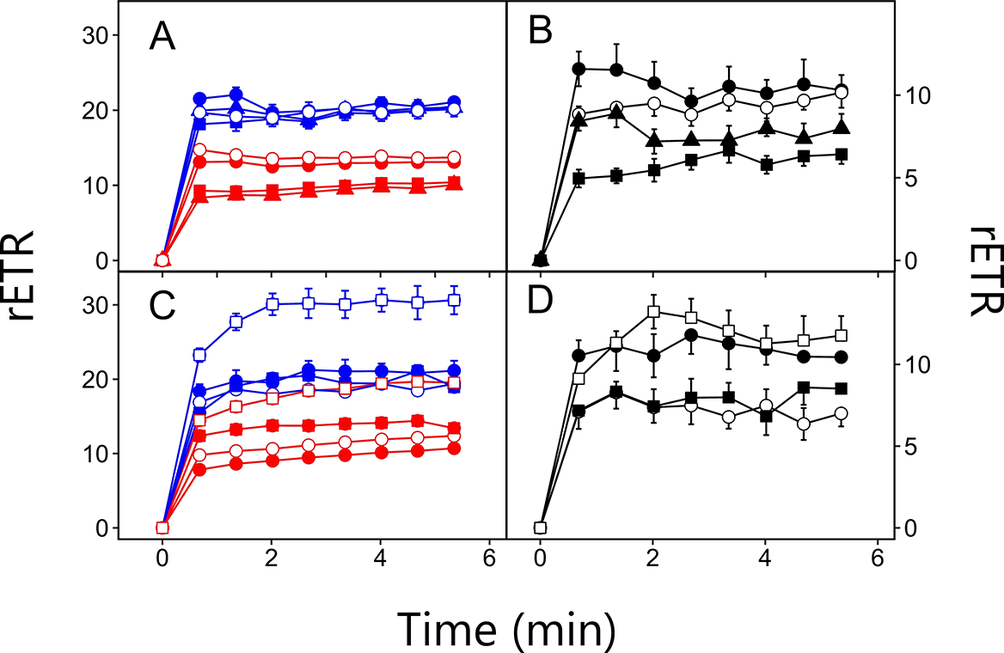
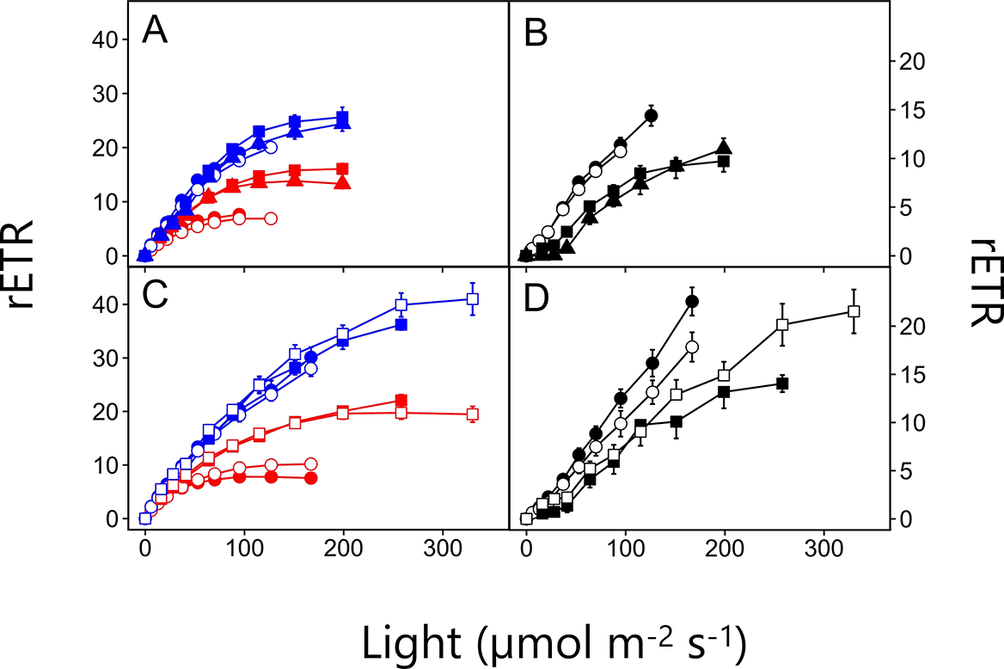
Analysis of the RLCs indicated that there were no consistent differences between sun and shade forms (Fig. 3, Table 2). For Ramalina, rETRII saturated at low light levels in one shade collection and one sun collection (sites 1 and 2). The two other shade collections (sites 3 and 4) had higher values of lk and rates of rETRIIMAX, but slightly lower rates of CEF (Fig. 3B, Table 2). In Usnea, rETRII in one sun collection (site 5) and one shade collection (site 7) saturated at lower light levels than the other sun and shade collections (sites 6 and 8 respectively) (Fig. 3C, Table 2). For CEF, Usnea displayed no clear differences between sun and shade forms (Fig. 3D).
Rapid light curves for photosystem I (PSI; blue lines and symbols) and photosystem II (PSII; red lines and symbols) (A & C), and the effect of light level on cyclic electron flow (black lines and symbols) (B & D) in Ramalina celastri and Usnea undulata. rETR on left y-axis refers to the light response curves of relative electron transport rate of photosystem I (rETRI) and the relative electron transport rate of photosystem II (rETRII), while rETR on right y-axis refers to the light response curves of cyclic electron flow (CEF). Sun collections are denoted by open symbols, shade collections by solid symbols. A & B, Ramalina celastri (○ = sun collection from outskirts of Pietermaritzburg (1), ● = shade collection from Fort Nottingham (2), ▲ = shade collection from Mount Park (3), ■ = shade collection from Hilton (4)). C & D, Usnea undulata (○ = sun collection from Hilton (5), □ = sun collection from Pietermaritzburg (6), ● = shade collection from Fort Nottingham (7), ■ = shade collection from Mount Park (8)). Numbers correspond to the collection localities given in Table 1. Data are mean ± SE (n = 10–12 thallus segments).
Discussion
It has long been known that lichens can adapt their photosynthetic apparatus to seasonal changes in light and temperature (for review see Kershaw (Reference Kershaw1985)). However, as discussed in the Introduction, there have been few field studies on seasonal variations in the biochemical mechanisms of photoprotection in lichens. Our recent work showed that in summer collections of Afromontane lichens, shade forms display much higher NPQ than sun forms collected nearby (Mkhize et al. Reference Mkhize, Minibayeva and Beckett2022). High NPQ in shade forms may protect lichens from occasional rapid increases in light from sunflecks, and reduce ROS formation in water-saturated thalli, which possess reduced rates of CO2 diffusion to the photobionts (Ndhlovu et al. Reference Ndhlovu, Khuzwayo, Minibayeva and Beckett2025). Unlike Mkhize et al. (Reference Mkhize, Minibayeva and Beckett2022), in the present study we were unable to compare sun and shade forms from exactly the same locality. However, all collections were made within the same climatic region (Afromontane) and within a small geographical area. Here we show that within this area, sun and shade collections made in winter display similar NPQ. Furthermore, while in summer, sun forms display much higher values of rETRMAX than shade forms, in the winter no differences in rETRMAX occur. It seems likely that in the winter, rETRMAX is downregulated in sun forms. Collectively, these findings demonstrate seasonal variation in the photosynthetic apparatus of both sun- and shade-adapted lichens from the Afromontane region.
NPQ in winter is similar in both sun and shade collections of Ramalina and Usnea
Winter collections of sun and shade forms of Ramalina and Usnea display similar patterns of NPQ induction and relaxation (Fig. 1B & D). Results are quite different from those of Mkhize et al. (Reference Mkhize, Minibayeva and Beckett2022), who showed that summer collections of shade forms display much higher NPQ than sun forms (Table 2). While Mkhize et al. (Reference Mkhize, Minibayeva and Beckett2022) were able to use sun and shade forms collected nearby, the sites used here were not identical (Table 1). Nevertheless, in the present study the sites used were geographically close to each other and in the same climatic zone, and clearly show that shade forms exhibit winter NPQ values comparable to those of sun forms. This may be because leaf loss will reduce rapid fluctuations in sunlight in the winter. Also, rainfall in the winter is typically much lower than the summer (Nel Reference Nel2009), meaning that thallus water saturation will occur less often. Therefore, the light and water microhabitats of Afromontane sun and shade lichens will differ much less in winter than summer. Recently, Poquita-Du et al. (Reference Poquita-Du, Otte, Herrmann, Büchel and Schmitt2025) studied the effects of light at 60 μmol m−2 s−2 for 3 d on NPQ in isolated symbionts of six species of Trebouxia. Considerable variation in response was found to occur, with some species showing almost no changes, and NPQ increasing in others. Contrary to what might be expected, the light responsiveness of photobiont NPQ showed no obvious relationship to the natural habitats of their host lichens. There are very few field studies of seasonal variations of NPQ in lichens. However, Vráblíková et al. (Reference Vráblíková, McEvoy, Solhaug, Barták and Gauslaa2006) showed that NPQ in collections of the sun lichen Xanthoria parietina (L.) Th. Fr., sampled from an exposed locality in Norway (cold temperate zone), were higher in the summer than the spring, suggesting a greater need for photoprotection in the summer. In contrast, in the present study, no differences in NPQ were found in sun forms when comparing the winter and summer collections. This may suggest that, unlike the cold temperate collections of Xanthoria, during the summer sun forms of Afromontane lichens may upregulate photoprotective mechanisms other than NPQ. These mechanisms could include antioxidative enzymes, the PSII repair cycle, or alternative electron flows around PSI (Khan et al. Reference Khan, Sohail, Li and Fu2025). Interestingly, Poquita-Du et al. (Reference Poquita-Du, Otte, Herrmann, Büchel and Schmitt2025) also exposed isolated Trebouxia photobionts to a higher light treatment (150 μmol m−2 s−1 for 3 d), and found that this treatment induced the expression of genes linked to PSII repair and management of oxidative stress. Nevertheless, downregulation of NPQ in the shade forms used here implies a reduced need for photoprotection in winter, revealing significant NPQ plasticity in the Trebouxia photobionts of Ramalina and Usnea.
CEF and PCEF activity are high in all winter collections of Ramalina and Usnea
CEF occurs in all photosynthetic organisms, and under high light can prevent the over-reduction of PSI and therefore ROS formation, thereby limiting PSI damage (Nawrocki et al. Reference Nawrocki, Bailleul, Picot, Cardol, Rappaport, Wollman and Joliot2019). Here, CEF typically comprised c. 50% of total linear electron flow (LEF) (Figs 2B & D, 3B & D), and did not differ greatly between the sun and shade collections of Ramalina and Usnea. These values are consistent with measurements made by Beckett et al. (Reference Beckett, Roach, Minibayeva and Werth2023) on a range of temperate lichens, and also with data from the free-living alga Chlamydomonas reinhardtii (Alric Reference Alric2014). CEF in lichen photobionts is therefore much higher than in angiosperms, where CEF typically comprises c. 10% of LEF (Avenson et al. Reference Avenson, Cruz and Kramer2004). Furthermore, in contrast to the results presented here, in higher plants it has been shown that sun leaves can display higher CEF than shade leaves (Huang et al. Reference Huang, Yang, Hu and Zhang2015; Kalmatskaya et al. Reference Kalmatskaya, Trubitsin, Suslichenko, Karavaev and Tikhonov2020). However, as discussed above, it seems likely that during the winter months, the microhabitats of the sun and shade collections of lichens are more similar than during the summer. Although speculative, it is possible that during the summer CEF plays a role in the acclimatization of lichen photobionts to generally higher light levels, and this will be tested in future studies.
The main role of PCEF is also to protect PSI, and in photosynthetic organisms from cyanobacteria to gymnosperms it is mediated by a class of proteins called FLVs (Alboresi et al. Reference Alboresi, Storti and Morosinotto2019). FLVs accept electrons downstream of PSI to reduce oxygen to water, stopping PSI from becoming over-reduced, and also protecting PSII. FLVs are particularly active during the first few seconds following an increase in light intensity, before the Calvin-Benson cycle can increase NADPH consumption. Gerotto et al. (Reference Gerotto, Alboresi, Meneghesso, Jokel, Suorsa, Aro and Morosinotto2016) suggested that FLV activity can be estimated by measuring acceptor limitation of PSI (Y[NA]) after illumination for 1 s. Using this method, we previously showed that for temperate lichens a strong positive correlation exists between microhabitat light availability and FLV activity (Beckett et al. Reference Beckett, Roach, Minibayeva and Werth2023). Values of Y[NA] range from 0.7 (high acceptor limitation of PSI, low FLV activity) in the shade lichen Crocodia aurata (Ach.) Link to 0.2 (low limitation, high FLV activity) in the sun lichen X. parietina. Therefore, FLVs may play a universal role in the tolerance of lichens to high light. In the Afromontane lichens tested here, FLV activities are very high (i.e. they have low acceptor limitation), with values of Y[NA] of c. 0.2. There are no particular differences between sun and shade collections (Fig. 1A & C, Table 1). Changes of Y[NA] with time in Ramalina and Usnea resemble those displayed by the temperate sun lichen X. parietina (Beckett et al. Reference Beckett, Roach, Minibayeva and Werth2023). Subtropical Afromontane lichens probably display high FLV activities as a result of the generally high light levels of their microhabitats. Interestingly, FLVs are one of the very few photosynthesis-related proteins that are up- not downregulated in Norway spruce (Picea abies) in the winter (Bag et al. Reference Bag, Shutova, Shevela, Lihavainen, Nanda, Ivanov, Messinger and Jansson2023). It seems likely that Norway spruce needles display strong photoprotection in early spring, when extremely low temperatures coincide with high solar irradiation. In other organisms, FLV activity can be rapidly regulated by factors such as redox state, the availability of electron donors (e.g. NADPH), or even a simple conformational change (Alboresi et al. Reference Alboresi, Storti and Morosinotto2019). As for CEF, in future studies we plan to compare summer collections of sun and shade forms of Ramalina and Usnea to test whether FLVs can contribute to the acclimatization of lichen photobionts to high light. Nevertheless, taken together, the results presented here suggest that high winter CEF and PCEF imply a need for strong baseline PSI protection, independent of microhabitat.
Winter collections of Ramalina and Usnea have low values of rETRII MAX and lk
Lichens have clearly been demonstrated to display seasonal variation in their maximum rates of photosynthesis (e.g. Larson & Kershaw Reference Larson and Kershaw1975a, Reference Larson and Kershawb , Reference Larson and Kershawc ; for review see Kershaw (Reference Kershaw1985)). Here, RLCs indicate that, in the winter, both rETRIIMAX and lk (the light intensity at which saturation sets in) are rather similar in both sun and shade forms of Ramalina and Usnea (Fig. 3A & C, Table 2). The values of rETRIIMAX and lk found here are similar to those of shade collections made during the summer months by Mkhize et al. (Reference Mkhize, Minibayeva and Beckett2022) but, in contrast, much lower than the summer collections of sun forms (Table 2). Data from higher plants suggest that typical sun species have more components of the photophosphorylation electron transport chains, increasing their ability to synthesize ATP and NADPH to fix CO2. This allows them to possess higher activities of Calvin cycle enzymes. The net result is that sun plants typically display higher light-saturation points and maximum rates of photosynthesis (for review see Greer (Reference Greer, Munns, Schmidt, Beveridge and Mathesius2022)). The cost of these adaptations is that sun leaves tend to have high respiration rates, probably because of the increased maintenance needed by the higher activities of photosynthetic cytochromes and other enzymes. It seems likely that, as the season changes from winter to summer, rETRIIMAX and lk increase in Ramalina and Usnea growing in exposed sunny locations, enabling them to take advantage of the longer days with higher light levels. During the winter months when less light is available, levels of photosynthetic cytochromes and other enzymes fall, reducing metabolic costs. In contrast, it seems likely that much less variation exists in the opportunities for photosynthesis in lichens growing in relatively shaded microhabitats, for example well within the tree canopy. Although for such lichens winter leaf fall may temporarily increase light levels, general reductions in day length and overall light levels are occurring. Furthermore, as noted above, Afromontane winters are typically dry, further reducing the potential for photosynthetic activity. The net result is that while sun collections of Ramalina and Usnea show marked seasonal variations in rETRIIMAX and lk, these values appear not to change in shade collections from the winter to the summer.
Conclusions
The results presented here suggest that both sun and shade forms of the Afromontane lichens Ramalina and Usnea display seasonal variations in their photosynthetic apparatus. Although unlike in our earlier study, we were unable to compare sun and shade forms from exactly the same locality, collections made in winter within the same climatic region all display similar NPQ. Comparing the results with those of Mkhize et al. (Reference Mkhize, Minibayeva and Beckett2022) suggests that NPQ is reduced in shade forms during the transition from summer to winter. This presumably reflects a reduced need for photoprotection from sunflecks, and probably also from risks caused by thallus over-hydration reducing CO2 fixation but not photophosphorylation. Interestingly, in contrast, for sun collections of lichens, NPQ remains the same in summer as in winter, while rETRMAX and lk are lower in the winter. This probably reduces the metabolic costs of sustaining high levels of cytochromes and other enzymes, because during the dry, cooler and dimmer winter months less opportunities exist for photosynthesis. In future work, we plan to select specific sites or at least small geographical areas where sun and shade material of Ramalina and Usnea can be collected at different times of the year. This will greatly reduce the possibility that the changes we report here are caused by differences in other site factors such as nutrient availability. Furthermore, we plan to study differences in CEF and PCEF in shade and sun collections of Ramalina and Usnea during the transition from summer to winter. Although the results presented here show that CEF and PCEF activity is already high during the winter months, it could possibly increase further during the summer, at least in sun forms.
Acknowledgements
RPB thanks the University of KwaZulu Natal for research funding and study leave to work at the LMU. Serena Schwenkert is thanked for allowing RPB to use a Walz Dual PAM at LMU. This work was partially performed within the framework of the state assignment of the FRC KazSC RAS.
Author ORCID
Richard P. Beckett, 0000-0002-0530-4244.
Competing Interests
The authors declare none.