Introduction
Diagnosis of depression in bipolar disorder remains a clinical challenge for psychiatrists. According to Diagnostic and Statistical Manual of Mental Disorders, Fifth Edition (DSM-5), diagnostic criteria for major depressive episodes in major depressive disorder (MDD) and of bipolar depression (BD) are identical. However, distinguishing BD from MDD is extremely crucial because they have different clinical characteristics and suicidal risks and may suggest potentially different treatments.Reference Vöhringer and Perlis1 Patients with BD are much more likely to have a family history of bipolar disorder; younger age of depression onset; and higher risk of suicidal acts, mood relapse, hypersomnia, weight gain, and increased appetite than patients with MDD.Reference Angst, Gamma and Benazzi2, Reference Baldessarini, Tondo and Pinna3 However, these features lack sufficient accuracy to precisely identify BD from MDD.
It is important to differentiate between BD and MDD because of the potential treatment implications.Reference Ren, Zhao and Sun4, Reference Fernandes, Gama and Kauer-Sant'Anna5 Several studies suggested the use of blood proteins to discriminate BD from MDD.Reference Ren, Zhao and Sun4, Reference Fernandes, Gama and Kauer-Sant'Anna5 For example, Fernandes et al indicated serum brain-derived neurotrophic factor (BDNF) level as a potential protein biomarker for the differentiation between BD and MDD with 0.94 (P < .001) of the area under the curve (AUC) of the receiver operating characteristic (ROC) analysis (BD vs MDD and controls).Reference Fernandes, Gama and Kauer-Sant'Anna5 A previous study base on the isobaric tags for relative and absolute quantification and liquid chromatography–tandem mass spectrometry technology reported that the dysregulation of several immune- and inflammation-related proteins, such as B2RAN2, B4E1B2, APOA1, ENG, SBSN, QSOX2, ORM1, MRC2, and SLPI, may serve as candidate biomarkers for distinguishing MDD and BD.Reference Ren, Zhao and Sun4
Evidence have confirmed the role of inflammatory processes in the pathomechanisms of BD and MDD and reported that BD and MDD demonstrate altered immunity and metabolic profiles.6-9 Bai et al reported that patients with BD had significantly higher proinflammatory cytokine levels of soluble interleukin (IL)-6 receptor, soluble IL-2 receptor, C-reactive protein (CRP), and soluble tumor necrosis factor (TNF) receptor type 1 than patients with MDD.Reference Bai, Su and Li7 They further found that patients with BD had also significantly higher levels of monocyte chemoattractant protein-1 (MCP-1) than those with MDD, and demonstrated that P-selectin levels were associated with somatic symptoms in depression.Reference Bai, Su and Li7, Reference Bai, Chiou and Su10 In addition, accumulating evidence suggests a role of appetite hormones, such as leptin, insulin, adiponectin, and ghrelin, in the pathophysiology of bipolar disorder and MDD.11-14 Cordas et al reported that patients with BD exhibit lower leptin levels than those with MDD and controls.Reference Cordas, Gazal and Schuch14 Syk et al indicated that leptin levels were elevated in patients with MDD than did controls and were correlated with the severity of depressive symptoms.Reference Syk, Ellstrom and Mwinyi15 Mansur et al found that patients with BD who exhibited low adiponectin levels (<7.5 μg/mL) had fewer psychiatric hospitalizations and higher depressive symptoms than did those with high-adiponectin levels.Reference Mansur, Rizzo and Santos16 Rosso et al reported that patients with BD had lower serum levels of glucagon, glucagon-like peptide-1, and ghrelin and higher levels of glucose-dependent insulinotropic polypeptide compared with patients with MDD.Reference Rosso, Cattaneo and Zanardini9
With the accumulating evidence, several researchers attempted to establish a biomarker-based approach to discriminate BD from MDD.Reference Chen, Zhou and Liu17, Reference Wollenhaupt-Aguiar, Librenza-Garcia and Bristot18 However, none of these markers has been replicated consistently. Furthermore, predicting a disease using a single marker is difficult because numerous potential confounders, such as disease severity and comorbidity, commonly occur together and correlate with each other.Reference Chen, Zhou and Liu17, Reference Wollenhaupt-Aguiar, Librenza-Garcia and Bristot18 The multicollinearity of variables reduces the reliability of regression analysis.
In the current study, we used a classification and regression tree (CRT) analysis to develop a composite predictor of appetite hormones, including leptin, ghrelin, insulin, and adiponectin, and proinflammatory cytokines, including IL-2, IL-6, TNF-α, CRP, P-selectin, and MCP-1, to differentiate BD from MDD. We also compared the predictive powers of the composite predictor with that of any single predictor.
Methods
Participants
Adult patients aged between 20 and 59 years who met the Diagnostic and Statistical Manual of Mental Disorders, Fourth Edition, Text Revision or Fifth Edition (DSM-IV-TR or DSM-5) criteria for BD or MDD and were in the state of major depressive episode were enrolled in current study as the study group. Age- and sex-matched healthy controls who did not have a DSM-IV-TR or DSM-5 diagnosis; who were not pregnant or breastfeeding; and who did not have a severe physical disease (ie, epilepsy, stroke, or systemic autoimmune diseases) or unstable physical illnesses or active infectious diseases (ie, influenza, pneumonia) were enrolled as the control group. In addition, regarding the impact of comorbid metabolic diseases (ie, obesity [BMI > 30], diabetes mellitus, and hyperlipidemia) on the concentrations of cytokines and appetite hormones, those who were obese or had the diagnoses of diabetes mellitus and hyperlipidemia would be excluded both in the case and control groups. For all participants, depressive symptoms were assessed by Montgomery–Åsberg Depression Rating Scale (MADRS). This study was approved by the Institutional Review Board of Taipei Veterans General Hospital and conducted in accordance with the Declaration of Helsinki. Written informed consent was obtained from all participants prior to their enrollment in the study.
Measurement of proinflammatory cytokines and appetite hormones
Fasting serum samples were collected in serum separator tubes, clotted for 30 minutes, and stored at −80°C until use. Proinflammatory cytokines, including IL-2, IL-6, TNF-α, CRP, P-selectin, and MCP-1, were assayed using enzyme-linked immunosorbent assay (ELISA) kits (R&D systems, Minneapolis, MN) for all participants. The appetite hormones, including leptin, ghrelin, insulin, adiponectin, were examined. Ghrelin was measured using a radioimmunoassay (RIA) kit (Peninsula Laboratories, Inc., San Carlos, CA). Insulin concentrations were analyzed using a RIA kit (Coat-A Count Insulin; Diagnostic Product Corporation, Los Angeles, CA). Serum adiponectin level was measured using a quantitative Human Adiponectin ELISA Kit (B-Bridge International, Inc., Mountain View, CA). All assays were performed according to the vendor’s instructions. The final absorbance of each sample of the mixture was measured and analyzed at 450 nm using an ELISA plate reader with Bio-Tek Power Wave Xs and Bio-Tek’s KC junior software (Winooski, VT). The standard range was considered as specified in the vendor’s instructions. A linear regression R-square value of at least 0.95 was considered a reliable standard curve.
Statistical analysis
CRT analysis was nonmodel based to allow intuitive interpretations without predefinitions of possible interactions among factors and provide a straightforward exploration of nonlinear relationships. When compared with other complex modeling techniques, CRT analysis requires small sample sizes (10 events per variable) to obtain a reasonably predictive modeling with stable performance.Reference van der Ploeg, Austin and Steyerberg19 The analysis uses a series of dichotomous splits, such as clinical symptoms (no depression, major depressive episode), levels of proinflammatory cytokines, and appetite hormones (IL-2, IL-6, TNF-α, CRP, P-selectin, MCP-1, leptin, ghrelin, insulin, adiponectin), and other variables, to create a decision tree with the goal of correctly differentiating a diagnosis of BD from MDD. Each independent variable is examined and a split is made to maximize the sensitivity and specificity of the classification, resulting in a decision tree. The objective of pruning is to develop a tree with the best size and lowest misclassification rate.Reference Boerstler and de Figueiredo20 A multiple split is the separation of two or more child nodes from the parent node. For stopping rules, the depth of the tree was set at four levels, and the minimum number of cases of the parent and child nodes were set to 20 and 10, respectively. Gains and risk charts were used to determine the fit of the model. The gains chart indicates the percentage of the target category (BD vs MDD vs control) in each node. The k-fold cross-validation method for random forests establishing the number of sample folds as 10 groups was then used to validate the classification of the decision tree.Reference Blockeel and Struyf21 Finally, a ROC curve was calculated to examine the predictive ability of probabilities for diagnoses of BD or MDD. A two-tailed P-value of less than .05 was considered statistically significant. All data processing and statistical analyses were performed using SPSS (Version 22.0).
Results
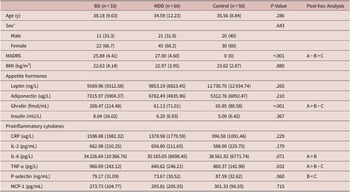
This study included a total of 149 subjects, including 33 with BD, 66 with MDD, and 50 healthy controls (Table 1). The demographic and clinical characteristics of the three groups did not differ for age, sex, body mass index, and levels of leptin, adiponectin, insulin, CRP, IL-2, and MCP-1. Compared with the MDD patients, the post-hoc analysis revealed that the patients with BD demonstrated significantly higher levels of ghrelin, IL-6, and TNF-α, but similar MADRS scores and P-selectin levels.
Demographic Data and Levels of Appetite Hormones and Proinflammatory Cytokines Among Patients with BD, MDD, and the Controls

Abbreviations: BD, bipolar depression; BMI: body mass index; CRP: C-reactive protein; IL: interleukin; MADRS: Montgomery-Asberg Depression Rating Scale; MCP: monocyte chemoattractant protein; MDD: major depressive disorder; TNF-α: tumor necrosis factor-α.
a Data were presented as mean (standard deviation) or count (percentage).
The decision tree analysis indicated that the most powerful predictor for differentiating patients with BD and those with MDD from healthy controls was a MADRS score of >10 (Figure 1, nodes 1 and 2). Patients with BD and those with MDD exhibited MADRS scores of >10, whereas all healthy controls displayed MADRS scores of ≤10. Among patients with BD and MDD, the strongest predictor for differentiating BD from MDD was the ghrelin level (Figure 1, nodes 3 and 4). Compared with the patients with high ghrelin levels (>264.93 fmol/mL), those with low ghrelin levels (≤264.93 fmol/mL) were more likely to be diagnosed as having MDD (75.6% vs 7.7% for patients with high ghrelin levels and those with low ghrelin levels, respectively). Among the patients with MADRS scores of >10 and low ghrelin levels (≤264.93 fmol/mL), the TNF-α level was the most prominent predictor (Figure 1, nodes 5 and 6). Patients with low TNF-α levels (≤1036.84 pg/L, 83.3%) were more likely to have MDD than those with high TNF-α levels (>1036.84 pg/L, 35.7%).
CRT for the differentiation of BD and MDD. Abbreviations: BD, bipolar depression; MADRS, Montgomery-Asberg Depression Rating Scale; MDD, major depressive disorder; TNF-alpha, tumor necrosis factor-α.

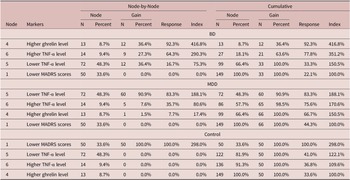
The gain chart demonstrates the predictive power of each model for the target category (Table 2). Nodes were arranged in the descending order of gain score. In the current study, the node with the highest gain score for BD was node 4, which designated patients with high MADRS scores and ghrelin levels of >264.93 fmol/mL (Figure 1 and Table 2). Conversely, the node with the highest gain score for MDD was node 5, which indicated the patients with high MADRS scores, ghrelin levels of ≤264.93 fmol/mL, and TNF-α levels of ≤1036.84 pg/L (Figure 1 and Table 2).
Gain Index of the Classification of BD and MDD

Abbreviations: BD, bipolar depression; MADRS, Montgomery-Asberg Depression Rating Scale; MDD, major depressive disorder; TNF-alpha, tumor necrosis factor-α.
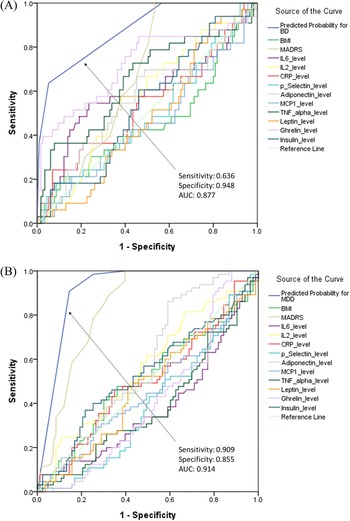
The ROC curve revealed that the predicted probability from the composite of MADRS scores, ghrelin levels, and TNF-α levels driven by the CRT analysis was significantly predictive for BD (AUC = 0.877, P = .001) and MDD (AUC = 0.914, P < .001) compared with individual clinical and demographic factors (all P > .05; Figure 2). Results of the k-fold cross-validation test indicated the stability of the model. Risk estimates (0.548) and standard errors (0.058) of the model were not different from the results of the model without a cross-validation test.
ROC curve of the predicted probability for (A) BD and (B) MDD. Abbreviations: AUC, area under curve; BD, bipolar depression; BMI, body mass index; CRP, C-reactive protein; IL, interleukin; MADRS, Montgomery-Asberg Depression Rating Scale; MCP, monocyte chemoattractant protein; MDD, major depressive disorder; TNF-alpha, tumor necrosis factor-α.

Discussion
Although several variables have reported significant associations between mood disorders, the lack of means of collapsing variables to arrive at a single estimate limited their clinical feasibility and application. In the current study, we used the CRT method to develop a composite predictor of ghrelin and TNF-α levels to differentiate BD from MDD. Patients with BD were more likely to have high levels of ghrelin and TNF-α, whereas low levels of ghrelin and TNF-α were associated with MDD. The predictive power of the composite predictor is much more accurate than that of any single predictor.
Ghrelin is a gut hormone that stimulates appetite and exerts anti-inflammatory properties and antidepressant effects.Reference Himmerich and Sheldrick22, Reference Soczynska, Kennedy and Woldeyohannes23 Previous studies have revealed a great variability in ghrelin levels in patients with MDD. Although some studies have reported that patients with MDD demonstrated higher ghrelin levels than healthy controls,Reference Kurt, Guler and Serteser24, Reference Ozsoy, Besirli and Abdulrezzak25 others have reported lowerReference Barim, Aydin and Colak26 or similar ghrelin levels.Reference Matsuo, Nakano and Nakashima27, Reference Schanze, Reulbach and Scheuchenzuber28 Some reports have observed increased ghrelin levels in patients with MDD after treatment,Reference Pinar, Gulsun and Tasci29 whereas others have observed increased ghrelin levels after treatment.Reference Kurt, Guler and Serteser24 Studies evaluating ghrelin levels in patients with BD are limited. Rosso et al observed that patients with BD demonstrated significantly lower ghrelin levels than healthy controls after adjustment for BMI and sex.Reference Rosso, Cattaneo and Zanardini9 The inconsistency between the results and our findings might be explained by the heterogeneity in comorbidities and medications among the study patients. Notably, most of these studies used healthy subjects as the control group, instead of directly comparing patients with BD and those with MDD. The role of ghrelin as well as other appetite hormones in the pathophysiology of BD and MDD deserves more investigations.
Numerous studies have compared levels of proinflammatory cytokines between BD and MDD; however, no consistent and reliable biomarker was observed to differentiate BD from MDD. This present study showed that patients with BD displayed significantly higher TNF-α levels than patients with MDD. The results were comparable with those of our earlier report,Reference Bai, Chen and Hsu6 but were inconsistent with those reported in the study by Brunoni et al and Mao et alReference Brunoni, Supasitthumrong and Teixeira8, Reference Mao, Zhang and Chen30 Both studies observed lower TNF-α levels in patients with BD relative to patients with MDD, whereas some studies have reported no difference in TNF-α levels between patients with BD and those with MDD.31-33 The controversial findings among studies might be because of several reasons. The first was the confounding effect of heterogeneous clinical characteristics. The second was that most studies did not consider appetite hormones and cytokines simultaneously although inflammatory processes affect both immunity and metabolic profiles. Moreover, establishing a complex association between clinical features and biomarkers was difficult using a traditional regression model. In the present study, we used the CRT method to design a composite predictor considering appetite hormones, proinflammatory cytokines, and clinical characteristics simultaneously. Similar attempts to develop composite factors for the differentiation of BD from MDD have been reported.Reference Brunoni, Supasitthumrong and Teixeira8, Reference Wollenhaupt-Aguiar, Librenza-Garcia and Bristot18 Brunoni et al used z-score transformation to combine levels of IL-6, IL-8, ST2, serum TNF receptor 2, IL-12, and TNF-α for classifying BD and MDD.Reference Brunoni, Supasitthumrong and Teixeira8 Wollenhaupt-Aguiar et al used a machine-leaching approach with three selected variables (IL-4, thiobarbituric acid reactive substances, and IL-10) to differentiate BD from MDD.Reference Wollenhaupt-Aguiar, Librenza-Garcia and Bristot18 These novel analyses would provide further insights into the pathophysiological mechanisms of BD and MDD.
Finally, the application of the serum proteins, such as proinflammatory cytokines and appetite-related proteins in current study, as potential biomarkers in the differentiation between BD and MDD may be in the context of precision psychiatry.Reference Fernandes, Williams and Steiner34 Diverse serum concentrations and gene expression of the aforementioned cytokines and neuropeptides may converge to the same mental condition (ie, major depressive episode) based on Diagnostic and Statistical Manual of Mental Disorders criteria.Reference Vöhringer and Perlis1, Reference Fernandes, Williams and Steiner34 A multi-omics approach of genomics, epigenomics, transcriptomics, proteomics, metabolomics, metagenomics, and lipidomics may provide a possibility of precision psychiatry to define and identify a unique psychiatric diagnosis (ie, BD vs MDD) despite of the similar clinical symptomology (ie, major depressive episode).34-36
The study had several limitations. The first was that because of the cross-sectional study design, the causal relationship between biomarkers and disease diagnoses could not be addressed. Second, patients with BD and those with MDD continued their medications even after enrollment in this study. Previous studies have suggested that antidepressant and mood stabilizers may affect the concentration of inflammatory cytokines, appetite hormones, and glycolipid metabolism in patients with BD and MDD.37-41 Evidences suggested that antidepressant and mood stabilizers may work as anti-inflammatory agents in the hyper-inflammatory states of BD and MDD, but may be harmful for the glycolipid metabolism and appetite hormones.37-41 Hence, the interactions of current and past medications with proinflammatory cytokines and appetite hormones were too complex to be considered. Although allowing patients to continue medications during the clinical study is ethical, a drug-free study may be required to confirm our results. Third, this study analyzed only the predictive performance of serum biomarkers and did not consider neuroimaging evaluations. Previous studies have applied different pattern recognition methods in neuroimaging to make diagnostic predictions of mood disorders;Reference Wolfers, Buitelaar and Beckmann42 therefore, future analyses must combine serum biomarkers and neuroimaging data to enhance the performance of the disease predictors. However, blood tests for biomarkers are much easier and more convenient than neuroimaging exams. Our biomarker-based composite predictor could be considered a screening test before comprehensive psychiatric evaluation. Fourth, the exact matching based on age and sex was not achieved in current study despite the age and sex did not differ statistically. In order to reduce the age- and sex-related bias as could as possible, further studies with the exact matching of age and sex may be necessary to validate our findings.
In conclusion, a composite predictor of ghrelin and TNF-α driven by CRT could assist in differential diagnosis of BD from MDD. High-serum levels of ghrelin and TNF-α were predictive of BD, and low levels of ghrelin and TNF-α were associated with MDD. The predictive performance of the composite predictor was more accurate than that of any single predictor. Further clinical studies are warranted to validate our results and to explore underlying mechanisms.
Funding
The study was supported by grant from Taipei Veterans General Hospital (V106B-020, V107B-010, V107C-181, V108B-012), Yen Tjing Ling Medical Foundation (CI-110-30), and Ministry of Science and Technology, Taiwan (107-2314-B-075-063-MY3, 108-2314-B-075 -037). The funding source had no role in any process of our study.
Author Contributions
Drs M.H.C., K.L.H., and Y.M.B. designed the study. Drs M.H.C. and K.L.H. analyzed the data and drafted the first version of the manuscript. Drs S.J.T. and J.W.H. performed literature search and reviewed the manuscript. All authors contributed substantially to the manuscript, and approved the final manuscript for submission. All authors are responsible for the integrity, accuracy, and presentation of the data.
Disclosure
Kai-Lin Huang, Mu-Hong Chen, Ju-Wei Hsu, Shih-Jen Tsai, and Ya-Mei Bai have no financial relationships relevant to this article to disclose.
Acknowledgment
We thank Mr. I-Fan Hu for his friendship and support.