In second language (L2) instructional settings, the concept of motivation has been used to explain the degree to which students invest attention and effort in learning activities, and there is no shortage of evidence that motivation underpins successful language learning achievement (Dörnyei & Ryan, Reference Dörnyei and Ryan2015). However, research on the sociopsychological aspects of learning has shown that motivation alone, if conceptualized in terms that do not account for the realities of ongoing challenges, setbacks, and pressures, is insufficient to explain successful learning behavior and academic performance (Kaplan, Katz, & Flum, Reference Kaplan, Katz, Flum, Harris, Graham, Urdan, Graham, Royer and Zeidner2012). In the field of language learning, several recent advances parallel this consensus from mainstream education. First, L2 learning motivation is now recognized as a dynamic, situated factor characterized by temporal and contextual variation (Dörnyei, MacIntyre, & Henry, Reference Dörnyei, MacIntyre and Henry2015). In many settings, the everyday reality of instructed language learning involves ups and downs, pressures, and even setbacks (e.g., poor grades, competing deadlines, exam pressure, performance failures). Thus, the fact that most students must struggle and persist during learning to achieve success suggests that, although motivation is critical to L2 learning success, the learning gains that students make can also be lost if they cannot sustain that motivation, remain resistant to setbacks and challenges, and overcome the pressures that are part of the ordinary course of language learning (Ushioda, Reference Ushioda and Griffiths2008).
Parallel to this, language learning research has recently begun to incorporate insights from positive psychology to explore positive qualities to complement the explanatory power of motivation and to help individuals flourish and thrive (e.g., MacIntyre, Gregersen, & Mercer, Reference MacIntyre, Gregersen and Mercer2016). The aim of this domain is to contribute to growth and individual well-being by enhancing learners’ strengths and personal resources (Gregersen, Reference Gregersen, Gabryś-Barker and Gałajda2016). Accounting for the ways in which L2 learners proactively bounce back and step forward from the inevitable challenges of their long-term language learning endeavors necessitates a more positively oriented perspective of the learning process and learners’ well-being (MacIntyre, Reference MacIntyre, Gabryś-Barker and Gałajda2016; Oxford, Reference Oxford, MacIntyre, Gregersen and Mercer2016). In mainstream education, for instance, a considerable amount of work has been done to explore how constructs such as grit (Duckworth, Peterson, Matthews, & Kelly, Reference Duckworth, Peterson, Matthews and Kelly2007), hardiness (Maddi, Reference Maddi2013), mind-sets (Dweck, Reference Dweck2006), and self-control (Duckworth & Steinberg, Reference Duckworth and Steinberg2015) mediate fundamental motivational qualities for student learning, and there is similar potential to explore the positive affective attributes of language learners. Although some work in this area is controversial and is still in its early stages, the relevance and contributions of this domain to our field are “immediately apparent when one considers the practical, human, and social dimension of language learning” (MacIntyre & Mercer, Reference MacIntyre and Mercer2014, p. 156).
As part of this larger body of work, Martin and Marsh (Reference Martin and Marsh2008a) have proposed the concept of academic buoyancy—the capacity of students to navigate challenges that are typical of the ordinary course of school life and to successfully deal with academic setbacks. Academic buoyancy encompasses building individual strengths by emphasizing a proactive rather than reactive approach to setbacks and challenges in the learning sphere. Because language learning has all the characteristics of a subject that requires buoyancy for ultimate learning success, buoyancy complements motivation and falls partly under its rubric: Buoyancy sustains motivation thereby providing learners with the capacity to negotiate the ups and downs of everyday language learning, sustain prolonged effort, and overcome setbacks on the path to L2 learning success (cf. Martin, Colmar, Davey, & Marsh, Reference Martin, Colmar, Davey and Marsh2010).
In this article, we examine the relevance of this novel construct, academic buoyancy, to L2 motivation and achievement. Adopting the standard research design found in this domain, we first set out to investigate the extent to which buoyancy exists for L2 language learning by examining the typical buoyancy profiles of second language learners; we then investigated the relationship between buoyancy, its motivational predictors, and its concrete L2 learning outcomes.
CONCEPTUALIZING BUOYANCY
Buoyancy functions as an adaptive response to frequent, ordinary, and temporary setbacks and challenges in educational settings. It is the capacity to deal with current and ongoing challenges and demands by regulating attention, emotion, and behavior adaptively and positively (Martin & Marsh, Reference Martin and Marsh2008a). Given the abundance of generalized resistance resources in the character strengths and positive psychology literature, the question of construct distinctness is important. Buoyancy can be thought of as a specific focal point in a spectrum of concepts whose interrelationships require further exploration in language learning research. Conceptually, buoyancy is relevant to everyday problems and anxieties that interrupt learners’ motivation and engagement in the learning process by threatening their self-confidence and persistence. Its cognate construct, resilience, has been argued to be qualitatively different from buoyancy given that resilience relates more closely to extreme adversity or debilitating threats to development, such as consistent disengagement and self-handicapping, and opposition to or alienation from others in school settings (see Martin & Marsh, Reference Martin and Marsh2006, Reference Martin and Marsh2009; Masten, Reference Masten2001). Hardiness, by contrast, is a personality disposition that is thought to moderate the impact of psychosocial stressors on mental and physical health (e.g., symptoms of clinical depression) through positive cognitive appraisals that lead to existential meaning-making (Maddi, Reference Maddi2013). Finally, grit is posited to be a trait-level perseverance and maintained passion for superordinate goals (Duckworth et al., Reference Duckworth, Peterson, Matthews and Kelly2007); it thus foregrounds the sustained and intentional pursuit of a long-term (i.e., on a timescale of years or decades) outcome (Duckworth & Quinn, Reference Duckworth and Quinn2009). Buoyancy, for its part, is proposed to address how students negotiate the inevitable ups and downs of everyday academic life and how they cope with frequent stressful learning situations and experiences. For this reason, it is relevant to a large portion of the student population across a variety of settings (Martin, Ginns, Brackett, Malmberg, & Hall, Reference Martin, Ginns, Brackett, Malmberg and Hall2013). By framing the distinctions between these constructs as one related to the specificity of their respective focus, concepts in this domain of character strengths might be seen as complementing each other like pieces of a puzzle (e.g., Oxford, Reference Oxford, MacIntyre, Gregersen and Mercer2016).
RESEARCH ON BUOYANCY
Commencing just under a decade ago, early studies of academic buoyancy (Martin et al., Reference Martin, Colmar, Davey and Marsh2010; Martin & Marsh, Reference Martin and Marsh2008b) have illustrated that buoyancy offers unique explanatory value for outcomes such as engagement, class participation, persistence in the face of difficulty, and academic achievement within the context of secondary school classrooms.Footnote 1 The results of investigations across mathematics, science, L1 English, and physical education indicate that buoyancy’s sustaining power is not relative to perceptions of competence, difficulty, and effort in these subjects (Malmberg, Hall, & Martin, Reference Malmberg, Hall and Martin2013). Students across all school subjects who have higher levels of buoyancy are significantly more engaged and have better academic outcomes overall, and this effect remains robust even for individuals identified as having moderate learning disabilities (Martin, Reference Martin2014; Martin et al., Reference Martin, Ginns, Brackett, Malmberg and Hall2013; Martin, Yu, Ginns, & Papworth, Reference Martin, Yu, Ginns and Papworth2017). Furthermore, in pressurized educational settings (e.g., characterized by performance orientations and test-taking anxiety) buoyancy is distinct from other qualities that enable an individual to adapt and function productively, such as coping and dispositional optimism (Putwain & Daly, Reference Putwain and Daly2013; Putwain, Connors, Symes, & Douglas-Osborn, Reference Putwain, Connors, Symes and Douglas-Osborn2012; Putwain, Daly, Chamberlain, & Sadreddini, Reference Putwain, Daly, Chamberlain and Sadreddini2016). Most of this work has echoed the need to explore the domain specificity of this motivational construct (Martin & Marsh, Reference Martin and Marsh2008a).
Research in the development of buoyancy has uncovered a core of motivational predictors, referred to as the 5Cs: self-efficacy (i.e., confidence), planning (coordination), persistence (commitment), low anxiety (composure), and self-regulation (control) (e.g., Collie, Martin, Malmberg, Hall, & Ginns, Reference Collie, Martin, Malmberg, Hall and Ginns2015). Empirical evidence has shown that buoyancy mediates these fundamental factors as well as relational characteristics of the wider social environment (e.g., teacher–student relationship) that help learners turn adversity into advantage (Martin, Reference Martin2013; Martin et al., Reference Martin, Ginns, Brackett, Malmberg and Hall2013). The significance of these motivational antecedents has been observed with a range of ages and ethnicities, in both genders, and across longitudinal datasets (e.g., Martin et al., Reference Martin, Yu, Ginns and Papworth2017). Buoyancy, in turn, has been shown to predict important educational outcomes including school engagement, class participation, learning persistence, and overall achievement (Martin, Reference Martin2013, Reference Martin2014). The combined evidence from these studies suggests that buoyancy represents an essential capacity that enables students to successfully navigate setbacks and experiences of academic difficulty (Collie et al., Reference Collie, Martin, Bottrell, Armstrong, Ungar and Liebenberg2017). However, buoyancy has yet to be examined in the context of L2 learning. As this article is designed to bridge this gap, we turn now to examining the conceptual equivalents within L2 learning of the motivational predictors of buoyancy.
MOTIVATIONAL PREDICTORS OF BUOYANCY
Considering previous evidence, the standard framework is one in which buoyancy mediates a number of fundamental constructs (e.g., Martin & Marsh, Reference Martin and Marsh2008b). Adjusted to fit a language learning environment, six hypothesized predictors of L2 buoyancy emerge: self-efficacy, self-regulation, persistence, L2 anxiety, teacher–student relationships, and the ideal L2 self. In the following text, we outline the role each is hypothesized to play in buoyancy, with a particular emphasis on L2 learning.
Self-Efficacy
Self-efficacy is a core construct in educational research because of the strong empirical relationship between self-efficacy beliefs, motivation, and behavior (Dörnyei & Ryan, Reference Dörnyei and Ryan2015). In academic settings, these beliefs play an important role in how learners feel and think, and how they motivate themselves and behave (Schunk & Pajares, Reference Schunk, Pajares, Elliot and Dweck2005). In L2 learning, self-efficacy has often been termed linguistic self-confidence (Mills, Reference Mills, Mercer and Williams2014). It has been shown that a high sense of efficacy is positively associated with L2 achievement (Hsieh & Kang, Reference Hsieh and Kang2010), with specific language skills such as writing, reading, and listening (Graham, Reference Graham2011; Mills, Pajares, & Herron, Reference Mills, Pajares and Herron2006, 2007), and with L2-related task performance (Hsieh, Reference Hsieh2008). In our model, we test whether, as in other school subjects (Martin, Reference Martin2013), self-efficacy predicts academic buoyancy in the context of L2 learning.
Self-Regulation
In educational domains, self-regulation refers to the purposeful individual control of motivation, thoughts, emotional states, and patterns of behavior in ways needed for successful achievement (Schunk & Zimmerman, Reference Schunk and Zimmerman2012; Sitzmann & Ely, Reference Sitzmann and Ely2011). Self-regulation strategies play a major facilitating role in buoyancy (i.e., planning/control) because problem solving and managing strategic effort are closely connected with how buoyant learners monitor their performance, adjust their appraisals of the task at hand and their expectancy for success, and adapt their behavior to work through academic adversity and challenge (Martin & Marsh, Reference Martin and Marsh2008a, Reference Martin and Marsh2009). In the sphere of L2 learning, students’ own active and creative participation in the learning process falls under the rubric of self-regulated learning strategies (Oxford, Reference Oxford2017). Current work in this area underscores the power of self-regulated learning strategy use in accentuating L2 learners’ capacity to successfully accomplish L2 learning goals (Oxford & Amerstorfer, 2018). We therefore test the hypothesis that strategic self-regulation is a salient factor in language learners’ capacity for buoyancy even in the face of academic difficulties.
Persistence
From the perspective of buoyancy, persistence is aligned with the intrinsic value a learner ascribes to a task, which makes the learner more likely to engage with and persist through a given task or activity (Martin et al., Reference Martin, Colmar, Davey and Marsh2010). The capacity to persevere can also be considered an important aspect of L2 learning motivation given that it relates to how likely a learner is to steadily endure in the face of the evolving difficulties or ups and downs that accompany this learning journey (Dörnyei & Ottó, Reference Dörnyei and Ottó1998; Dörnyei, Henry, & Muir, Reference Dörnyei, Henry and Muir2016). While the underlying psychological mechanisms for persistence toward a superordinate goal remain underexplored, in buoyancy research, the persistence factor (i.e., commitment) is directly associated with outcomes such as class participation and overall enjoyment of school (Martin & Marsh, Reference Martin and Marsh2006). Hence, we expect persistence to contribute meaningfully to buoyancy, and we assess its predictive value in the present study.
Anxiety
Anxiety is a factor inherent to language learning and can be found in most classroom environments (Horwitz, Reference Horwitz2010). Research on the relationship between language anxiety and language achievement indicates a negative relationship (Gregersen & MacIntyre, Reference Gregersen and MacIntyre2014; MacIntyre & Gregersen, Reference MacIntyre and Gregersen2012): With few exceptions, elevated levels of anxiety result in lower performance and language achievement. Anxiety is also negatively associated with students’ ability to deal with academic setback and challenge given that it leads to performance decreases, negative affect, negative cognition, and debilitating physical sensations. Conversely, the evidence in relation to buoyancy and important learning outcomes indicates that low anxiety facilitates the development of buoyancy (Martin & Marsh, Reference Martin and Marsh2008a, Reference Martin and Marsh2009). Anxiety is a key predictor of buoyancy given that tension, apprehension, and nervousness can debilitate individual academic performance and development in learning (Putwain et al., Reference Putwain, Connors, Symes and Douglas-Osborn2012, Putwain et al., Reference Putwain, Daly, Chamberlain and Sadreddini2016). In line with previous research, we expect anxiety to contribute negatively to buoyancy and test this prediction.
Teacher–Student Relationship
Despite its clearly social objectives, language teaching has tended to be regarded primarily as a cognitive activity (Kubanyiova & Crookes, Reference Kubanyiova and Crookes2016). Existing research on the effects of supportive teacher–student relationships on L2 learners’ engagement, classroom participation, or success in learning indicate that teachers play a central mediating role in the dynamics of classroom ecology and in learners’ engagement within L2 instructed settings (Joe, Hiver, & Al-Hoorie, Reference Joe, Hiver and Al-Hoorie2017; Scarino, Reference Scarino2014). Buoyancy also sees the relational dimension of teaching, often associated with teachers’ socioemotional support for students, as closely tied to students’ classroom perceptions, behaviors, and outcomes (Martin & Marsh, Reference Martin and Marsh2008a). For instance, there is evidence that teachers’ enthusiasm for teaching, mediated through their instructional practices, impacts their students’ intellectual curiosity, value of the subject, investment of effort, sense of competence, and desire for genuine approval (Butler & Shibaz, Reference Butler and Shibaz2014; Frisby & Martin, Reference Frisby and Martin2010). For this reason, the teacher–student relationship is considered a leading predictor of buoyancy, and we test this assumption in our own data.
The Ideal L2 Self
The L2 Motivational Self System (Dörnyei, Reference Dörnyei2005, Reference Dörnyei, Dörnyei and Ushioda2009) has generated “an exceptional wave of interest” (Dörnyei & Ryan, Reference Dörnyei and Ryan2015, p. 91), primarily because of the ideal L2 self’s strong association with intended effort (e.g., Al-Hoorie, Reference Al-Hoorie2016a, Reference Al-Hoorie2016b, Reference Al-Hoorie2017; Dörnyei & Chan, Reference Dörnyei and Chan2013; Lamb, Reference Lamb2012; Moskovsky, Assulaimani, Racheva, & Harkins, Reference Moskovsky, Assulaimani, Racheva and Harkins2016). As Dörnyei and Kubanyiova (Reference Dörnyei and Kubanyiova2014) explain, the ideal L2 self is thought to be an effective motivator when the learner has a desired, elaborate, vivid, plausible, and regularly activated future self-image. Because the ideal L2 self is a domain-specific notion, it has not been tested in the context of academic buoyancy previously. Buoyancy research has taken its cues from general motivation research and the expectancy–value components of why an individual would choose one course of action over another and strive toward that goal (i.e., planning/control) (Martin et al., Reference Martin, Colmar, Davey and Marsh2010). However, as a parallel, the vivid imagery of one’s ideal L2 self—which represents the attributes that they would ideally like to, but do not now, possess—may encompass information and procedures that are of consequence in achieving a successful L2 learning outcome (Dörnyei, Reference Dörnyei, Dörnyei and Ushioda2009). Because of the importance of the ideal L2 self in contemporary L2 motivation research, here we examine whether the ideal L2 self functions as a predictor of buoyancy.
The Present Study
In the present study, we have adopted and adapted the standard framework and methods to examine whether buoyancy exists as a researchable concept with a valid and reliable measurement specific to the language learning domain, and whether it might influence key L2 learning outcomes. Following the rationale and design of previous research in this domain, the purpose of this study was twofold. First, we used cluster analysis to investigate our first hypothesis that
H1: Distinct buoyancy profiles exist within the domain of second language learning.
Cluster analysis follows the person-based approach to modeling buoyancy (i.e., a design that compares people or groups), and so can identify salient groupings of students that can then be interpreted substantively. A two-step clustering procedure was chosen because of its ability to handle high-dimensional datasets, and to avoid the arbitrariness of using hierarchical or K-means clustering in isolation (Everitt, Landau, Leese, & Stahl, Reference Everitt, Landau, Leese and Stahl2011). The hypothesized predictors were selected for determining cluster membership (i.e., self-efficacy, strategic self-regulation, persistence, ideal L2 self, anxiety, teacher–student relationship), while buoyancy served as the criterion variable (i.e., an external validation variable that is not used to determine cluster membership) for the cluster model.
Second, consistent with our review of the theoretical and empirical work on buoyancy, we examined predictors and tested links between constructs through structural equation modeling (SEM). SEM is a variable-based approach, and so it allowed us to test our second hypothesis that
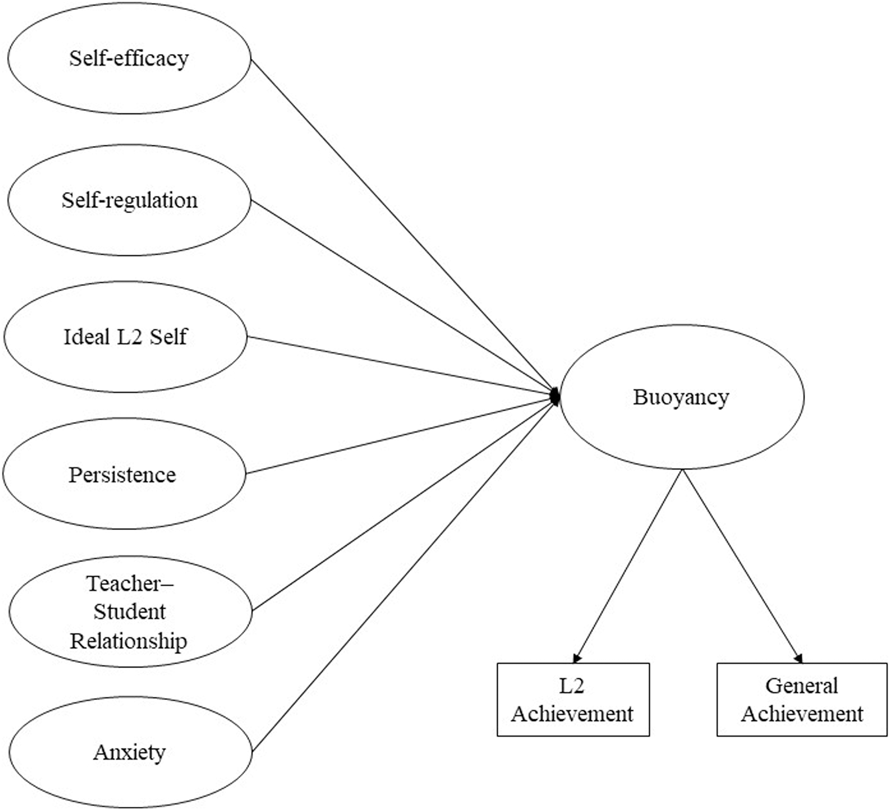
H2: Buoyancy mediates the effect of the independent predictors (self-efficacy, strategic self-regulation, persistence, ideal L2 self, anxiety, and teacher–student relationship) on both L2 achievement and general academic achievement (Figure 1).
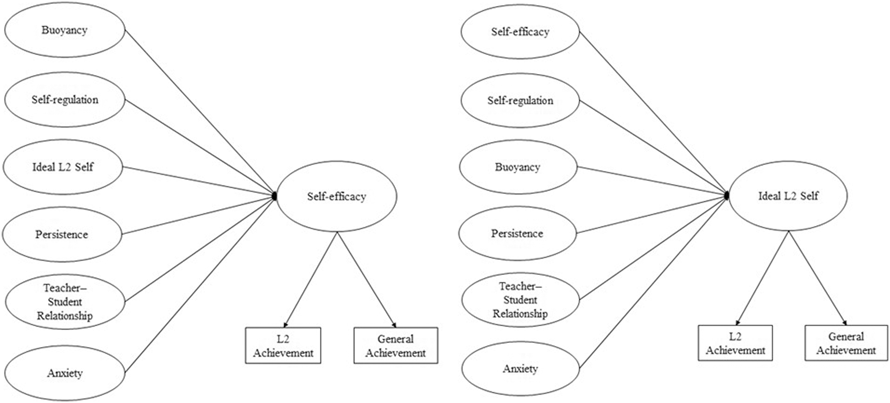
To avoid the type of confirmation bias common in SEM, we also tested a number of competing models. Specifically, we tested the fit of the model when each of the hypothesized predictors (e.g., self-efficacy, the ideal L2 self, anxiety) is successively used as the mediator instead of buoyancy to examine how well each model accounts for the data. As an illustration, Figure 2 presents two of the competing models tested. We then added prior achievement to the model demonstrating the best fit of these competing models.
The hypothesized model of academic buoyancy.

Two competing models tested.

METHOD
PARTICIPANTS
The participants were 787 (female = 356) Korean college-level learners of English (age range = 18–25, M = 20.4 years old, SD = 1.97). Using quota sampling, respondents were sampled from six large public and private universities located in Seoul, Korea, and the most densely populated regions immediately surrounding the capital. Each of these six universities features a student body with varied backgrounds and a range of L2 ability levels that ensured representation of heterogeneous socioeconomic strata, academic backgrounds and majors, and the entire age range of college undergraduates (see Appendix B for detailed breakdown). While some differences may have existed with regard to L2 curricula or class size, to reduce variation we chose students from similar language learning environments featuring single-semester, credit-bearing language classes for general purposes (i.e., EGP) that were taught by L1 users and culminated in the TEPS standardized language exam (see Choi, Kim, & Boo, Reference Choi, Kim and Boo2003 for review of this test). Participants reported no independent L2 study outside of the compulsory classroom setting, and no study abroad experience—two exclusion criteriaFootnote 2 we used while sampling.
INSTRUMENT
A questionnaire was developed by adapting items from existing measurement instruments to assess academic buoyancy along with six hypothesized predictors from the literature. All items utilized a six-point response scale, ranging from strongly disagree to strongly agree (see Online Supplementary Materials). Items were administered following standard practice to avoid bias (i.e., items were mixed together). The items were first submitted to Mokken scale analysis—a nonparametric item response theory model—using MSP5 (Molenaar & Sijtsma, Reference Molenaar and Sijtsma2000). This procedure aimed to ascertain the unidimensionality of each scale as well as its convergent and discriminant validity (see Meijer & Baneke, Reference Meijer and Baneke2004). The results showed no discriminant validity between buoyancy and persistence, and therefore the latter was dropped from further analyses (we discuss the implications of this finding later in this article).
The following is a summary of each scale along with its reliability and homogeneity (H; >.30 weak, >.40 medium, >.50 strong; see Mokken, Reference Mokken1971):
(1) Buoyancy (4 items, H = .67, rho = .87, α = .87). This scale was adapted from Martin and Marsh (Reference Martin and Marsh2008a) to assess learners’ ability to overcome the everyday stress, setbacks, and pressures that occur in the ordinary course of L2 learning.
(2) Self-efficacy (3 items, H = .57, rho = .78, α = .77). This scale was adapted from Mills et al. (Reference Mills, Pajares and Herron2006) to measure learners’ beliefs and confidence in their capabilities as L2 users.
(3) Strategic self-regulation (2 items, H = .62, rho = .77, α = .75). This scale was adapted from Tseng, Dörnyei, and Schmitt (Reference Tseng, Dörnyei and Schmitt2006) to measure the strategic effort of learners to manage their L2 achievement through specific preplanning processes.
(4) Ideal L2 self (5 items, H = .73, rho = .92, α = .92). This scale was adapted from Taguchi, Magid, and Papi (Reference Taguchi, Magid, Papi, Dörnyei and Ushioda2009) to measure students’ desired future images of themselves as competent L2 speakers.
(5) Anxiety (7 items, H = .68, rho = .93, α = .93). This scale was adapted from the Foreign Language Classroom Anxiety Scale (Horwitz, Horwitz, & Cope, Reference Horwitz, Horwitz and Cope1986) to measure learners’ negative feelings and behavior related to language learning.
(6) Teacher–student relationship (4 items, H = .81, rho = .93, α = .92). This scale was adapted from Frisby and Martin (Reference Frisby and Martin2010) to assess characteristics of students’ classroom relationships with their L2 teachers.
Finally, we obtained a current-semester standardized L2 exam score—reviews of the TEPS show comparability to the TOEFL (Choi et al., Reference Choi, Kim and Boo2003)—and grade point average (GPA) from each respondent as respective measures of their L2 achievement and general academic achievement. All scores were obtained using respective colleges’ results database with the express consent of respondents. For 197 participants, we were also able to obtain a standardized language exam score (i.e., other than the TEPS) from the previous year. Because of this reduction in sample size, we controlled for prior achievement in a separate step in the analysis (we also discuss the potential limitation of this sample size later).
PROCEDURE
The questionnaire was translated into the respondents’ L1 by a nonaffiliated researcher familiar with the principles of questionnaire construction and back-translated by us for consistency. Following ethics approval, the questionnaire was piloted with 51 participants from a university in an adjacent region. We began by approaching school administration and teaching faculty in universities regionwide during the first few weeks of the school year, and we obtained written institutional consent and verbal participant assent. The research assistant administering the questionnaire in each institution informed students from participating schools about the purpose of the survey, reminded them that participation was entirely voluntary, and assured them of the confidentiality of their responses. Students from the colleges that agreed to participate completed the survey during private-study class periods in the final weeks of the fall semester. Throughout, the participants were treated in accordance with APA ethical guidelines.
Results
In this section, we report on our analyses sequentially. In the first phase, cluster analysis using IBM SPSS 22 (IBM Corp., 2013) was used to identify prominent profiles of buoyancy in this sample of learners, while the second phase used SEM using Amos 22 (Arbuckle, Reference Arbuckle2013) to examine relationships between buoyancy, its motivational predictors, and the achievement-related outcomes.
BUOYANCY PROFILES
Clustering variables were screened for multicollinearity and normality of distribution. Model selection was determined using Schwarz’s Bayesian information criterion, and the log-likelihood distance proximity measure (Kaufman & Rousseeuw, Reference Kaufman and Rousseeuw2005)—relatively more conservative measures that avoid overfitting models. By comparing movement of cluster means and the overall cluster-solution quality, our analysis indicated that the dataset could best be partitioned into five meaningfully distinct groups corresponding to particular buoyancy profiles (Table 1). Thus, using the five clustering variables (i.e., self-efficacy, strategic self-regulation, ideal l2 self, anxiety, and teacher–student relationship), a final 5-cluster solution was settled on. These combined factors, at varying levels, characterized the salient outcomes of buoyancy presented in the following text. Validity of this final cluster solution was established by first examining the univariate main effects and conducting pairwise comparisons using Tukey’s HSD post-hoc test (Table 1). A significant univariate main effect for cluster membership was obtained for the criterion variable buoyancy, F(4, 782) = 223.79, p < .001, partial η 2 =.534, power > .999. Finally, classification accuracy was performed using multinomial logistic regression to assess the model’s predictive utility. The conventional benchmark is a 25% improvement over the proportional by-chance rate of accuracy (Everitt et al., Reference Everitt, Landau, Leese and Stahl2011). The proportional by-chance accuracy criterionFootnote 3 was 31.25% (1.25 × 25%), and the classification matrix indicated that 54.5% of cases in the sample were correctly classified into the five clusters while no cluster had lower than a 30% accuracy rate. Taken together, these validation measures indicated that the final cluster solution was a meaningful and robust way to partition the multivariate dataset.
Cluster profiles

Note: N = 787. Buoyancy served as the criterion variable for validation and was not used in determining the clustering solution. All F-values are significant at the p < .001 level. T–S relationship = Teacher–student relationship. df = 4.
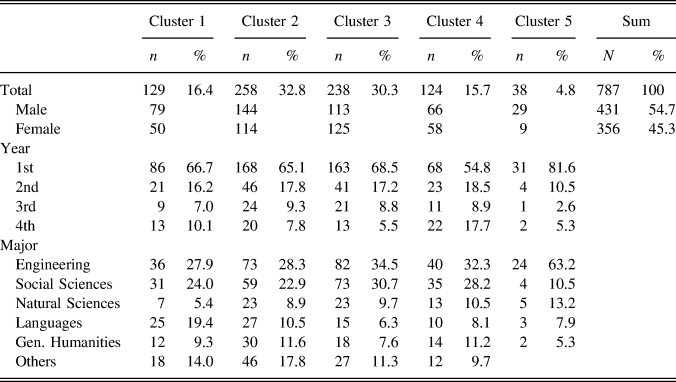
Columns in Table 1 focus on cluster membership and size, while rows show the mean values for each of the five clustering variables along with comparisons between the clusters. These profiles provide support for the existence of distinct buoyancy profiles within the domain of L2 learning and lend general credence to this construct with respect to its motivational predictors. Following convention in previous studies, we briefly describe each emerging cluster and give it a descriptive label reflecting its degree of buoyancy. Detailed cluster composition (i.e., gender, year, college major) is shown in Appendix B.
The Thriver Profile
Cluster 1 corresponded with what may be described as a thriver profile. This highly buoyant cluster comprises L2 learners (16.4%) who had exceptionally high levels of self-efficacy (M > 5.0), possessed a particularly strong ideal L2 self, exhibited a robust capacity to strategically self-regulate their learning experiences, and reported extremely productive relationships with their teachers. This was complemented by the lowest level of anxiety of all the clusters (M < 2.0).
The Engaged Profile
Cluster 2, which we labeled the engaged profile, scored relatively high on the positive indicators of buoyancy as well as on the criterion measure of buoyancy (M > 4.0). This cluster (32.8% of learners) could be portrayed as language learners with high levels of self-efficacy and strategic self-regulation. They possessed prominent ideal L2 selves and, despite experiencing moderate levels of anxiety (M > 3.0), reported having close and supportive relationships with their L2 teachers.
The Striver Profile
Cluster 3 corresponded with a striver profile. Learners in this cluster (30.3%) scored in the mid-range for the criterion measure buoyancy. They could be described as individuals with medium levels of self-efficacy (M > 3.0), and average levels of strategic self-regulation. They possessed a moderate ideal L2 self, but also experienced slightly above average anxiety and reported somewhat ambivalent relationships with their teachers.
The Dependent Profile
Cluster 4, which we labeled the dependent profile, could be characterized as learners (15.7%) with the lowest self-efficacy and strategic self-regulation (both M < 3.0), who also exhibit the highest anxiety (M = 4.8). This mix of an overall inferior ideal L2 self, some very low scores on the positive dimensions of buoyancy, and the highest score on its negative indicator is reflected in the significantly lower score on the buoyancy criterion measure (M < 3.0) indicating a tension between these components.
The Disengaged Profile
Cluster 5 corresponded to a disengaged profile (4.8% of learners), who had markedly lower anxiety than those in clusters 2, 3, and 4. Their capacity for strategic self-regulation was uncommonly low, and this was combined with modest levels of self-efficacy and conspicuously poor relationships with their L2 teachers (M < 2.5).
Overall, therefore, our cluster model is consistent with the results from research reviewed earlier: The various hypothesized factors emerged as predictors of distinct buoyancy profiles. At the same time, these buoyancy profiles also raise interesting questions for our follow-up analyses. For instance, it is unclear why two buoyancy profiles with nearly identical levels of anxiety (Cluster 1 vs. Cluster 5) would be at such extremes on the buoyancy continuum, or how two clusters with a significant difference in their anxiety level (Cluster 4 vs. Cluster 5) have similar levels of buoyancy. The next part of our analysis sheds more light on these results.
MEDIATION OF BUOYANCY
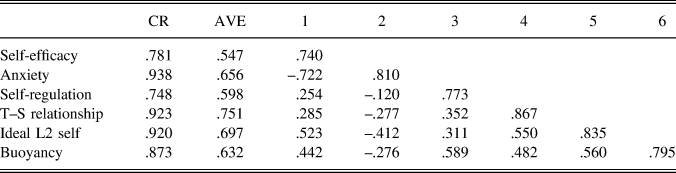
The measurement model showed good fit, χ2(260) = 766.526, p < .001, χ2/df = 2.948, CFI = .962, TLI = .956, RMSEA = .050, PCLOSE = .527. All factor loadings were significant and more than .70, except for one item for self-efficacy (.61). Most standardized residuals were below ±2, and none exceeded ±2.5, suggesting adequate fit of the observed to the estimated covariance terms. Table 2 also shows that the model had acceptable convergent and discriminant validity (see Hair, Black, Babin, & Anderson, Reference Hair, Black, Babin and Anderson2010). There were no missing data to handle.
Reliability and validity of constructs in the measurement model and their inter-construct correlations

Note: N = 787. AVE = average variance extracted, CR = construct reliability, T–S relationship = teacher–student relationship. Values in the diagonal are the square roots of their respective AVE.
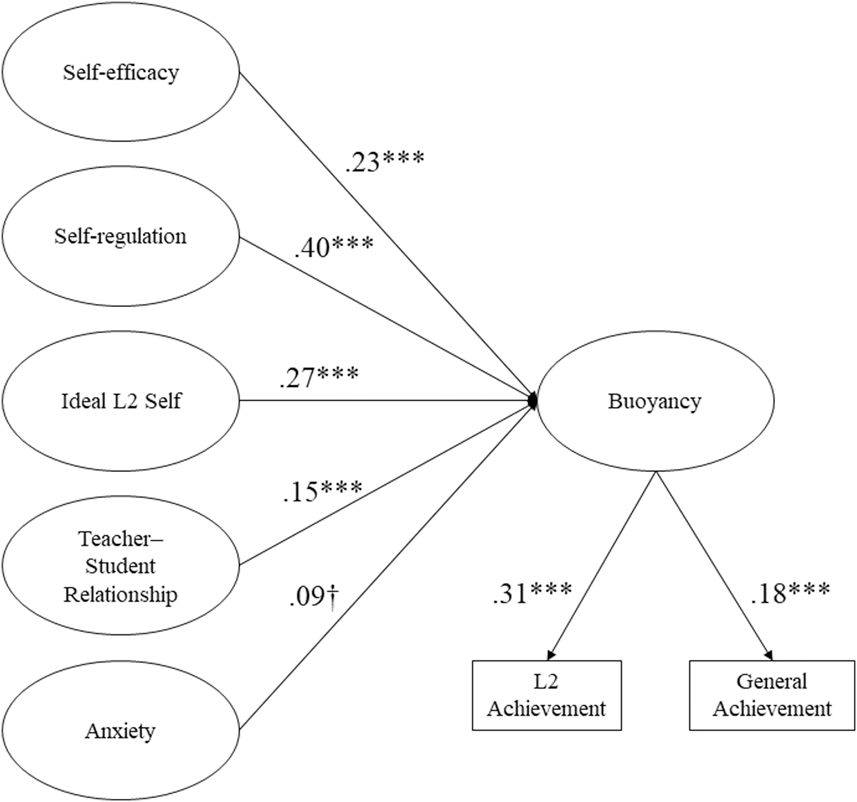
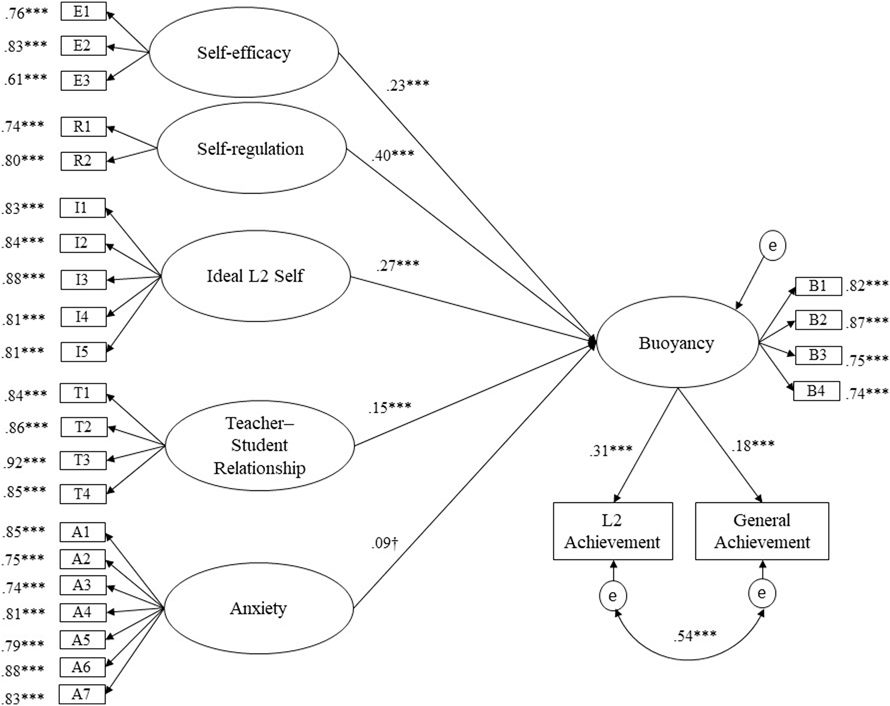
Allowing the predictors to covary, the model in Figure 1 showed a good fit, χFootnote 2(308) = 844.578, p < .001, χ2/df = 2.742, CFI = .961, TLI = .956, RMSEA = .047, PCLOSE = .895. The basic results of this model are presented in Figure 3. The full model is available in Appendix A.
The results of the primary model. Note. † p < .10, *** p < .001.

The results showed that, except for anxiety, all hypothesized predictors (i.e., self-efficacy, strategic self-regulation, ideal L2 self, and teacher–student relationship) predicted buoyancy highly significantly. Buoyancy, in turn, predicted both L2 achievement and general achievement.
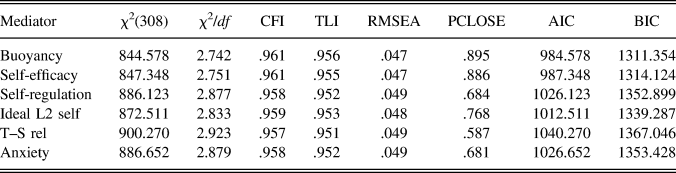
The alternative models were subsequently tested. Table 3 shows the fit of the five competing models and compares it with the model in which buoyancy is the mediator. Because these models are nonhierarchical, the most informative fit indices are the AIC and BIC values, according to which lower values indicate better fit (Kline, Reference Kline2016). As shown in Table 3, the model where buoyancy is the mediator exhibited the best fit, followed by the model with self-efficacy.
Model fit for each of the competing models tested

Note: AIC = Akaike Information Criterion, BIC = Bayesian Information Criterion, CFI = Bentler's Comparative Fit Index, PCLOSE = p of Close Fit, RMSEA = Root Mean Square Error of Approximation, TLI = Tucker-Lewis Index, T–S rel = teacher–student relationship. All χ2 < .001.
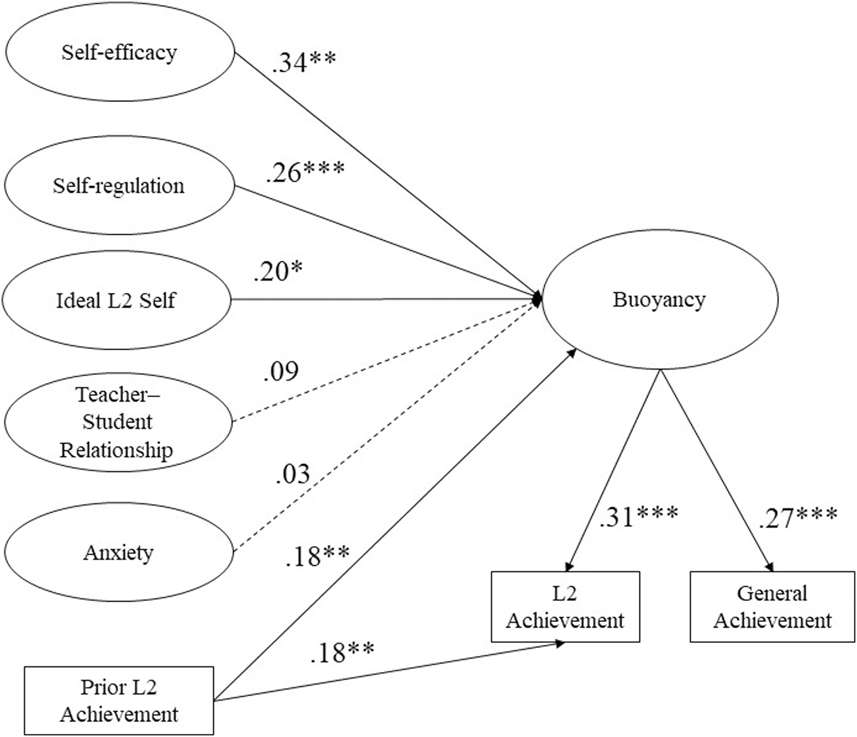
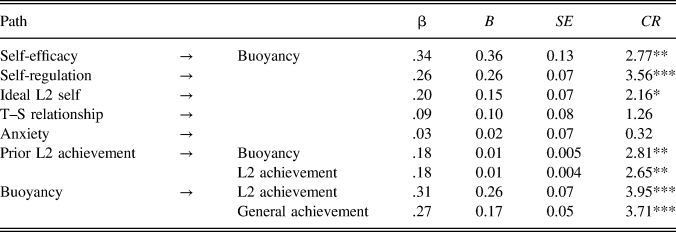
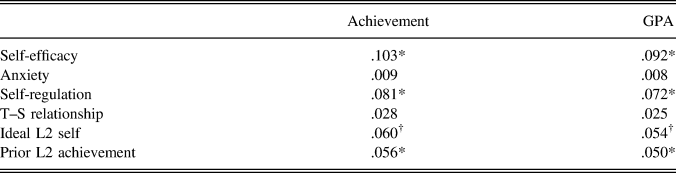
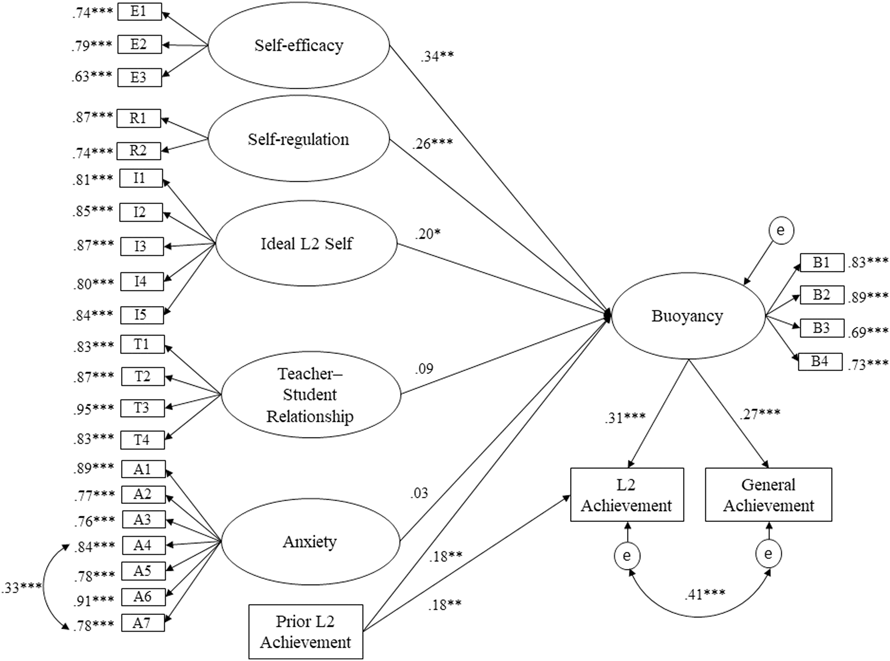
Finally, prior L2 achievement was added to the buoyancy model, χ2(327) = 524.993, p < .001, χ2/df = 1.605, CFI = .946, TLI = .937, RMSEA = .056, PCLOSE = .147. This model (N = 197) showed that neither anxiety nor teacher–student relationship were significant predictors of buoyancy (see Figure 4 and Table 4). This model—indirect effects for which are reported in Table 5—also showed that buoyancy remained a significant predictor of the outcome variables over and above prior L2 achievement.
The model with prior L2 achievement. Note. ** p < .01, *** p < .001.

Standardized and unstandardized coefficients, standard errors, and critical ratios for the two final models

Note: N = 197. T–S relationship = teacher–student relationship.
* p < .05, ** p < .01, *** p ≤ .001.
Standardized indirect effects of the predictors on the two outcome variables

Note: N = 197. Indirect effects were computed for each of 10,000 bootstrapped samples. Significance was tested based on the 95% confidence interval. T–S relationship = teacher–student relationship.
* p < .05, † p < .10.
DISCUSSION
In the present study, we first sought to determine L2 learner profiles in relation to buoyancy and the key factors that underpin these profiles. We subsequently tested the relationship between identified predictor variables and outcome measures using SEM.
Using cluster analysis, we identified five prominent profiles of buoyancy in our sample of L2 learners distributed across the spectrum of buoyancy outcomes, from a highly buoyant thriver profile to disengaged learners, who exhibited the lowest levels of buoyancy. Separating learners into empirically and conceptually meaningful groups in this way appears to provide evidence for the domain-specific validity of the construct under study. Our results therefore corroborate prior research showing that more buoyant learners are more successful under various high-pressure conditions (Malmberg et al., Reference Malmberg, Hall and Martin2013; Martin & Marsh, Reference Martin and Marsh2008a, Reference Martin and Marsh2009), and extend it to the L2 learning domain in which sustained motivation and engagement are crucial to long-term development.
An encouraging finding was that the thriver and engaged profiles comprised approximately 50% of our sample. Our results indicate that these are learners with a strong self-confidence in their capabilities as L2 learners; they can purposefully regulate their learning behavior in ways needed for successful achievement; they possess a desired future image of themselves as competent L2 users; they enjoy positive and productive classroom relationships with their L2 teachers; and they associate little anxiety with language learning. These characteristics suggest that this unique confluence provides buoyant learners with the capacity to deal with ongoing challenges and demands that present themselves during L2 learning by regulating attention, emotion, and behavior positively and adaptively (cf. Collie et al., Reference Collie, Martin, Malmberg, Hall and Ginns2015). A less positive finding was that one-fifth of students were classified as dependent or disengaged learners. Because this represents a substantial proportion of learners, it highlights the need for focused interventions that target these high-need groups (cf. Martin, Reference Martin2013, Reference Martin2014).
With regard to our SEM results, three variables turned out to be significant predictors of buoyancy: self-efficacy, strategic self-regulation, and the ideal L2 self. This suggests, first, that learners’ beliefs in their capacity for successful performance in a given L2 learning situation must remain resistant to setbacks and challenges if these are to sustain learning behavior through the highs and lows of one’s learning experiences (cf. Martin et al., Reference Martin, Colmar, Davey and Marsh2010). As we expected, our results also indicated that self-regulatory strategies have a positive impact on individuals’ capacity for buoyancy, and this may be because this strategic effort allows buoyant learners to plan and monitor their performance; adjust their appraisals of learning tasks and their expectancy for success; and adapt their behavior through the ups and downs of L2 learning (Martin & Marsh, Reference Martin and Marsh2008a, Reference Martin and Marsh2009). Learners with relatively lower effective control of their L2 learning processes and strategies are less likely to develop the buoyancy crucial in positively overcoming a variety of difficult learning situations to sustain their motivation and successfully accomplish their L2 learning goals.
It may at first seem parsimonious to simply consider buoyancy as an additional condition to the list of conditions proposed by Dörnyei (Reference Dörnyei, Dörnyei and Ushioda2009) for the effectiveness of the ideal L2 self, but this view was not supported by our data. In the competing models that we tested, the model with buoyancy as the mediator showed better fit than those with other mediators: Not only does buoyancy significantly predict both L2 achievement and general learning achievement (GPA), it also fully mediates the impact of other motivational variables on L2 achievement. This signals, for instance, that positive mental imagery representing what L2 learners would ideally like to become may have little motivational consequence if learners do not also develop the buoyancy with which to overcome the pressures, disappointments, or failures that may be the reality of their language learning experiences as they work to approach that ideal (cf. Martin et al., Reference Martin, Yu, Ginns and Papworth2017). Without the additional layer of buoyancy to sustain motivation, one’s initial drive is insufficient to explain successful learning behavior and academic performance. This provides empirical evidence with which to frame the temporal dimension of forces that sustain motivation and establish a connection to positive L2 learning outcomes. Given the increased focus on identifying what works in L2 educational settings worldwide, we would suggest that further work on this important question is warranted, and that examining the other predictive dimensions of buoyancy we highlighted previously is likely to clarify directions and provide potential structure for building and reinforcing buoyancy in response to pressures, setbacks, and challenges (Martin & Marsh, Reference Martin and Marsh2006, Reference Martin and Marsh2009)—a task we turn to here.
While not explicitly aligned with research on buoyancy, Bandura’s (Reference Bandura1997) work is in fact explicit that people are proactive, aspiring organisms and “their capacity to exercise forethought enables them to wield adaptive control anticipatorily rather than being simply reactive to the effect of their efforts” (p. 131). Existing scholarship points to several main sources of information that directly foster learners’ self-efficacy beliefs, and there is ample evidence of the value of doing so in experimental settings (Bandura, Reference Bandura1997). Our results suggest that one way that self-efficacy beliefs translate into successful achievement is through the facilitation of buoyancy (cf. Martin et al., Reference Martin, Ginns, Brackett, Malmberg and Hall2013). At the same time, stressful learning situations and experiences of failure can act as stimuli that loop back into frequent revisions of these expectancies. Creating and maintaining a strong sense of efficacy can be accomplished by explicitly addressing and enhancing students’ beliefs about themselves and their learning capacities; deliberately restructuring learning to maximize opportunities to experience regular success; and visualizing the success of similar individuals that enables learners to, in turn, establish effective comparable goals (Mills, Reference Mills, Mercer and Williams2014).
As for anxiety, contrary to both our expectations and previous research indicating its importance (Martin & Marsh, Reference Martin and Marsh2008a; Martin et al., Reference Martin, Colmar, Davey and Marsh2010), it did not function as a significant negative predictor of buoyancy. Although anxiety is experienced under conditions of performance and evaluative threat that evoke fear of failure, in the context of L2 learning anxiety is not unambiguously maladaptive (Gkonou, Daubney, & Dewaele, Reference Gkonou, Daubney and Dewaele2017) and may trigger a fight rather than flight response to academic setback and challenge, particularly when other more positive factors supervene in this psychological dimension (Oxford, Reference Oxford, MacIntyre, Gregersen and Mercer2016). We are cautious, here, not to make claims for which we have little support regarding the notion of L2 anxiety being debilitative for some individuals at certain levels and facilitative for others at other levels. Indeed, very recent work in L2 anxiety (e.g., contributions in Gkonou et al., Reference Gkonou, Daubney and Dewaele2017) has highlighted how this argument is a misapplication of Alpert and Haber’s (Reference Alpert and Haber1960) original position—which sees the two as separate and unrelated dimensions—and that L2 anxiety cannot have positive valence as other emotions inhabit the positive end of the spectrum (e.g., enjoyment) and are also implicated in classroom language learning (MacIntyre et al., Reference MacIntyre, Gregersen and Mercer2016).
Anxiety may be less salient here than the three factors (self-efficacy, self-regulation, and the ideal L2 self) that contribute a more positive valence for the learner. Our findings indicate that L2 learners with a sufficiently robust measure of these constructs can develop buoyancy despite a certain degree of anxiety. Successful learners “utilize their specific strengths and compensate for their possible weaknesses in adjustment to the particular learning environment” (Dörnyei & Ryan, Reference Dörnyei and Ryan2015, p. 28). Hence, we would suggest that instead of focusing on avoiding or reducing the negative dimensions such as tension, apprehension, and nervousness that accompany L2 learning, strengthening positive indicators in the face of external threat may more successfully reinforce learners’ buoyancy in the L2 learning process, helping them develop the ability to deal with and overcome day-to-day stresses and setbacks (Oxford, Reference Oxford, MacIntyre, Gregersen and Mercer2016). This may also make buoyancy directly amenable to intervention through its focus on positive and adaptive coping with hassles.
Our findings clearly indicate that buoyancy has the potential to exert a prominent influence on key outcomes for instructed L2 learners. Work on identifying pathways to promote buoyancy has so far emphasized the importance of teaching students how to adjust cognition, behavior, and emotion when circumstances or situations change (Martin & Marsh, Reference Martin and Marsh2006; Martin et al., Reference Martin, Colmar, Davey and Marsh2010; Martin et al., Reference Martin, Yu, Ginns and Papworth2017). For instance, during times of transition, students can be helped to adjust their thinking, expectations, or assumptions about a new or changing situation. They can also be assisted with seeking out further information or resources and adopting a new course of action when necessary, or they can be shown how to minimize negative emotion and look for enjoyment in new and unfamiliar tasks (Hattie & Yates, Reference Hattie and Yates2014).
Strategic self-regulatory efforts to manage one’s own learning are crucial to success, and interventions with high utility are those that equip students with the independent control and strategic functioning in relation to typical settings and tasks learners will encounter (Schunk & Zimmerman, Reference Schunk and Zimmerman2012). For example, students can be prepared for high-pressure situations associated with instructed L2 learning, such as compulsory assessments, enabling them to plan appropriately and deal with challenges in learning; make effort and sustain focus in reaching goals; and approach increasingly complex tasks with a productive mind-set. Exciting new work related to self-regulated language learning strategies suggests that the benefits that derive from this extend to increased agency, enhanced engagement, and indeed greater success in learning (Oxford, Reference Oxford2017).
Finally, incorporating challenging experiences into learners’ repertoire of response options helps to show that mistakes and failures do not reflect on students’ worth as learners but can be a springboard for approaching an ideal L2 self and ultimately success in learning. Repositioning success in this way will be most productive if it is seen more in terms of improvement and progress toward goals and desired images of self rather than competitively outperforming others (Cross & Markus, Reference Cross and Markus1994; Higgins, Reference Higgins1996; Oyserman, Bybee, & Terry, Reference Oyserman, Bybee and Terry2004).
LIMITATIONS AND CONCLUSION
In contrast to previous findings, our results showed that persistence did not exhibit discriminant validity in the presence of buoyancy, and therefore we had to exclude it. While this finding is inconsistent with evidence from previous buoyancy research (e.g., Collie et al., Reference Collie, Martin, Bottrell, Armstrong, Ungar and Liebenberg2017; Martin et al., Reference Martin, Colmar, Davey and Marsh2010), it might be explained by the fact that there is a conceptual overlap between persistence and buoyancy. Educational attainment level might also explain this partly, as our sample was composed of college-level L2 learners who have already exhibited a great deal of persistence in their academic endeavors. Furthermore, our sample is composed entirely of L2 learners from Korea, a culture that is typically characterized as valuing conscientiousness and strong effort attributions (Hsieh & Kang, Reference Hsieh and Kang2010). Future psychometric research should therefore investigate whether—in the context of L2 learning—buoyancy and persistence are indeed two separate constructs or simply two sides of the same coin. Regardless of which position future research will support, neither construct has received systematic attention in the language motivation research, and so we hope that this study will reinvigorate interest in this area.
In a similar fashion, although the fit of the model with buoyancy as the mediator was better than that with self-efficacy as the mediator, the difference was not particularly large. Future research should investigate the extent to which this fit superiority replicates. Our feeling is that, even if future research shows that it is self-efficacy that can better mediate the effect of buoyancy, it is still quite an achievement for a newcomer like buoyancy to demonstrate potential close to that of self-efficacy, a flagship construct in psychological research for decades.
Two additional variables dropped to nonsignificance after introducing prior achievement to the model: teacher–student relationship and anxiety. This finding highlights the importance of controlling for prior achievement to avoid confounding results (e.g., Joe et al., Reference Joe, Hiver and Al-Hoorie2017). Unfortunately, controlling for baseline level of proficiency is not standard in our field, and this in turn may threaten the validity of some available results. However, because it is practically a truism that the best predictor of future proficiency is past proficiency, interrogating the drivers of past proficiency is an important undertaking. It will be necessary in future studies to explore ways to control for prior levels of proficiency without also extracting variance related to the psycho-social factors that contributed to those past proficiency scores. Returning to our results, teacher–student relationship did not predict buoyancy, and this might be because of the relatively short duration learners spend with teachers at the university level (e.g., one semester). This short duration may not be enough for teachers to cultivate buoyancy in learners, suggesting that—at least for university students—institution-wide initiatives are needed to help learners cope with the various stressors and setbacks. Another potential limitation is the smaller sample size we used in the model controlling for prior achievement. Just less than 200 participants reported the results of their standardized language exam from the previous year. Although 200 is not particularly small, future research should attempt to replicate our results with larger and more varied samples that include L2 learners from various geographical and language learning contexts.
Despite these limitations, our results offer support to the role of academic buoyancy in sustaining motivation for language learning. Our cluster model results illustrate that a continuum of five buoyancy profiles exist in our sample of language learners to which we have given descriptive names indicative of their levels of this criterion outcome: the thriver, the engaged learner, the striver, the dependent learner, and the disengaged learner. Consistent with prior evidence and our hypotheses, our subsequent analyses showed that the more buoyant L2 learners are, the better their L2 achievement. This was the case both prior to and when controlling for prior levels of L2 achievement. We discussed the implications of these findings, highlighting the contribution this empirical evidence makes to missing conceptual links in existing L2 motivation scholarship and to motivational practice. All in all, our results suggest that academic buoyancy represents an essential yet underexplored capacity that enables L2 learners to remain motivated despite setbacks and experiences of difficulty and to translate that drive into concrete learning outcomes in instructed L2 settings. Positive affective outcomes, persistence, and engagement—the kind associated with buoyancy—are legitimate and desirable outcomes in themselves. Furthermore, investigating ways in which these motivational aspects interact and complement each other to influence L2 learning outcomes might be central to understanding learners’ levels of L2 achievement in compulsory educational contexts worldwide. Thus, incorporating these insights into the field’s working knowledge has the potential to shed light on greater complexity in L2 motivational processes through multiple levels of influence, and in turn move our field toward a more sophisticated application of L2 motivation theory and research in response to practical issues and problems. The study of academic buoyancy is aimed at explaining the capacity of learners to remain positively motivated, continue to be resistant to setbacks and challenges, and overcome the pressures that are part of the ordinary course of instructed L2 learning—our findings suggest that this proposition has real substance.
SUPPLEMENTARY MATERIAL
To view supplementary material for this article, please visit https://doi.org/10.1017/S0272263118000037
APPENDIX A
THE FULL SEM MODELS
The full model before controlling for Prior L2 Achievement.
Note: † p < .10, *** p < .001.

The full model after controlling for Prior L2 Achievement.
Note: * p < .05, ** p < .01, *** p < .001.

APPENDIX B
TABLES
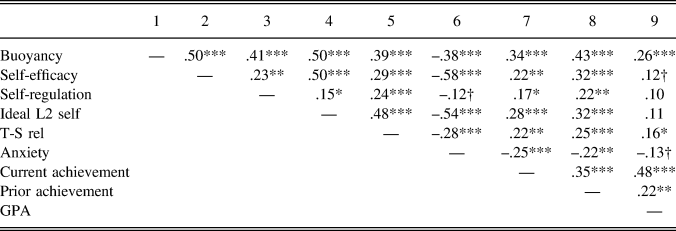
Correlations among the variables of the final model

Composition of clusters for the final five-cluster solution