In June 2008, Iowa was hit by a sequence of storms that resulted in more than 10 inches of rainfall in 1 week.1 Rivers and streams throughout Iowa exceeded flood levels that would be expected only once every 500 years, and water inundated areas previously considered to be safe from flooding. The flooding resulted in the damage or destruction of more than 25 000 homes in both rural and urban areas of eastern Iowa.2
Widespread devastation, environmental degradation, and breakdowns in communication and infrastructure may render a disaster-affected population more vulnerable to adverse health effects. Effectively communicating risk and health information following a disaster is an important component of disaster response and protection of public health.3 Evaluation of current health communication strategies may also help future preparedness, foster development of health messages, and encourage future utilization of the most effective communication channels. However, only a handful of studies have evaluated post-disaster health communication and identified effective information sources. A study in Australia found that radio was the most effective communication tool for general information in areas without power due to heavy storms.Reference Cretikos, Eastwood and Dalton4 A study looking at focus group responses following a hypothetical terrorist attack reported radio and television as the preferred communication methods of people wishing to receive information.Reference Henderson, Henderson and Raskob5
During and immediately after the 2008 flooding, the Iowa Department of Public Health (IDPH) prioritized health information informing communities about health risks associated with carbon monoxide, mold, respiratory mask use, injury, mosquitoes, well water contamination, and stress, and clarifying the use of vaccinations. These health issues were communicated primarily through television, newspapers, radio, the Internet, and community outreach. Although variations exist, the health messages were each communicated to flood victims through similar information sources. The IDPH launched a study to determine which public health messages were received by the public, which information sources were most effective in communicating health messages, and which information sources could be used in the future to better target specific population subgroups following disaster events.
METHODS
Sampling
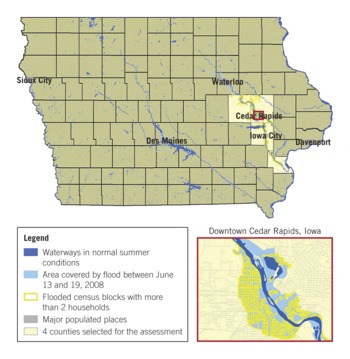
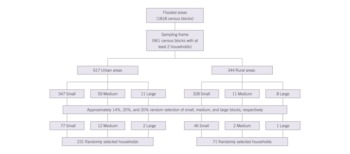
A 2-stage probability sampling design was used to select households in the study. A sampling frame of flood-affected census blocks with at least 2 households (961 blocks) in 4 severely affected counties (Benton, Johnson, Linn, and Louisa) in Iowa was prepared on the basis of a flood map provided by the IDPH. The map used satellite imagery captured on June 13, 2008, from the US Geological Survey (Figure 1). Households were stratified by urban and rural status (Figure 2). Approximately 14% of the small blocks in the study area (2-50 households), 20% of the medium blocks (51-150 households), and 20% of the large blocks (>150 households) were sampled (140 blocks) randomly from each stratum (ie, urban and rural).
Map of Iowa flooding in study areas of Benton, Johnson, Linn, and Louisa counties.

Study sampling design.

The survey sampled at least 1 household from each small block, at least 5 households from each medium block, and at least 14 households from each large block. Field research personnel randomly sampled households from selected blocks upon arrival. If the selected household was inaccessible, refused participation, or there was no response, then the field research team selected the next household in the block until the required number of households for that specific block was met. In the event of inability to recruit from a block chosen for sampling, a field research team recruited households from one of the adjacent blocks, following the same selection process.
Data Collection
Data were collected from July 4 to July 8, 2008, via a 48-item questionnaire on demographics, housing, health information sources, and participant knowledge about 8 specific health risks (carbon monoxide poisoning, mold, use of respirators, injuries, vaccinations, well water use, mosquito control, and stress). The questionnaire was face and content validated, and it was piloted in the flood-affected community before implementation. The questionnaire was completed by 1 adult member (≥18 years of age) in each household with sufficient knowledge of the English language. The first adult to volunteer for participation was interviewed directly through using the questionnaire. Verbal consent was obtained from all of the participants before administration of the survey. No personal identifier information (eg, name, address) was collected.
This study was conducted by the IDPH in collaboration with the Centers for Disease Control and Prevention (CDC). The study was not considered to be human subject research because it was a public health emergency response and therefore not subject to review by CDC or IDPH institutional review boards.
Statistical Analysis
Frequencies and proportions were reported for all sociodemographic and flood-related characteristics. Missing values were not reported in this analysis. Multivariate association between receipt of information on specific health issues and other characteristics was determined by using logistic regression analysis. All analysis was conducted through using of SPSS (version 15.0, Copyright © SPSS, Inc, 1989-2006, Chicago, IL) and SAS (version 9.1, SAS Institute, Inc, Cary, NC) software.
RESULTS
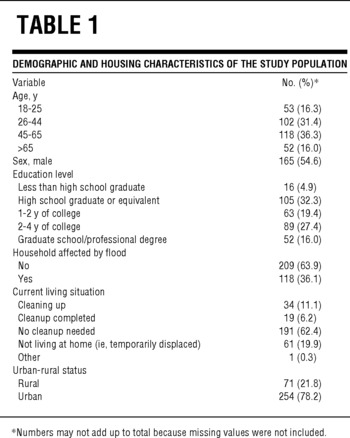
A total of 846 households were approached for inclusion in the study. Fifty-eight (6.9%) households were vacant, with no signs of people living in them; no one was home at 41.4% (n = 350) of households, but it was ascertained that somebody was living in each; in another 2.1% (n = 18) no one was at home, and it was uncertain whether someone was living there at the time of the study; 7.2% (n = 61) refused participation; and 3.8% (n = 32) were inaccessible due to flood water or other types of hazards. The final analysis included 327 households. This number exceeded the targeted 302 households. These additional households resulted in oversampling of small blocks in both urban and rural areas. However, the overall urban and rural distribution followed that of all flood-affected areas. Approximately 78.2% and 21.8% households were urban or rural (Table 1), respectively, in the study sample, as compared with 77.1% and 22.9% in all of the flooded areas.
Demographic and Housing Characteristics of the Study Population

More than one third of the participants (36.1%) were between 45 and 65 years of age, and almost one third (31.2%) were between 26 and 44 years of age (Table 1). Men were slightly over-represented in the sample (54.6%). The majority (62.4%) of the participants had at least some college education or held degrees, and only 4.9% were not high school graduates. More than one third (36.1%) of the participating households were affected by the flood, and 17.3% of all respondents reported that they had either completed the clean-up or were still in the process of cleaning. Although they lived near flooded areas, many households (63.9%) were not directly affected by the flooding and reported that no clean-up was necessary after the flood. Twenty percent of respondents were not living in their primary residence at the time of the study.
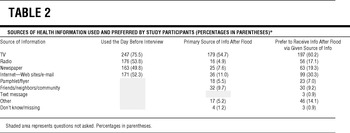
When asked about the use of communication media, the majority of respondents reported watching television, listening to the radio, and using the Internet the previous day (Table 2). Television was the primary source of health information for 54.7% of the respondents after the flood. Internet Web sites and e-mail were the second-most reported source (11.0%), and information from friends/neighbors/community was third (9.7%). When asked about their preferred method of receiving health information, respondents reported that television was the preferred source (60.2%), followed by the Internet (30.3%), newspapers (19.3%), and radio (17.1%). There was no statistical difference in the type of sources (television, radio, newspaper, Internet) used or preferred between urban and rural areas (data not shown).
Sources of Health Information Used and Preferred by Study Participants (Percentages in Parentheses)*

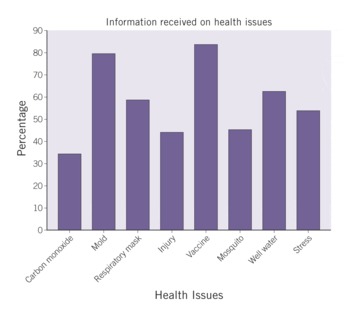
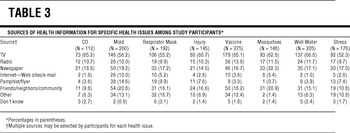
Almost all of the participants (99%) received information on at least 1 of the health topics discussed in the survey. Sixty-six percent of the participants reported receiving information about more than 4 of the 8 health issues. Most of the participants reported receiving some information regarding vaccination (84.1%), mold (79.5%), and use of well water (62.7%) (Figure 3). More than half received information about respirator use (58.7%) or mental stress (53.8%), whereas fewer than half received information about mosquito control (45.3%), injury (44.3%), and carbon monoxide poisoning (34.3%). TV was the major source for the information that participants reporting receiving on health issues (Table 3). Newspapers were the second major source of this information, and friends/neighbors/community and radio were significant sources for most of these health issues as well. Approximately 10.0% participants received information on mold via the Internet and 14.6% through pamphlets or flyers posted in the community.
Percentage of study participants who received messages about select health issues.

Sources of Health Information for Specific Health Issues Among Study Participants*

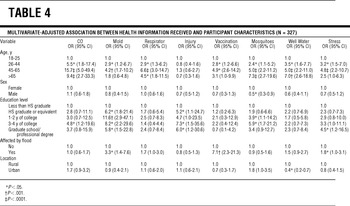
The results of the multivariate associations between information received on specific health issues, sociodemographic characteristics, and flood-affected status are presented in Table 4. Except in the case of injury, older people were the most likely to receive health information for most of the health issues than were 18- to 25-year olds. Participants >65 years were most likely participants to receive information on mosquito control and well water use, and participants aged 45 to 65 years had the highest odds of receiving information on carbon monoxide poisoning, mold, respirator use, vaccination, and stress. Men were less likely than women to receive information on mosquito control. Compared to participants with less than a high school degree education, participants with high school degrees or more education were more likely to receive health information on most of the health issues; however, these associations were not statistically significant for respirator use, vaccination, or well water health issues.
Multivariate-Adjusted Association Between Health Information Received and Participant Characteristics (N = 327)

Participants from flood-affected households were greater than three times more likely than those who were not flood-affected to receive information on mold; they were greater than seven times more likely to receive information on vaccination and almost twice as likely to receive information on stress. They were almost twice as likely to receive information on respirator use; however, this association was marginally below statistical significance (P = .06). Except for injury, participants from flood-affected households were more likely than households not affected by flooding to receive information on the other health issues, although this association was not statistically significant. Participants in the rural areas were approximately 3 times more likely to receive information on well water use than those in urban areas.
DISCUSSON
This study provided insight into communication approaches that were most effective following the 2008 Iowa floods. Television was the most important and preferred source of health information that participants reported receiving. Television, the Internet, and newspapers were more frequently reported sources of information than radio. This outcome differs from the results of a previous study conducted in Australia by Cretikos et al regarding an area in which heavy storms constituted a more short-term emergency featuring a widespread loss of power and the communication of most health information by radio.Reference Cretikos, Eastwood and Dalton4 The situation in Iowa may be different from some disaster situations; in Iowa, much of the displaced population moved in with family and friends within the community so they were able to maintain access to television and the Internet. Furthermore, the Internet and e-mail emerged as 2 of the potential health information sources that could have been used more during the Iowa flooding; the use of the Internet and its messaging capabilities was reported equally in the urban and rural areas. Given the widespread availability of the Internet and the accessibility of cellular telephone connections, public health officials should explore the possibility of the Internet and e-mail updates as a channel for communicating health information. Other significant sources of health information reported by households surveyed in the Iowa flooding were friends, neighbors, and community meetings.
The study sample was sampled to be representative of the overall areas affected by the flood. It is interesting to note that rural and urban areas received health messages through the same type of sources. Thus, public health information could be distributed to these 2 groups equally effectively by using the same information sources.
The fact that vaccination information was widely received by the Iowa households could be due to the emphasis placed on vaccination by local county health departments and the fact that television was widely used by the IDPH to disseminate health information. Information on mold, respirator use, and well water use were also well communicated. Fewer survey participants reported receiving health communication messages concerning carbon monoxide poisoning. This lapse in communication is significant, considering that carbon monoxide exposures from generator use have been responsible for illnesses and deaths following such natural disasters as hurricanes Katrina and Rita and more recently Hurricane Ike.6Reference Cukor and Restuccia7 A need for postdisaster health messages to include information about proper placement of equipment such as generators and use of battery-powered carbon monoxide detectors was also identified in Texas after Hurricane Ike.8
Although health messages were widely received by the overall population, whether the right messages reached specific subgroups that were more vulnerable to certain health issues was a major concern of the study. For example, procedures for cleaning up mold and the lack or use of respirators during cleaning, along with debris removal, can pose potential health risks for individuals in flood-affected households. The researchers found that flood-affected participants were more likely to receive information on mold, vaccination, and stress than those whose houses were not affected by the flooding. This finding could be due to the fact that participants who were affected by the flood more actively sought out health information or were more likely to remember the messages. In addition, contamination of well water in the rural areas was a health concern. The study found that participants in the rural areas were approximately 3 times more likely to receive health information on well water use than those in urban areas. Overall, the researchers found that health messages were communicated to a large segment of the affected population and that these messages reached targeted subgroups.
A greater proportion of participants 26 years of age and older reported receiving information on most of the health issues than did participants younger than 26. The study results suggest the exploration of novel approaches such as text messaging, the Internet, or e-mail to communicate health messages to younger individuals, because use of the Internet was significantly higher in populations 18 to 25 years of age. The effectiveness of social networking tools in disseminating postdisaster health information would also be of interest. The study findings also suggest that increased education levels, in most cases, were a factor in the success of messages about health information; health consciousness and accessibility to health information may have also played roles.
A major limitation of the study was that a majority of the participants were not affected by flooding; however, participants living near flood-affected areas may still be exposed to many of the same health risks and receive health information similar to that received by flood-affected participants. This could lead to an underestimation of the overall information received, because it is likely that people who are affected directly and more severely would more actively seek out information than those who were not affected. In our study, we could not separate those who passively received health information through a particular health communication channel from those who actively sought out information. Another limitation is that there was a substantial amount of non-response in the recruitment of participants, and some households were not accessible. It is uncertain how these factors would affect the study estimates. A third study limitation is that 2000 US Census housing estimates were used for sampling of households in the absence of more recent data. The study sample may therefore lack an accurate representation of the overall flooded areas.
In this postdisaster population, television and the Internet were the most widely used and preferred sources of health communication, followed by newspapers and radio. Along with using more traditional health communication channels such as television, radio, or newspapers, health officials who wish to communicate to similar postdisaster populations usefully and effectively may need to place continued emphasis on the development of health information Web sites and other technological alternatives, such as e-mail. Our study suggests that public health messages were communicated effectively to the post-flood population to a large extent in Iowa. In addition, these messages were widely received by a variety of demographic groups.
Authors' Disclosures: The author reports no conflicts of interest.
Funding source: None.
Acknowledgements
The authors are grateful to the project contributors from the CDC and Prevention who committed substantial time and effort to ensure the completion of this project: John Halpin, epidemic intelligence service officer with the Motor Vehicle Injury Prevention Team; Mef Galle, Epidemic Intelligence Service officer with NCIPC—Division of Injury Response; Cory Moore, Coordinating Center for Environmental Health and Injury Prevention; Colleen Martin, Health Studies Branch; Cathy Pepper, Public Health Informatics Fellow; Jessica Daniel, Collegiate Leaders in Environmental Health (CLEH); Tasha LoPorta, CLEH; Antonio Tito, CLEH; Amy Wolkin, Health Studies Branch; Josephine Malilay, Division of Environmental Hazards and Health Effects (EHHE), and Michael McGeehin, EHHE Division Director.
We also thank all of the students who so enthusiastically went from door to door in the flooded areas: Jennifer Hall, Raymond Scheibel, Shawn Messer, Ni Zhang, Soyang Kwon, Genny Maroc, Erin Moritx-Korolev, Diana Von Stein, Queen Githaiga, Vijaya Kancherla, Kerry Krause, Alysa Meyers, Lisa Roberts, Erin Moritz, Sameet Sangha, and Maryn Torner. In addition, we would like to thank the university professors who assisted us in coordinating the student volunteers: at the University of Iowa—Mary Aquilino, MSN, PhD, FNP, Mike Pentella, PhD, D (ABMM), Jim Torner, PhD, and Gregory Gray, MD, MPH; at Des Moines University—Wendy Ringgenberg, PhD; and at the University of Northern Iowa—Catherine Zeman, PhD, RRTTC, CNS.
Finally, we thank all of the Iowans who, while dealing with the aftermath of flooding, graciously took the time to answer our questions.