Of all the remarkable features of China's growth performance, one of the most remarkable and significant and, at the same time, most puzzling, has been its high rates of saving. According to the official national income accounts, overall saving rates reached levels virtually unheard of in peace times of 50 per cent from 2007 to 2009. In the mid-1990s, it was often around 40 per cent, and before that, often between 35 and 40 per cent.
These saving rates have naturally attracted a good deal of attention and have contributed to the observation that there is an excess of saving in the world, or a “glut” of savings.Footnote 1 Various explanations have been put forward to solve the puzzle, ranging from Asian cultural thriftiness to increasing income inequality, and there have been careful reviews of Chinese savings data, identifying components and their changes.Footnote 2 Yet, some mystery remains as to just why the saving rates are so high. This article attempts to provide an approach for the resolution of the puzzle and argues that much of the saving has been, in the Benthamite sense, “forced.”
The history of the idea of forced saving dates back to at least 1802, and to Jeremy Bentham, who provided two interpretations of the concept. The first might be called “involuntary saving.” Bentham wrote:
By raising money, as other money is raised, by taxes (the amount of which is taken by individuals out of their expenditure on the score of maintenance), government has it in its power to accelerate, to an unexampled degree, the augmentation of the mass of real wealth.Footnote 3
Or, in more contemporary usage, one would say that taxes can be used to finance real investment, which implies corresponding saving, and which would lead to economic growth.
The second of Bentham's interpretations of forced saving is quite different and can be described as “conduced saving:”
The effect of forced frugality is also produced by the creating of paper money by government, or the suffering of the creation of paper money by individuals. In this case, the effect is produced by a species of indirect taxation, which has hitherto passed almost unnoticed.Footnote 4
The concept of forced saving has gone through many attempted clarifications, extensions and elaborations, and even a burial and exhumation.Footnote 5 The term came to be used and applied, in ways not originally intended, by a succession of economists, among whom perhaps Schumpeter gave it most weight.Footnote 6 But Keynes, with apparent success, more or less abandoned it in The General Theory of Employment, Interest and Money, after having entertained it in A Treatise on Money.Footnote 7
According to Keynes, “Saving and Investment are the determinates of the system, not the determinants.”Footnote 8 Yet the view, which is implicit, if not explicit, in much of economic growth theory and, in particular, the explanations of investment and growth in China and other developing countries, and which this author has endorsed in the past, is that it is savings that have determined investment levels.Footnote 9
Involuntary saving, the first of Bentham's meanings, is significant in China as well as in many other countries, in the form of general taxes, and as government investment programmes have become increasingly important.Footnote 10 However, this article argues that there is also forced saving in China in Bentham's second sense, with its source in the funds made available by loans from the banking system, which are used not for consumption but for investment, and which, therefore, become saving. The adjustments which make this happen are the changes in income and the behaviours of households and firms in reacting to the changes. The investigations of household savings patterns of household life cycles and precautionary savings' motives provide detailed descriptions of just how the income adjustments take place.
Savings Data for ChinaFootnote 11
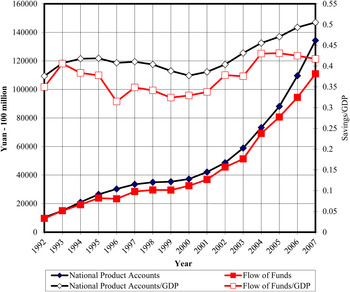
A difficulty in assessing saving in China is that there are two estimates of domestic savings which are somewhat inconsistent. The alternatives are shown in Figure 1. The national product accounts provide a long series for gross capital formation and net exports, which, of course, must be equal to savings. The flow of funds tables for China also provide savings data from household, business and government accounts which, however, are not fully consistent with the estimates from the national product accounts. The two series generate differences in savings ratios which often vary by 5 per cent or more.
Two Estimates of Savings

The national product accounts and the flow of funds data have clear pedigrees and the latter have been relied upon in one of the most careful analyses of savings in China, which drew attention to its separate sources.Footnote 12 The national product accounts will be used in regressions to be presented below. The flow of funds data provide the most detail, but are available only for a short period.
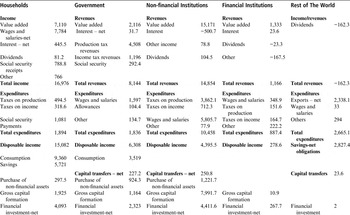
Table 1 shows the distribution of savings among institutions in China for 2007, as presented in the flow of funds table for 2007 from the China Statistical Yearbook.Footnote 13 The savings of each type of institution is the difference between income, or revenues, and expenditures. The Table also shows the uses of the savings. For example, households are producers as well as consumers and, according to the flow of funds table, carried out 1,925 billion yuan of gross capital formation on their own account. They had enough left over from their own saving plus disposal of non-financial assets to make 4,093 billion yuan of financial investments, which were overwhelmingly bank deposits.Footnote 14 These were, by far, the largest single source of such financial investments.
Flow of Funds, 2007 (billion yuan)

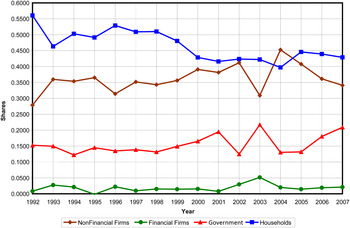
Figure 2 presents multi-year data for the shares of total savings originating in each of the sources of savings data from the flow of funds accounts. The household shares dropped in the last years of the previous century and then remained relatively unchanged in the first years of the new century. By comparison, the shares of total saving of non-financial firms and government increased, somewhat unevenly until shortly after the turn of the century. Then the savings share of the non-financial firms fell, again somewhat unevenly, while the government share remained relatively unchanged.
Shares in Domestic Saving

Involuntary Saving
The most obvious example of involuntary saving is that noted above, the saving required and enforced by government. Although there is no one-to-one correspondence between individual social security assessments of individuals and their subsequent withdrawals, the programme as a whole is a savings programme if there is an accumulation of funds. Government health insurance programmes may also be, to some extent, savings programmes; however, they may alternatively be established to cover current costs with current assessments. More generally, if government exactions reduce private consumption below levels that would otherwise be obtained from their incomes and these are then used for investment, it can be said that is involuntary saving by households. The ability of government and businesses to “force” involuntary saving depends, of course, on the ability of the economy to generate income.
It is more debatable as to whether undistributed corporate profits, which in the non-financial institution column of China's flow of funds accounts are labelled as “Disposable Income,” should be considered to be involuntary saving. It might be argued that stockholders, when purchasing their stocks, knowingly cede profit distribution decisions to the corporation and, thus, the decision to save out of corporate profits. Yet, the profit distribution decisions by corporations are remote from household decisions. Unless the stockholder pays close attention to corporate affairs, which would be unusual, she/he may be unaware of corporate profit payout decisions. The actual distributed profits in China make up only 11.3 per cent of total profits, as shown in Table 1. Also according to Table 1, undistributed corporate profits are directed fully into gross capital formation.Even so, that gross capital formation at 7,991. 7 billion yuan is 75 per cent greater than the undistributed corporate profits, indicating investment finance from other sources as well.
According to the flow of funds data, government saving and non-financial institution saving have accounted for just slightly more than half of total saving in recent years. So, this involuntary saving has been quite important.
The accounting for financial institutions is simpler. There were 278.6 billion yuan of savings or profits, of which 10.9 billion were used in capital formation by the institutions, leaving 267.7 billion for financial investment by the institutions' own funds. By far the largest financial institutions in China are the four government banks, so their savings are, in principle, available to government; however, they can be left to be used by the banks. In either case, it is plausible to consider their undistributed profits as involuntary savings as well.
The “rest of the world” used 2,851 billion yuan of finance and contributed no net savings, which requires a little explanation. There is little doubt that there are very substantial amounts of foreign investment in China, and that China is acquiring large amounts of foreign exchange assets through its export surpluses. This is primarily the result of China's balance of payments surplus, and the foreign assets, mainly US bonds, are held mainly by the central bank, the People's Bank of China.
Forced Saving in Bentham's Second Sense
Bentham's logic cannot be denied. If investment takes place, financed either with printed money or bank loans, there must be corresponding saving. Keynes denied that saving is forced unless it is above the normal amounts expected at a particular income level. In the usage here, it is “forced” if its impetus is an exogenous increase in investment based on bank loans or government deficits. As shown in Table 1, non-financial institutions had 4,551.2 billion yuan available from net earnings, and 250.8 billion yuan from the sale of financial assets, making a total of 4,802 billion yuan. Their bank loans were 55.2 per cent of their gross capital formation. In Bentham's second sense, this generated forced saving.Footnote 15
According to Keynes, whose view has now become conventional, the saving and investment equalizing mechanism works through adjustments in income. If there is any doubt that bank loans used to finance investment will work through income adjustments and result in saving, the words of Keynes may help to resolve that doubt:
The public will exercise a “free choice” as to the proportion in which they divide their increase in income between saving and spending; and it is impossible that the intention of the entrepreneur who has borrowed in order to increase investment can become effective (except in substitution for investment by other entrepreneurs which would have occurred otherwise) at a faster rate than the public decide to increase their savings. Yet employment, incomes and prices cannot help moving in such a way that in the new situation someone does choose to hold the additional money.Footnote 16
The savings of households, government and corporations all contribute to the savings that correspond to the investments.Footnote 17 Since this is the case, in what sense can some savings be said to be “forced?” The answer is that the motivating influences are not household decisions but rather the investments by firms and local governments, which are financed by bank loans. Contributing to the rationale for calling this saving “forced” is the fact that, in China in particular, bank lending for investment can be a government instrument used to stimulate growth.Footnote 18
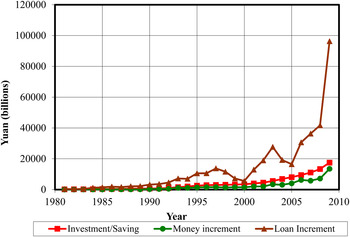
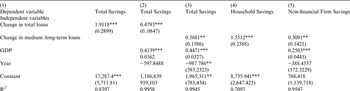
Figure 3 shows the evolution of saving and the annual increments both in the supply of money plus quasi-money and in bank loans from 1981 to 2009. It is suggestive of a relation between bank loans and saving, but is certainly not conclusive. The relation is tested by regressions, but this is a case in which, although negative relations might be ruled out, it is necessary to be particularly cautious remembering that causative relations are not ruled in by a regression. Table 2 presents the results of regressions against different components of savings using bank loan data. While single stage regressions will be presented, the results are not different from the two and three stage regressions which were also estimated, but will not be presented. The inclusion of bank loan data in savings functions is, at the least, unusual as the more common savings relationships are based on a measure of aggregate income, perhaps lagged, and in some instances, interest rates. If it is household savings that are being tested, the usual relation is between household disposable income with adjustments for family composition and family ages. The estimates presented here are not intended to rule out these relations, which indicate the factors influencing the adjustments of households, but only to test whether savings can be associated with bank lending behaviour.
Investment, Change in Money, Change in Loans

Results of Regressions against Saving

Column 2 of Table 2 shows the coefficients estimated when total savings are simply regressed against the annual increments in total bank loans. The estimated coefficient is highly significant and the R2 is relatively high. The estimated regression coefficients in column 3 are the result of adding GDP, the latter standing in for other income variables which appear in more sophisticated savings functions. A trend variable is also added. Except for the estimated coefficient on the trend variable, the other estimated coefficients are significant and the R2 is again high.
Column 3 of Table 2 shows the estimated coefficients on the annual increments in medium and long-term loans from a regression on total savings, GDP and a trend variable. Medium and long-term loans better represent bank lending for investment purposes, as short-term bank financing is not included. That variable is used in the regression results shown in column 4 of Table 2. The coefficients on all the independent variables are again significant and all are larger than the coefficient estimates for the previous regression using total bank loans as the independent variable.
Column 4 of Table 2 presents the results of regressing just household savings on the change in medium and long-term loans, resulting in a significant coefficient greater than one, indicating important multiplier effects. Column 5 presents the estimated coefficients from a regression on the savings of non-financial corporations. The positive coefficient on medium and long-term loans indicates the effect of these loans in stimulating investment by non-financial corporations as most of their savings support their investment. The negative coefficient on household disposable income in this regression suggests a diversion of resources from households to non-financial corporations as a result of the bank lending. Overall, the regressions lend support to the argument that bank loans are an important driving force for savings.
Loose Ends
A major preoccupation in early discussions of forced saving was its effect on prices. Implicitly or explicitly many of the contributors to that debate were assuming the existence of full employment, in which case the analysis can be considered as an extension of the monetary theory of prices. Official unemployment in China has been quite low, but the supply of labour from rural areas has, at least partially, inhibited wage and price pressures.
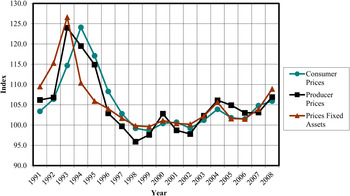
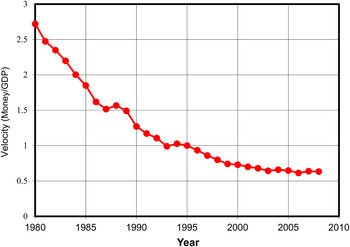
Nonetheless, it would not have been surprising if the high rates of saving/investment were accompanied by a relatively rapid increase in prices. However, with exceptions, for example in the late 1980s and mid-1990s and in recent years, price increases in China have generally been relatively modest, as shown in Figure 4. Around the turn of the century there was even some price deflation. A partial explanation is to be found in the money equation, MV = PT, with M being the quantity of money, V the velocity of money, P prices and T the volume of transactions. While the growth in M has been high, the real growth in the economy has been higher, which means that T has also grown rapidly. As a result, the velocity of money has fallen steadily, as shown in Figure 5. That leaves, as another loose end, the question of why M has not grown more rapidly. The easy answer is that the ratio of demand deposits to currency, as well as the ratio of time and savings deposits to currency plus demand deposits, have both been climbing steadily. This suggests that, since the availability of savings instruments is limited, savers have used bank deposits in their place. While there are markets for stocks and bonds, these are relatively small.
Consumer and Producer Prices

Money Velocity

This observation leads to yet another loose end. There are a number of other countries in which investment is financed mainly through bank credit rather than equity and bonds. If saving has been investment-pushed in China, at least partly on the basis of bank loans, why has it not been so in these other countries, or has it? It would take considerably more time and space than is available to provide a definitive answer to this question. However, it can be pointed out that China's central bank, the People's Bank of China, has exercised increasingly effective monetary management primarily through quantitative controls and suasion. The latter should be authoritative, since the major banks are, as noted, owned by the government and clearly are instruments of government policy.
A loose end that can be tied up is the concern expressed by Federal Reserve president, Ben Bernanke, in Reference Bernanke2005, noted above. Bernanke said that there has been a “significant increase in the global supply of saving – a global saving glut.” If my argument is correct, the savings “glut,” if the reference was to China, was the result of these investment increases with forced saving, both involuntary and conduced. At least for China, the country with the highest saving rate, the better characterization would be that it has had a very high investment rate.
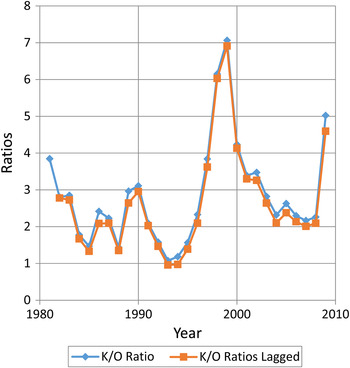
Has the high rate of investment been achieved at the cost of low returns? The available data does not permit an analysis of bank, firm and government income statements and balance sheets. So, only an indirect and, unfortunately, indecisive approach is possible to answer the question whether the “glut” of investment in China has been accompanied by correspondingly low rates of return.
Figure 6 presents data on aggregate marginal capital/output ratios, computed as the ratio of annual investment to increments in output, both for contemporaneous investment and output changes and for investment and one-year-later output changes. For most of the 1980–2009 period, the ratios were between 1 and 3, which are conventional values. From 1997 to 2002, the ratios were much higher.Only in 2003 did the ratios return to more conventional levels, and then only until 2008. There was, however, a sharp increase in 2009, with policy-dictated increases in investment.
Capital/Output

The information on the non-performing loans of the banks provides an indirect indication of the quality of the investment financed by bank loans. There is general agreement that, at the turn of the century, these non-performing loans were very large. Some estimates put them at 18 to 31 per cent of GDP in 1999,Footnote 19 and 16 per cent of GDP in 2009.Footnote 20 The IMF provides the following summary data on the percentage share of non-performing bank loans in bank loan portfolios, taken from the China Banking Regulatory Commission sources:Footnote 21

This information is actually not very enlightening. Asset management corporations have been created so that banks may move the non-performing loans off their balance sheets on a quarterly basis. Therefore, the shares of such loans left in the banks and on bank balance sheets do not indicate the overall performance of the bank loan portfolio and the investments which were financed. The numbers above for 2008 and 2009 are particularly suspicious. These were years of rapid expansion of bank lending in response to government pressures. It is claimed, officially, that banks became much more cautious in spite of the pressure to increase bank lending in 2008 and 2009. The drastic reduction in the officially reported share of non-performing loans in these years may not actually reflect an increase in the effectiveness of the bank lending. Perhaps firms took advantage of the moral hazard of the banks, as they could make loans which, if they could not be repaid, were moved off bank balance sheets. Perhaps banks took advantage of the moral hazard of the asset management corporations.
Conclusions
The evidence for forced saving in China in Bentham's first sense of involuntary saving is clear. For example, government saving and corporate saving in the form of undistributed profits accounted for roughly half of total saving in 2007.
With respect to Bentham's second meaning of forced saving, the argument here is that the large government-owned banks, with government approval and perhaps direction, have facilitated high investment rates by means of bank loans. This has been conducive to high savings rates. In turn, savings and investments have enabled high real growth rates and a high rate of employment in the face of large scale movements of workers from the countryside into urban areas. Price effects have, until recently, been modest owing to a general willingness to hold the substantial increases in the money supply.
All of this would be consistent with the argument made by Susan Shirk and othersFootnote 22 that the overriding concern of the Chinese leadership has been to ensure the maintenance of high rates of economic growth and employment to forestall “domestic instability.” According to this argument, all economic policy has been shaped to this end. It is, therefore, plausible that this has motivated the government's instructions to banks to extend loans to support investment, even if the loans would have a relatively high rate of delinquency. While the evidence for forced saving in Bentham's second sense is circumstantial, it is clear that a substantial part of investment is financed in this way, “forcing” the high rate of saving.