Implications
Non-linear models can be an option to establish the mathematical behaviour of body development throughout the life of the Segureña sheep breed. These models require lower computational and faster convergence than other methods. Moreover, in genetic evaluation programmes with large data sets, non-linear models are more advantageous. The results showed a strong impact of sexual dimorphism on growth.
Introduction
According to the official genetic improvement programme, the Segureña breed is one of the three most important Spanish meat sheep breeds. Furthermore, this breed helps boost the local economy of the regions in which it is bred – namely, the highlands of Granada, Sierra de Segura and Las Villas – which are among the poorest regions in Europe. Therefore, this breed is the main reason that people have settled in this region.
Mainly exploited in extensive and semi-extensive conditions, these animals are one of the components that balance the ecosystem of the regions they inhabit, thereby making them a mainstay of environmental and social sustainability. Despite the difficult and disadvantaged environment, this breed has achieved the most competitive and highest production returns (Hernandez, Reference Hernandez2004). The carcass yield is between 48% and 55% (Cano et al., Reference Cano, Peña, Martos, Domenech, Alcade, Garcia, Herrera, Rodero and Acero2003), owing to a light-weight lambskin that represents 8% of the total live lamb (ANCOS, 2014). The weight difference between males and females can influence the shape of the growth curve, as has been noted by several authors (Silva and Araújo, Reference Silva and Araújo2000; McManus et al., Reference McManus, Evangelista, Fernandes, Miranda, Moreno-Bernal and Santos2003; Sarmento et al., Reference Sarmento, Regazzi, Sousa, de Torres, Breda and Menezes2006).
The main selection objective and criteria are defined in the official genetic improvement programme. The evaluation herds under selection account for 62 505 animals in total. Every year, around 20 000 new lambs complete the weighting programme, and more than 45 000 new parturitions are registered for the analysis of prolificacy. The traits considered for genetic evaluation are the live weight at 30, 45 and 75 days of age and daily gain between 0 and 30, 0 and 45 and 0 and 75 days; prolificacy (number of lambs per birth); the productive longevity (leg and udder morphology); and quality of meat and carcass (MAGRAMA, 2012). The genetic evaluation is based on performances collected on farm. These data are annually evaluated using different variants of the BLUP animal model, obtaining predictions of the breeding values. Based on these predictions, a catalogue is published annually of the best 10 males, selected by a combined selection index.
Growth, described as changes in volume, size or shape of an organism over time, is a very important characteristic of living organisms (Ulutas et al., Reference Ulutas, Sezer, Aksoy, Sirin, Sen, Kuran and Akbas2010). Fitting growth curves to growth functions is an interesting method for assessing different management factors or for breeding purposes. Growth curve models provide a set of parameters that describe growth pattern over time and estimate the expected weight of animals at certain ages. In addition, the parameters obtained from growth functions are highly heritable and have been used in selection studies (Daskiran et al., Reference Daskiran, Koncagul and Bingol2010).
The growth curve is represented mathematically as a function of age and live weight, covering all or part of the animal’s lifespan (Echeverri et al., Reference Echeverri, Bergmann, Toral, Osorio, Carmo, Mendonça, Moustacas and Henry2013). These growth curves show initially a self-accelerating stage (slope increase) followed by a deceleration stage (slope decline) (Brody, Reference Brody1945). Growth curves have been studied extensively in many types of cattle, and several mathematical models have been proposed to describe the growth behaviour reporting differences of fit accuracy among breeds (Hamouda and Atti, Reference Hamouda and Atti2011; Tariq et al., Reference Tariq, Iqbal, Eyduran, Bajwa, Huma and Waheed2013). Many mathematical functions have been used to represent growth curves in sheep. In this species, the models that better represent sheep growth are the non-linear Brody, von Bertalanffy, Verhulst, logistic and Gompertz models, as reported in the studies of Topal et al. (Reference Topal, Ozdemir, Aksakal, Yildiz and Dogru2004), Hamouda and Atti (Reference Hamouda and Atti2011), Tariq et al. (Reference Tariq, Iqbal, Eyduran, Bajwa, Huma and Waheed2013), among others. These are the most significant functions in the ovine species according to the existent literature. Other basic models such as linear and quadratic models were preliminarily tested, but their fitting criteria were very bad with respect to the other models achieved in this paper. In order to concrete the discussion of our findings and reduce the extension of the document, these models were removed from the definitive design.
Moreover, Lambe et al. (Reference Lambe, Navajas, Simm and Bünger2006), in their study of two contrasting breeds from birth to slaughter, state that the fastest phase of growth, observed in young animals, is often assumed to be linear, and linear regressions or ratios between BW gain and time are used to model growth.
Biological growth can be defined as the weight gain of an animal until it reaches adulthood. In the early stages of life, this growth accelerates and weight gain is greater than when close to adulthood, producing a sigmoid curve. As the animal develops, the growth rate modifies, and a plot of growth rate presents a change in curvature, which identifies the highest growth rate point. After this inflection point, growth gradually decreases and the growth rate is slower. This tendency continues until growth is stabilized, a fact that, mathematically, coincides with the horizontal asymptote of the growth curve (Fitzhugh, Reference Fitzhugh1976; Gómez et al., Reference Gómez, Muñoz and Betancur2008).
Commercial growth is the weight gain of the animals solely during the period comprised between birth and slaughter (slaughter age is around 80 days). This age is determined by cultural aspects such as the carcass size demanded by consumers, but also by technological criteria such as the level of fattening in the carcass. Therefore, economically this is the most important growth phase. The commercial growth period also varies from one breed to another, depending on genetic and environmental aspects, but is also affected by cultural and technological aspects based on differences in customs among regions regarding the manner and time of slaughter.
Therefore, there is a significant variation among populations and breeds regarding growth behaviour during the animal’s biological and commercial lifespan; therefore, the best fitting curve must be determined for each breed or population, taking into account the whole lifespan and the restricted period between birth and slaughter.
The commercial curve is of interest and can be applied for breeding and economic purposes, whereas the biological curve involves physiological, nutritional and technological aspects, among others.
Very few studies have been conducted on the Segureña sheep breed (Hernandez, Reference Hernandez2004; León et al., Reference León, Barba, Gama, Carolino, Puntas, Quiroz and Delgado2005). The relationship between the animal’s age, growth rate and maturity can be studied using non-linear empirical models. This information is important for research purposes and for recommendations regarding production, breeding and reproduction. The estimation of biologically interpretable parameters of a growth function, in association with the production characteristics of the animals, can be an alternative for selection programmes that seek precocity with higher weight and carcass quality (Souza and Bianchini Sobrinho, Reference Souza and Bianchini Sobrinho1994; Ulutas et al., Reference Ulutas, Sezer, Aksoy, Sirin, Sen, Kuran and Akbas2010). The main aims of these models are to describe and predict growth and make inferences based on an interpretation of growth parameters (Ratkowsky, Reference Ratkowsky1983). Choosing a suitable mathematical function is crucial in efficiently describing growth evolution during the animal’s commercial and biological life; an appropriate choice should, therefore, be based on data from different populations and herds (León et al., Reference León, Macciotta, Gama, Barba and Delgado2012).
The objective of this study was to determine the best non-linear growth curve models for the growth performance of the Segureña sheep breed. This important tool can be applied to several aspects of the breed’s breeding programme development. The curve parameters can be used as new selective criteria to improve the productive behaviour of the breed – for example, precocity can be inferred from the curve slope, whereas the best time for slaughter can be inferred from the inflection point. This information is also useful for marketing and commercial forecasts, giving information regarding predictions of production, as well as for creating feeding plans, to match feeding supply to production.
Material and methods
The weight-age data for this study were obtained from 60 694 individuals from the historical archives of the National Association of Segureña Sheep Breeders (ANCOS). The data were collected from 2000 to 2013. This archive has all the information regarding lamb weights at different ages of reference – birth, early weaning, late weaning and slaughter – and information about the origin of each lamb (livestock, date of birth, parentage, etc.). Real weighing dates were used to compare with best fitted model-estimated results. Data were grouped as follows: P 0: weighed lambs between 0 and 15 days of age; P 1: weighed lambs between 16 and 35 days of age; P 2: weighed lambs between 36 and 55 days of age; P 3: weighed lambs between 56 and 80 days of age; and adults.
The data file was checked to eliminate outliers. The original data were purged, first, by anomalous dates, then by each weighing date and, finally, all data at least twice the standard deviation above and below the average weight in each weighing were removed. With this restriction, a confidence over 99% of belonging to the distribution is ensured. After this evaluation, only data from 59 937 animals, representing 98.75% of the total, and 129 610 weight observations were retained for this study. All models were fitted using multiple observations of the dependent variable (weights) for each point of the independent variable (day of life). Field data were used to fit the models, and as these data presented too many outliers it was decided that it was better to assume an overvaluation of pseudo R 2 than using data that will distort the results in an uncontrolled manner.
A higher number of females was observed, 35 290 (58.88%), than males, which was 24 647 (41.12%). Table 1 presents information regarding the number of observations and the average weight by sex and age: males were statistically (P<0.001) heavier than females. There were 165 adult females and 68 adult males: 19 animals from 3 to 6 months of age, 12 animals from 6 months to 1 year of age, 37 animals from 1 to 2 years of age, and 165 animals of 2 years and older.
Number of observations and weight average (WA) of Segureña sheep distributed by sex and age

P 0=lambs between 0 and 15 days; P 1=lambs between 16 and 35 days; P 2=lambs between 36 and 55 days; P 3=lambs between 56 and 80 days of age; CV=coefficient of variation.
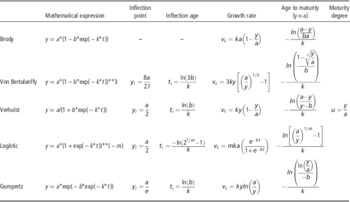
The models used – Brody, von Bertalanffy, Verhulst, Gompertz and logistic – whose mathematical expressions and biological parameters are found in Table 2, were fitted to the data using the non-linear regression procedure from the SPSS version 19 statistical package. In all cases, individual observations were used to fit the correspondent population.
Mathematical description of growth models, biological parameters and growth evaluators

y=weight, in kg, at age t; t=age in days; a, b, k and m=parameters.
The parameter a is defined as the asymptotic value of the function when the time tends to infinity; this value represents the asymptotic weight of the animal, regardless of fluctuation problems due to genetic and environmental effects. The parameter b allows calculation of the inflection age. Parameter k represents the relative growth rate (rate of exponential growth); high values indicate animals with precocious maturity – that is, animals that attain maturity weight quickly, and low values indicate animals with a delayed maturity or that tend to mature more slowly. Parameter m gives the shape of the growth curve and, consequently, determines the inflection point, the beginning of the auto-deceleration stage until the animal reaches adult size (McManus et al., Reference McManus, Evangelista, Fernandes, Miranda, Moreno-Bernal and Santos2003; Echeverri et al. Reference Echeverri, Bergmann, Toral, Osorio, Carmo, Mendonça, Moustacas and Henry2013; Tariq et al., Reference Tariq, Iqbal, Eyduran, Bajwa, Huma and Waheed2013). Quantitative growth can be characterized using the parameters of each model (Brown et al., Reference Brown, Fitzhugh and Cartwright1976; Fitzhugh, Reference Fitzhugh1976; Hamouda and Atti, Reference Hamouda and Atti2011). The formula for estimating the age at maturity was developed by the authors of the present study, and is presented, for each model, in Table 2.
The growth rate estimates the increase in weight per unit of time (Quirino et al., Reference Quirino, Bergman, Vale Filho and Pereira1999; Freitas, Reference Freitas2005). The degree of maturity should be treated as the weight change in relation to the weight at adulthood, or as an indicator of the speed with which the animal approaches its adult size (Fitzhugh, Reference Fitzhugh1976; Carneiro et al., Reference Carneiro, Malhado, PRAM, Pereira, Suzart, Ribeiro and Rocha2009).
To select the best curve, there are five principal criteria of adjustment, mentioned by numerous authors (Gbangboche et al., Reference Gbangboche, Alkoiret, Salifou, Farnir, Leroy and Abiola2011; Echeverri et al. Reference Echeverri, Bergmann, Toral, Osorio, Carmo, Mendonça, Moustacas and Henry2013; Tariq et al., Reference Tariq, Iqbal, Eyduran, Bajwa, Huma and Waheed2013): determinative coefficient (pseudo R 2), mean square error (m.s.e.), number of iterations, Akaike information criterion and biological coherence of the estimated parameters. For each of these criteria, the optimum was interpreted as follows:
-
1. The lowest value of the m.s.e. of the studied equation, as a measure that includes the variability of the factors that the investigator has not considered.
-
2. The highest level of the determinative coefficient (pseudo R 2).
In its non-linear regression tool, the SPSS package applies the Levenberg–Marquardt algorithm method, which is used in cases where the parameters are closely correlated. When using linear regression models, the quality of fit of the model is represented by the determinative coefficient, known as R 2. In non-linear regression, this is not the correct measure. One problem with the definition of R 2 is that it requires the presence of an intersecting point, which does not exist in most non-linear models. The measure that approximates R 2 in non-linear models is the pseudo R 2. This value is slightly lower than the R 2 from the linear model:
(1) $${\rm pseudo\ }R^{2} =1{\minus}{{{\rm SSResidual}} \over {{\rm SSTotal}_{{{\rm Corrected}}} }}$$
-
3. The smallest number of iterations needed to reach the value of the model parameters indicates the computational ease of the mathematical function used.
-
4. The lowest value of the Akaike information criterion (Thomas et al., Reference Thomas, Annaz, Ansari, Serif, Jarrold and Karmiloff-Smith2009): this criterion takes into account changes in the quality of fit and differences between the number of parameters in both models (Posada and Noguera, Reference Posada and Noguera2007).
(2)Where p=number of parameters+1, SSE=sum of squares of the residuals and n=number of observations.
$${\rm AIC}=n{\times}\ln \left( {{{{\rm SSE}} \over n}} \right){\plus}2p$$
-
5. Biological coherence of the estimated parameters.


The determinative coefficient should be interpreted with caution, because the models might have limited predictive capacity and present high values of pseudo R 2, which is why this coefficient must not be the only criterion for choosing between models (Noguera et al., Reference Noguera, Pereira and Solarte2008). This evaluator is used to compare the goodness of fit of models with different numbers of parameters (Souza, Reference Souza2010).
Results and discussion
Homogeneity of means and of variances between sexes were analysed to infer whether they showed the same distribution or not, to decide whether a single adjustment was valid for the population or whether the analysis should be made separately by sex. An F-test for homogeneity of variances was applied using Microsoft Excel 2010 and, with a P=0.09, it was concluded that the variances for the weights of both sexes were homogeneous. When conducting a t-test of homogeneity of means, it was concluded that, with a P<0.001, the averages of the weights between sexes were heterogeneous, implying the need to infer the adjustments separately for each sex. This conclusion was also presented by McManus et al. (Reference McManus, Evangelista, Fernandes, Miranda, Moreno-Bernal and Santos2003), Ulutas et al. (Reference Ulutas, Sezer, Aksoy, Sirin, Sen, Kuran and Akbas2010) and Gbangboche et al. (Reference Gbangboche, Alkoiret, Salifou, Farnir, Leroy and Abiola2011), among others.
Brown et al. (Reference Brown, Fitzhugh and Cartwright1976), Bathaei and Leroy (Reference Bathaei and Leroy1998) and McManus et al. (Reference McManus, Evangelista, Fernandes, Miranda, Moreno-Bernal and Santos2003) emphasized that the most important biological relationship in a growth curve is the relation between the parameters a and k. A negative correlation between these parameters indicates that early maturing animals tend to grow into animals with smaller mature weights.
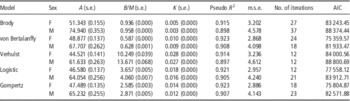
Given the quality-of-fit criteria, all models are suitable for describing the growth of the Segureña sheep breed (Table 3). Brody’s model is the least suitable, as it has the lowest coefficient of determination (pseudo R 2) and the highest values for m.s.e., Akaike information criterion and number of iterations. Consistent with the findings of Gómez et al. (Reference Gómez, Muñoz and Betancur2008) and corroborated by the research of Brown et al. (Reference Brown, Fitzhugh and Cartwright1976) and Gbangboche et al. (Reference Gbangboche, Alkoiret, Salifou, Farnir, Leroy and Abiola2011), the von Bertalanffy, Gompertz and Verhulst models overestimate weights at early ages, whereas the Verhulst model underestimates the weight at maturity. The low value of the number of iterations indicates that all models fit the data.
Estimated parameters for each model in the study of the biological growth curve for both sexes of the Segureña sheep breed

s.e.=standard error; pseudo R 2=non-linear determinative coefficient; m.s.e.=mean square error; AIC=Akaike information coefficient.
There is a relatively small difference between the estimated parameters a and k in all models for males and females. According to parameter a, all models confirmed that males are heavier than females, which is consistent with the greater average weights of males at all ages of reference, as is evident in Table 1. This was also observed by several authors in the study of different species (Carneiro et al., Reference Carneiro, Malhado, PRAM, Pereira, Suzart, Ribeiro and Rocha2009; Ulutas et al., Reference Ulutas, Sezer, Aksoy, Sirin, Sen, Kuran and Akbas2010; Gbangboche et al., Reference Gbangboche, Alkoiret, Salifou, Farnir, Leroy and Abiola2011).
The parameter k represents the animal’s rate of maturity and indicates the growth velocity in reaching the asymptotic weight from the initial weight. High values of the parameter k indicate that the animals reach maturity earlier (Brown et al., Reference Brown, Fitzhugh and Cartwright1976; Carolino and Gama, Reference Carolino and Gama1993; McManus et al., Reference McManus, Evangelista, Fernandes, Miranda, Moreno-Bernal and Santos2003), and, as can be observed in Table 3, females have a higher rate of maturity (between 0.005 and 0.028) than males (between 0.003 and 0.027), as was also observed by Bathaei and Leroy (Reference Bathaei and Leroy1998), Gbangboche et al. (Reference Gbangboche, Glele-Kakai, Salifou, Albuquerque and Leroy2008), Ulutas et al. (Reference Ulutas, Sezer, Aksoy, Sirin, Sen, Kuran and Akbas2010), and, consequently, have a lower weight at maturity. The growth rates estimated by these models showed that females grow at a higher rate than males, although the differences between males and females were quite small, and always in favour of females, as reported in previous studies (Bathaei and Leroy, Reference Bathaei and Leroy1998; Gbangboche et al., Reference Gbangboche, Youssao, Senou, Adamou-Ndiaye, Ahissou, Farnir, Michaux, Abiola and Leroy2006; Ulutas et al., Reference Ulutas, Sezer, Aksoy, Sirin, Sen, Kuran and Akbas2010). The Brody model estimated the lowest growth rates for males and females, whereas the Verhulst model estimated the highest growth rates in both sexes.
As presented in studies by several authors on sheep growth (Topal et al., Reference Topal, Ozdemir, Aksakal, Yildiz and Dogru2004; Gbangboche et al., Reference Gbangboche, Alkoiret, Salifou, Farnir, Leroy and Abiola2011; Hamouda and Atti, Reference Hamouda and Atti2011), the model that best fits the observed data to determine the growth curve of animals of both sexes of the Segureña sheep breed is the von Bertalanffy model (Table 3). Accepting this model as the best descriptive model for the growth of this breed from birth to adulthood, an inflection point (Table 2) occurs around 70.4 days for males and 56.6 days for females, at weights of 20.06 and 14.48 kg, respectively. Therefore, it follows that the optimal age of slaughter for females should be around 2 weeks earlier than males to achieve maximum efficiency in the conversion of consumed feed. Logically, the recommended slaughter weights for females must be lower, because after inflection animals tend towards fattening and not muscle growth.
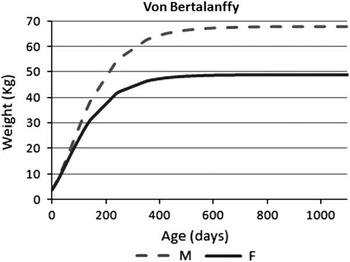
Biological growth curves (males and females) predicted by the von Bertalanffy model are presented in Figure 1. Female adult live weight was lower and was achieved at an earlier age than males. These facts, induced by sexual dimorphism, justify a different zootechnical treatment to reach maximum economic efficiency.
Comparison of biological growth curves for male and female Segureña sheep, with weights predicted by the von Bertalanffy model.

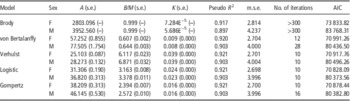
Values obtained for the estimated parameters of each model for the commercial curve, where the weights are used up to slaughter age, as well as the calculated values for the criteria for evaluating the quality of fit, are shown in Table 4. These values show a great variation from one breed to another depending on the traditional consumer demands, determined by cultural aspects. For instance, lambs from dairy breeds are slaughtered significantly earlier than lambs from breeds reared for meat. Segureña lambs are in demand in the market at an age of around 80 days, known as ternasco or recental.
Estimated parameters for each model in the study of the commercial growth curve for lambs of both sexes of the Segureña sheep breed

s.e.=standard error; pseudo R 2=non-linear determinative coefficient; m.s.e.: mean square error; AIC=Akaike information coefficient.
When fitted to the lamb’s weight, the Brody model produces very inadequate parameters. The parameter a is estimated with an unacceptable value for these animals (3952.6 for males and 2803.1 for females). The values obtained for all the criteria of fit are the worst among the models under study: it has the lowest pseudo R 2, the highest m.s.e., it fails to converge and it has the highest Akaike information criterion. From this, it can be concluded that, in agreement with Lewis et al. (Reference Lewis, Emmans, Dingwall and Simm2002), the Brody model does not fit the data for Segureña lambs until slaughter age. This can be explained by the fact that this model predicts more accurately growth at older ages (Brown et al., Reference Brown, Fitzhugh and Cartwright1976; Fitzhugh, Reference Fitzhugh1976; Gómez et al., Reference Gómez, Muñoz and Betancur2008). In the literature, several authors have excluded the Brody model as an explanatory model for sheep growth (McManus et al., Reference McManus, Evangelista, Fernandes, Miranda, Moreno-Bernal and Santos2003; Sarmento et al., Reference Sarmento, Regazzi, Sousa, de Torres, Breda and Menezes2006).
The remaining four growth models fitted the growth data well (pseudo R 2=0.903 for males and pseudo R 2=0.921 for females), confirming their eligibility. The logistic model had the lowest value for all other fitting criteria – m.s.e., number of iterations and Akaike information criterion – in both sexes. As studies by other authors on sheep growth show (McManus et al., Reference McManus, Evangelista, Fernandes, Miranda, Moreno-Bernal and Santos2003; Freitas, Reference Freitas2005; Carneiro et al., Reference Carneiro, Malhado, PRAM, Pereira, Suzart, Ribeiro and Rocha2009), the model that best fits the observed data to determine the commercial growth curve of Segureña lambs, in both sexes, is the logistic model.
Growth rates, estimated by the models for zootechnical growth curves, varied between 0.008 and 0.039 for males and between 0.009 and 0.039 for females. The von Bertalanffy model had the lowest estimates of growth rates in both sexes, whereas the Verhulst model had the highest estimates.
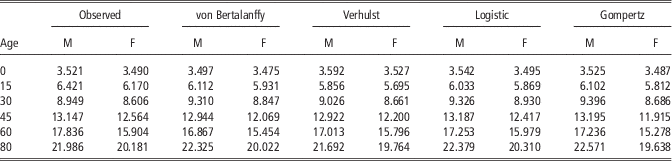
Table 5 presents weights predicted by the models at different ages, differentiated by sex. This table confirms the superiority of the weights of the males compared with the females. All the models studied predicted weights at slaughter age consistent with the data presented in the literature, which are indicative of well-fitting models.
Predicted weights, in kg, of Segureña sheep at different ages differentiated by sex

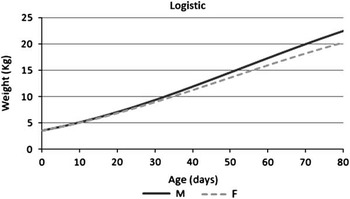
Commercial growth curves with weights predicted by the logistic model, for both sexes, are presented in Figure 2, where a slight difference in slope is evident.
Comparison of commercial growth curves for male and female Segureña sheep, with weights predicted by the logistic model.

In general, we observed that sexual dimorphism is evident in our results, both regarding biological and commercial growth patterns. This is justified by increasing hormonal differences as the lambs approach puberty. Therefore, we recommend that producers take sex into account when establishing fattening feed lots; this procedure would enable the establishment of patterns of feeding and management fitted to the growth behaviour of each feed lot. This is relevant because, at present, feed lot finishing of lambs are not grouped by sex, but by weight or age.
Conclusions
Models considered in the present study – Brody, von Bertalanffy, Verhulst, logistic and Gompertz – are adequate to describe the growth of the Segureña sheep breed, although the Brody model does not converge in the commercial curve.
The most suitable function to explain the biological growth of the Segureña breed, from birth to maturity, is the von Bertalanffy model, for both sexes. The curve parameters showed important differences between sexes, which led us to recognize the strong impact of sexual dimorphism on growth. We highlight the value of the higher growth rate for females, indicating that they reach maturity earlier.
From birth to slaughter, the most suitable function to explain the commercial growth curve of Segureña lambs is the logistic model. During this period, we also observed a sexual dimorphism on growth.
These results, showing the importance of zootechnical applications in terms of the management of both sexes in lamb fattening feed lots, and for making decisions regarding slaughter, may also support selection programmes, as the application of non-linear models can be used for earlier selection and some curve parameters could be introduced into the breeding programme as selection criteria to improve important commercial traits such as the precocity.
Acknowledgements
The authors thank the National Association of Segureño Sheep Breeders (ANCOS). Special thanks go to Mr José Puntas and Mr Miguel Serrano for all their support in the field work.