


Introduction
In the Eurasian Arctic, Severnaya Zemlya is the easternmost archipelago, which is covered by large ice caps. This allows regional climate signals to be accessed from ice-core records. The Akademii Nauk ice cap, covering an area of 5575 km2, is the largest in the Russian Arctic, with a maximum elevation of about 800ma.s.l. (Reference DowdeswellDowdeswell and others, 2002). The first 761 m long surface-to-bedrock core on this ice cap was drilled in 1986/87 by a Russian team (Reference Savatyugin and ZagorodnovSavatyugin and Zagorodnov, 1988; Reference Klement’yev, Potapenko, Savatyugin and NikolaëvKlement’yev and others, 1991). The core has been sampled in a relatively low resolution. A chronology was published for that core indicating a Late Pleistocene near-bottom age (Reference Klement’yev, Korotkov and NikolaëvKlement’yev and others, 1988, Reference Klement’yev, Potapenko, Savatyugin and Nikolaëv1991; Reference Kotlyakov, Zagorodnov, Nikolaev, Kotlyakov and SokolovKotlyakov and others, 1990).
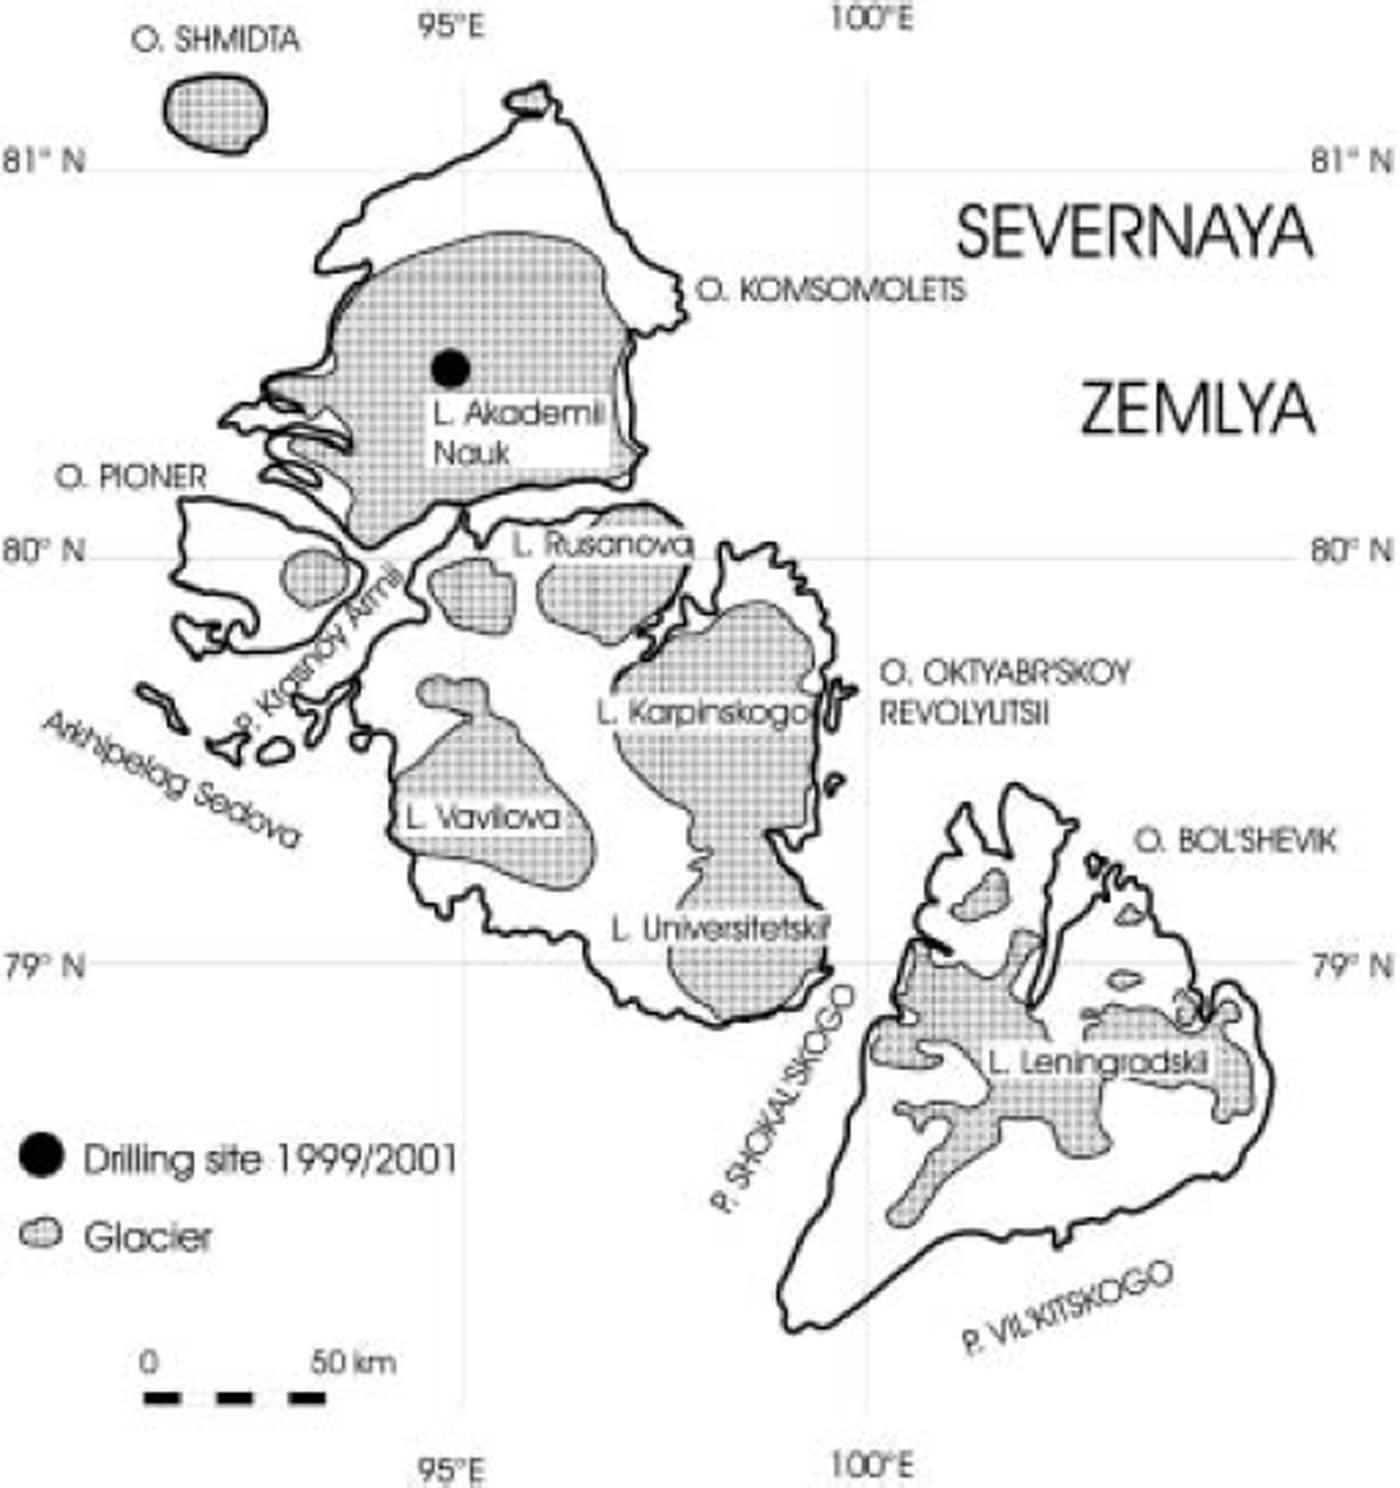
Between 1999 and 2001 the new ice core discussed here was drilled to bedrock on Akademii Nauk (Fig. 1) to improve the data resolution and to revise the previous timescale. For this new core, the drilling site was selected close to the summit considering the form and flow of the ice cap (Reference DowdeswellDowdeswell and others, 2002). Fritzsche and others (2002) report details of the drilling site at 80˚31’ N, 94˚49’ E, as well as recent accumulation rates. For technical details of the operation see Reference Savatyugin, Arkhipov, Vasiliev, Vostretsov, Fritzsche and MillerSavatyugin and others (2001). The mean annual air temperature at the drilling site was –15.7˚C for the period May 1999–April 2000 (Reference KuhnKuhn, 2000). During summer, air temperature can even be above 0˚C. In April 2000 a temperature of –10.2˚C was measured at 10 m depth. Latent heat from percolating water affects the difference between mean annual air temperature and temperature in firn. In 2000/01 the borehole temperature was between –12.40˚C at 100 m depth and –7.49˚C at the bottom, with a minimum of –14.35˚C at 209 m depth (Reference Kotlyakov, Arkhipov, Henderson and NagornovKotlyakov and others, 2004). Consequently Akademii Nauk is a cold glacier.
Location of Severnaya Zemlya and its glaciers.
Reconstructing annual signals (e.g. δ18O) in ice cores from the percolation zone of glaciers can be problematic owing to the effect of meltwater infiltration (Reference KoernerKoerner, 1997). The variation of stable isotopes in ice (δD and δ18O) can be eroded, but, at least in particular cases, seasonal cycles still persist (Reference PohjolaPohjola and others, 2002). Sometimes the deuterium excess d (d = δD – 8δ18O) resolves the annual variation better than the corresponding δD or δ18O data, as shown for the Vernagtferner, Oetztal Alps, Austria (Reference Stichler, Baker, Oerter and TrimbornStichler and others, 1982).
We present density, δ18O, δD and d profiles as well as the melt-layer content from the uppermost 136 m of the new Akademii Nauk ice core. These parameters are compared to electrical conductivity obtained by dielectrical profiling (DEP) of the same core sequence. A chronology is given based on the annual-layer thickness determined from δ18O and d and using the time markers from volcanic events detected by DEP measurements. According to this depth– age model, the core section under investigation covers approximately 275 years.
Analytical Methods
The core was processed in the cold laboratory of the Alfred Wegener Institute in Bremerhaven. Processing included the following steps:
1. Quasi-continuous density measurements (g-densimeter) and DEP (Reference Moore and ParenMoore and Paren, 1987) were taken nondestructively at 5 mm resolution on a combined bench, which was also used for analysis of ice cores from Greenland (NorthGRIP) and Dronning Maud Land, Antarctica (EPICA). For a detailed description refer to Reference WilhelmsWilhelms (2000).
2. Following the DEP measurements, two slices were cut with a horizontal band-saw parallel to the core axis. The first 11 mm thick segment was sampled for isotopes (δ18O, δD); the second, a 30 mm thick plate, was polished for optical scanning of the internal structure, and subsequently sampled for chemical investigations (Reference Weiler, Fischer, Fritzsche, Ruth, Wilhelms and MillerWeiler and others, 2005).
3. The stable isotopes were sampled from the segment in 25 mm long increments. To obtain a first overview, samples for each 1 m segment of core were collected by abrading 1-2 mm off the surface over the whole segment length with a microtome knife. The frozen samples were melted for the determination of δD and δ18O with a Finnigan-MAT Delta S mass spectrometer. The analytical precision is better than ±0.8‰ for δD and ±0.1 ‰ for δ18O (Reference Meyer, Schönicke, Wand, Hubberten and FriedrichsenMeyer and others, 2000).
4. The melt layers were visually identified on scanned pictures of coplanar slices. The scanning resolution is better than 0.1 mm, but because of irregular boundaries between melt layers and firn the fixing of layers was less precise. Accurate distinction between firn-ice and melt-impacted layers was difficult in the deeper parts of the core, but less problematic in the section discussed in this paper.
Following Reference Madsen and ThorsteinssonMadsen and Thorsteinsson (2001), we call glacial ice formed by firn only ‘firn-ice’. In the manner of Reference PatersonPaterson (1994) we use the term ‘firn’ for aggregates of several crystals with interconnecting air passages between the grains. Ice consisting of firn infiltrated by a visible content of water we call, independent of the amount of water, ‘melt-layer ice’ or ‘melt layer’. Most melt layers in this core are formed by infiltration of water into the porous firn structure. Close to the surface, the firn has a porosity of 50‰, which can be filled with percolating water. The melt-layer content is calculated by the proportion of melt-layer ice per metre by weight. In general, the amounts of melt-layer ice are a proxy parameter for warm summers, but superimposed sporadic melt features can make this interpretation complicated (Reference KoernerKoerner, 1977).
Results and Discussion
A shallow core (SZ 99-2) was drilled about 200 m east-southeast of the main coring site (SZ 99) in order to estimate the stratigraphic noise in the δ18O and melt-layer records. The two datasets are in good agreement, with a 0.55 m depth offset (Fig. 2). This offset could be caused by a compression of the uppermost winter snow during drill-tower assembly and/or by roughness of the snow surface. The uppermost 0.43 m of the main core and 0.2 m of the shallow core were lost because of their poor consolidation. Discrete, massive melt layers are found in the main core (e.g. at 2.9 or 7.8 m depth), and equivalent layers are found in the shallow core at corresponding depths. Many more small ice layers are observed in both cores. As expected, melt layers consisting of partially saturated firn are often found at various depths. The firn is not a homogeneous medium, and internal surfaces are undulated, so heterogeneous flow of vertical and horizontal percolating meltwater is the rule. Nevertheless, the two δ18O profiles look similar, but the differences in infiltration are clearly visible in detail. For example, at 8.5 m depth of SZ 99 the deformed δ18O minimum indicates infiltration of less depleted water. On the whole, the correlation of δ18O between the two cores is good, with a correlation coefficient of r = 0.67 (2.5 cm resolution, 906 samples each, 14years). An increase to more than r = 0.75 is possible with a visual piecewise adjustment (cores shifted against each other, six breaks, none overlapping).
Comparison of visible stratigraphy (a) and δ18O (b) in the upper part of the main core SZ 99 and the shallow core SZ 99-2 drilled some 200 m apart. Stratigraphy index numbers in (a): 1. firn not impacted by water; 2. partially saturated melt layers; 3. saturated melt layers. The abscissa is mirrored for easier comparison. Arrows indicate melt layers occurring in both cores at the same depth. Shading in (b) is for easy comparison.
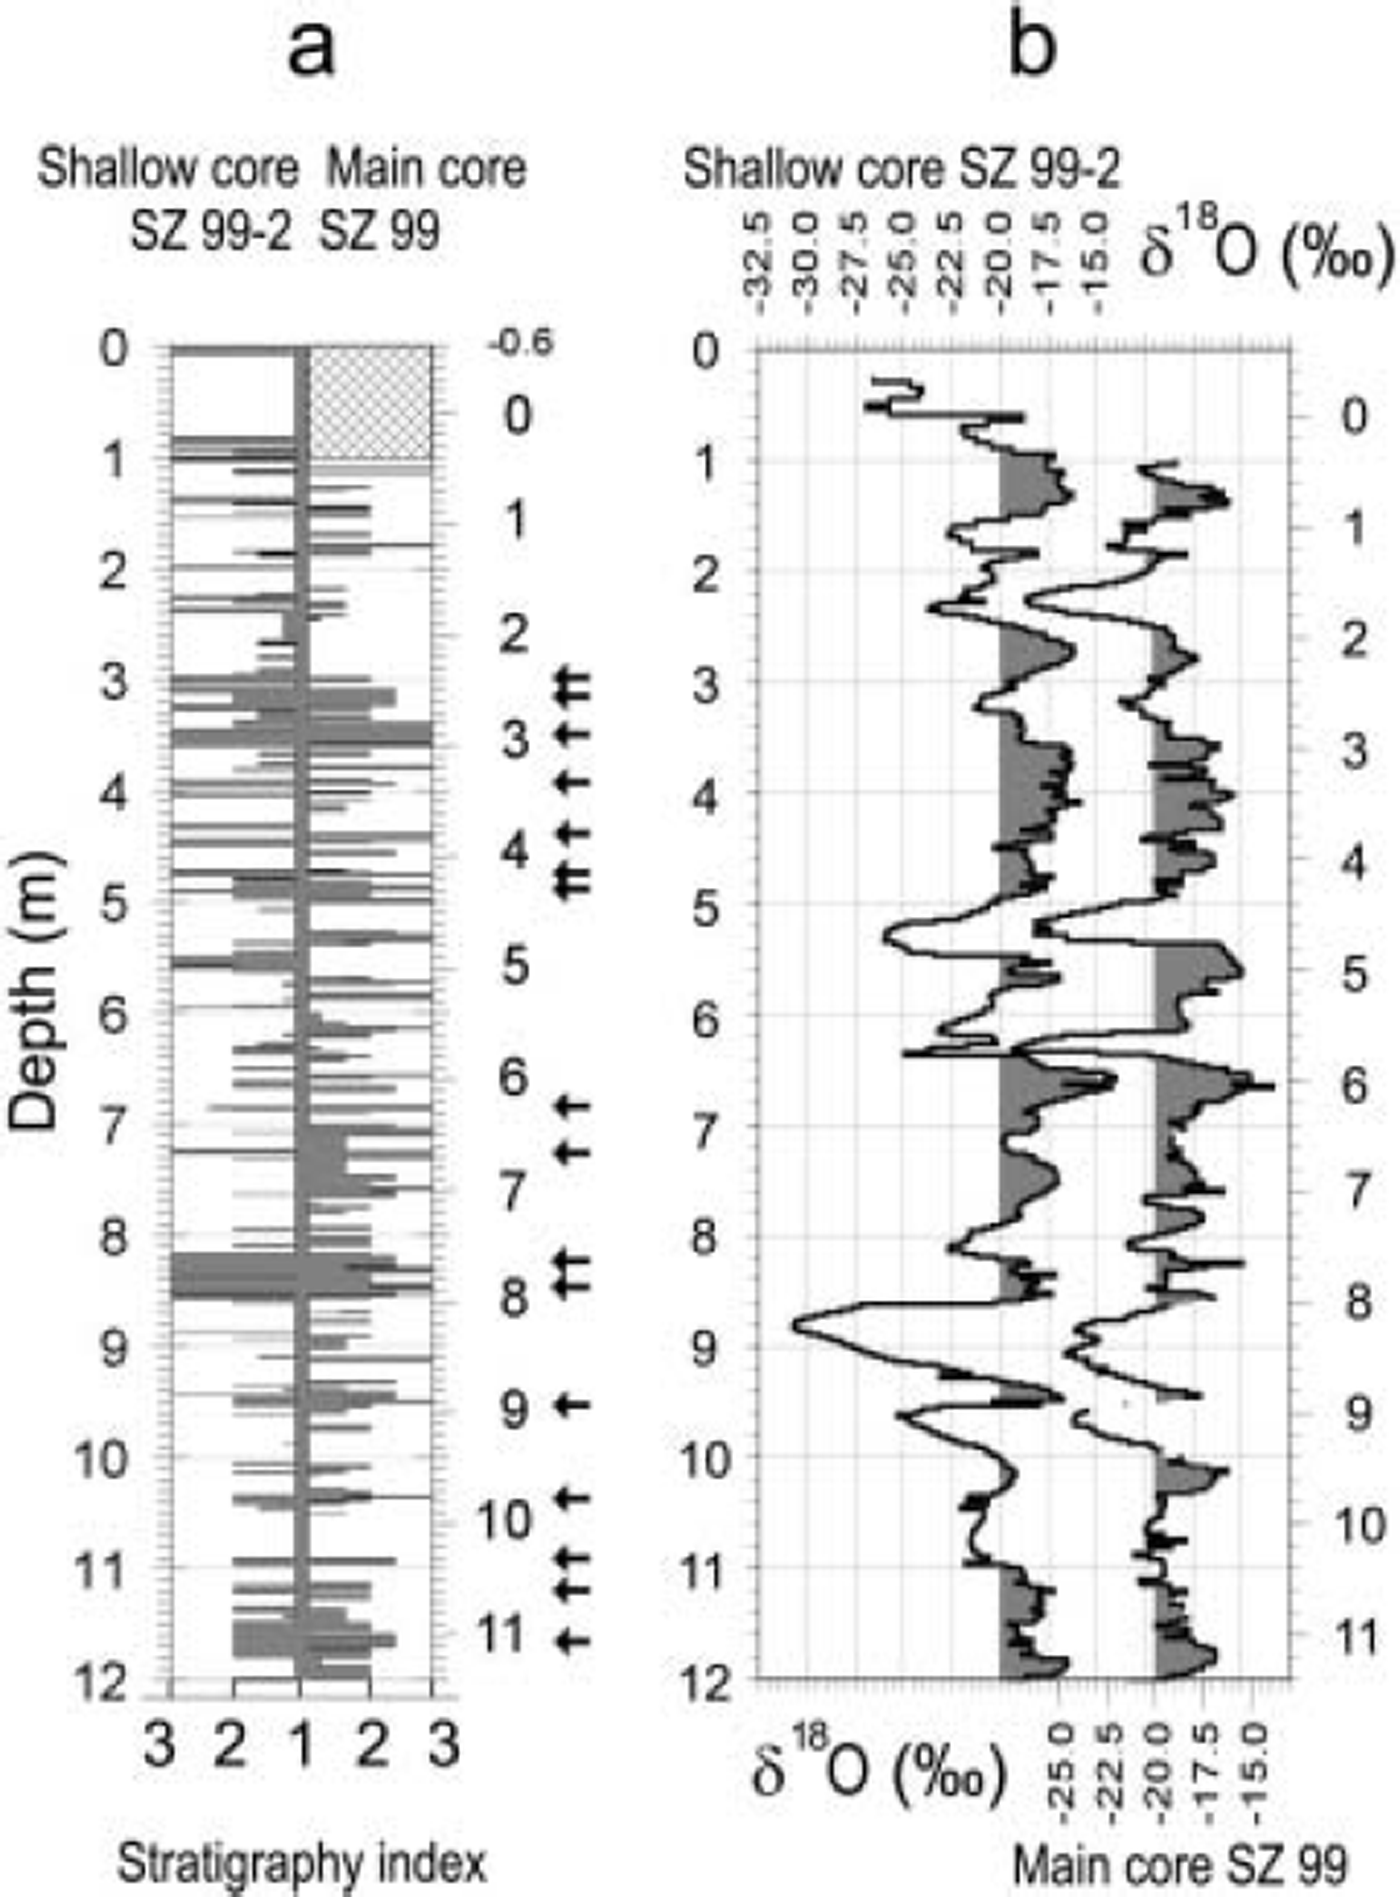
Figure 3 shows the ice-core density profile at 5mm resolution. Melt layers are obvious already in the uppermost metres of the core, with a density about 900 kg m–3. Between these layers, firn horizons appear with a typical density of 300–400 kg m–3 near the surface, and increasing density with depth. From the density profile it is apparent that the core originates from the percolation zone of the glacier. The transition from firn to ice occurs at about 60 m depth. The density profile is used to convert the depth scale into metres water equivalent (m w.e.).
Density–depth profile of the core (5 mm resolution).
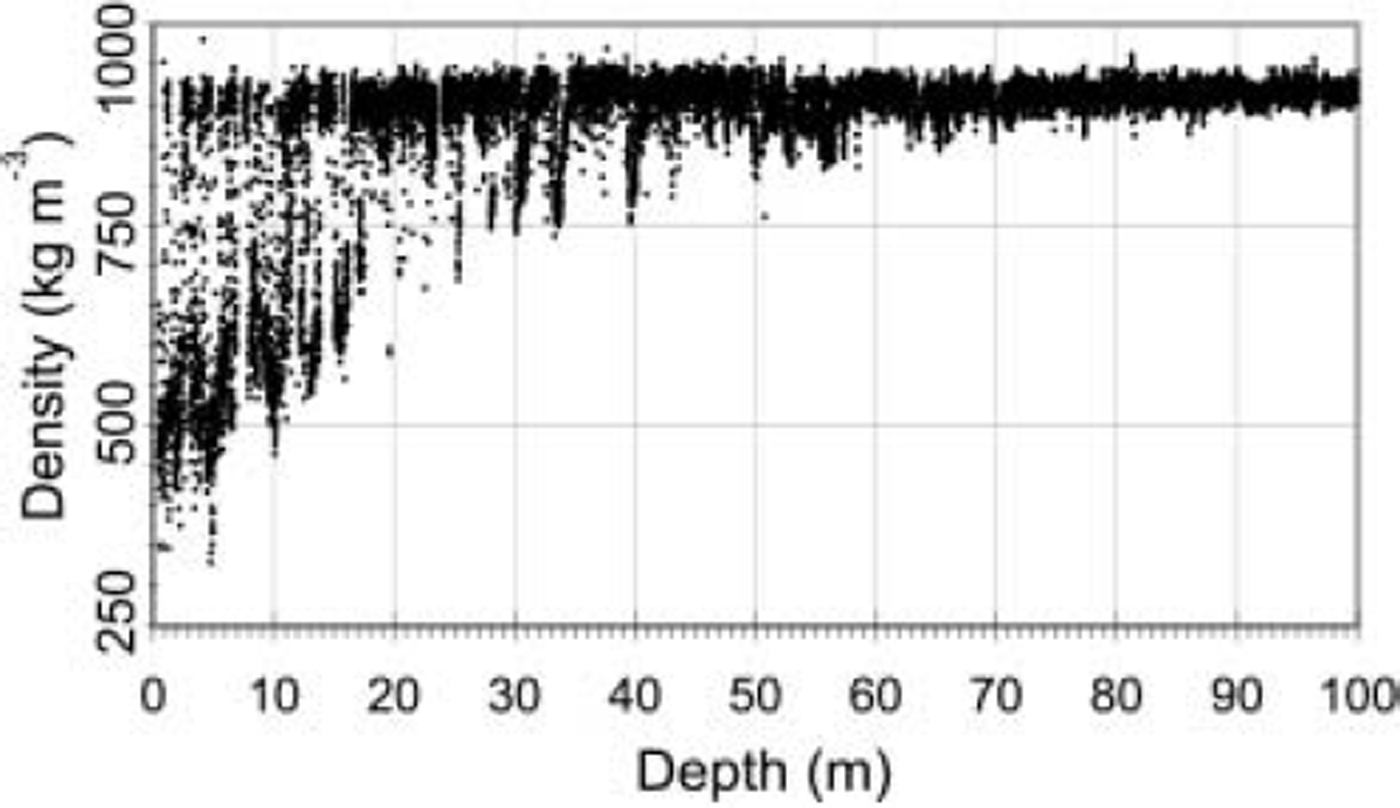
Air bubbles are found throughout the core in varying size and concentration. Only very few parts of the core are almost free of bubbles. The homogeneously distributed bubbles suggest air entrapment between firn crystals. Hence, most of the melt-impacted layers were not made entirely from refrozen (bubble-free) meltwater. For the uppermost 30m, where the density of ice and firn is sufficiently different, the calculation of infiltration from the density log (Fig. 3) agrees well with the visual recording of the melt-layer content.
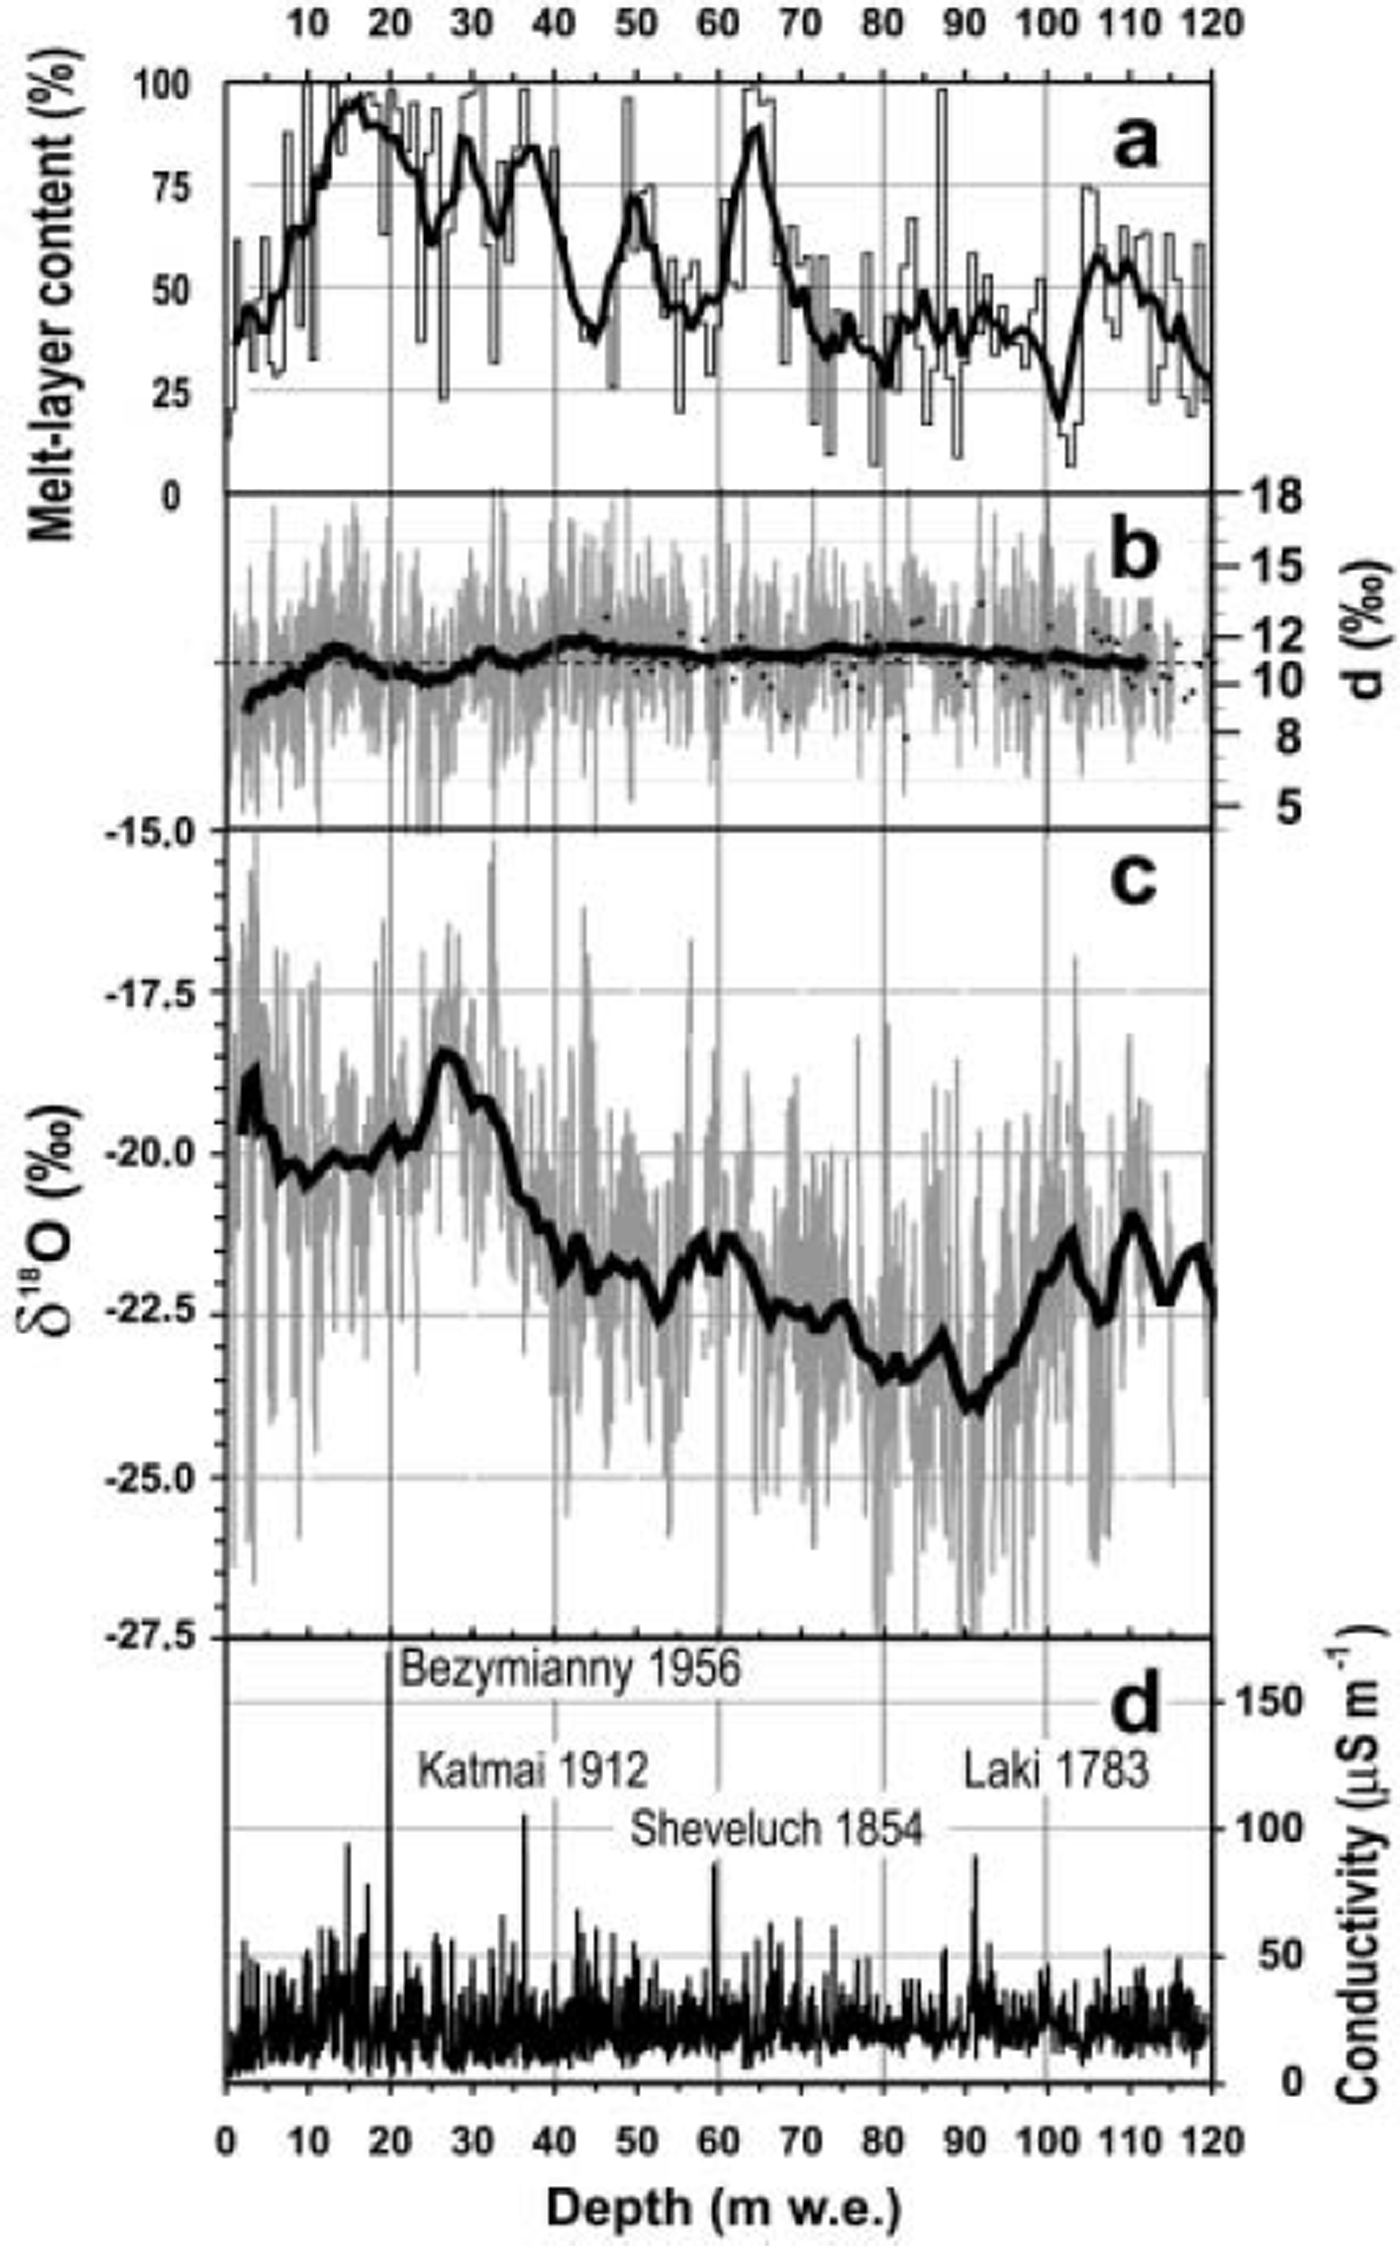
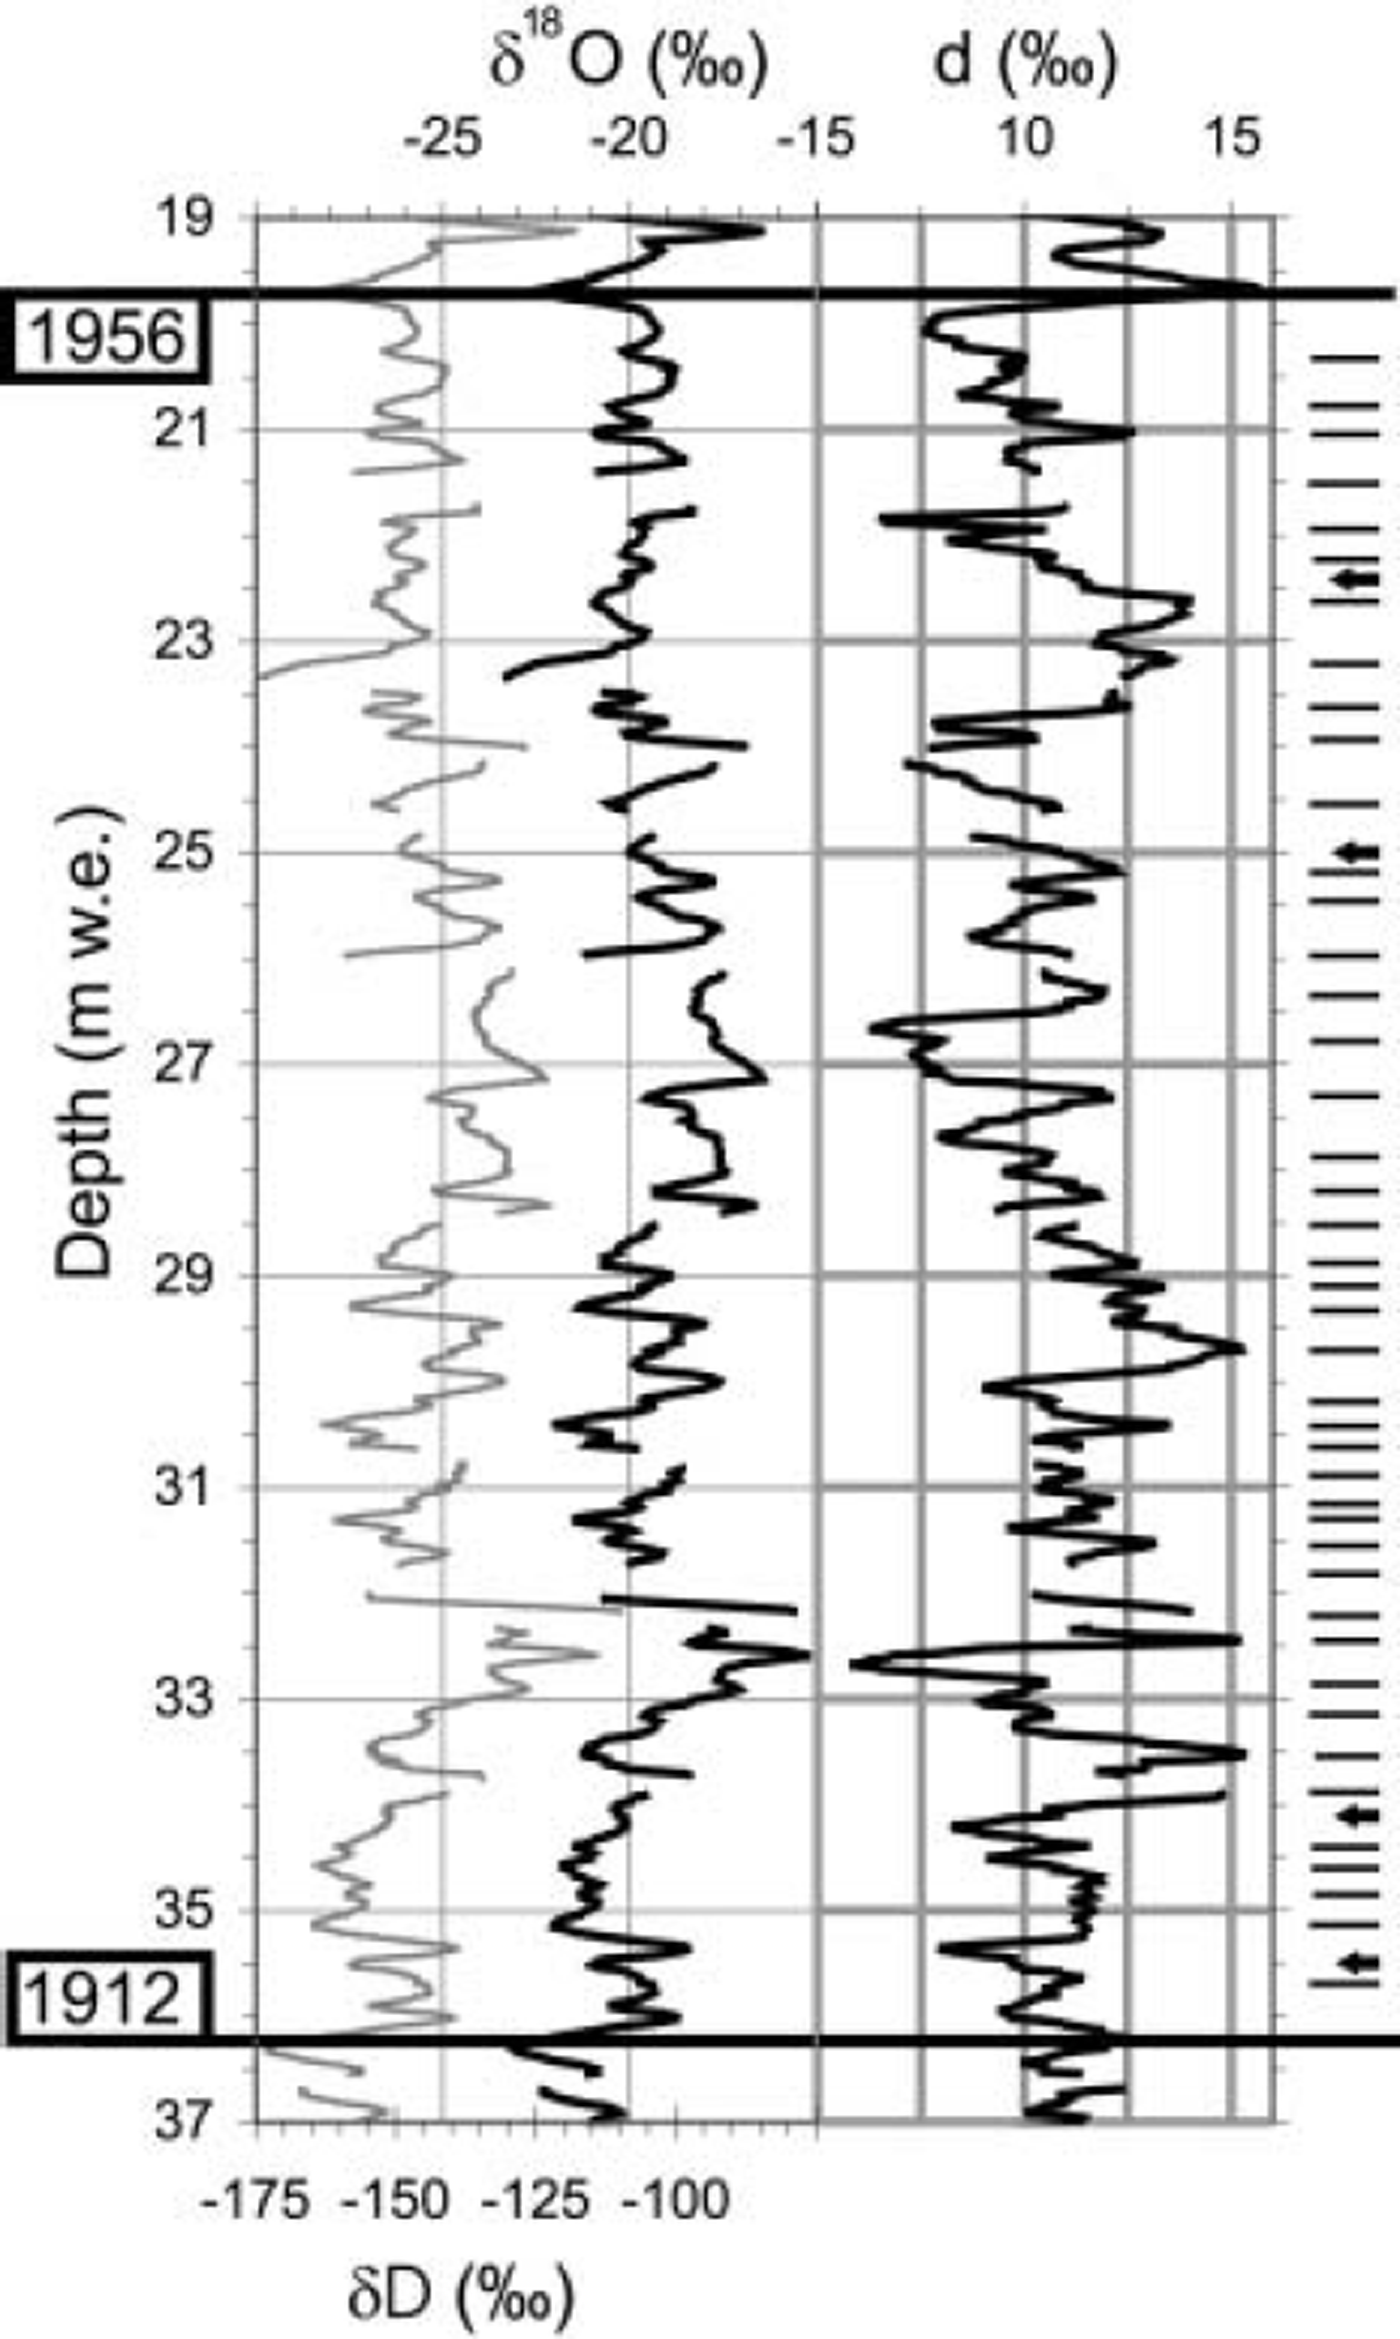
The electrical conductivity record (Fig. 4d) exhibits some of the volcanogenic time markers which were used to establish the core chronology. The conductivity peak at about 20 mw.e. depth was related by chemical analysis (Reference Weiler, Fischer, Fritzsche, Ruth, Wilhelms and MillerWeiler and others, 2005) to the 1956 eruption of Bezymianny, Kamchatka, with an attributed volcanic explosivity index (VEI) of 5 (L. Siebert and T. Simkin, http://www.volcano.si.edu/gvp/world). This is the largest conductivity peak observed in the whole core. The other peaks in conductivity are assumed to be of volcanogenic origin, and the assigned age is based on correlation with ice-core records from Greenland (e.g. from Hans Tausen Iskappe (Reference Clausen, Stampe, Hammer, Hvidberg, Dahl-Jensen and SteffensenClausen and others, 2001)). The chronology of the core section discussed here is established by identifying peaks in the conductivity record. In between the peaks the timescale is refined by counting seasonal signals in the stable-isotope records, mostly the d oscillations together with the δ18O variations. As an example, Figure 5 presents the stable-isotope variations between the Bezymianny event (1956) and the assumed Katmai (Alaska, USA) eruption (1912). On the graph’s righthand side, our interpretation of annual cycles is marked with tags. An annual mark is defined by a minimum in δD and δ18O and simultaneously a maximum in d. But four more years (arrows) could possibly be counted as well (error +10%). When counting the peaks, one finds probably more and not less years in this core, because of the appearance of additional infiltration peaks.
Profiles from the upper 120 mw.e. (136m depth) of the main core from Akademii Nauk ice cap. (a) Melt-layer content. Step function gives 1 m values, and black curve is 5 m running mean. (b, c) D excess d (b) and δ18O (c). Grey indicates 25 mm data, and black curve is 5 m running mean. (d) Electrical conductivity (DEP) (5 mm resolution).
Stable-isotope variations between the 1956 Bezymianny event and the layer with high electrical conductivity assumed to originate from the eruption of Katmai in 1912. Tags on righthand side indicate our interpretation of annual cycles. Arrows mark peaks which can be interpreted as additional years.
The melt-layer content (Fig. 4a) shows maxima at around 65, 50 and 40–10 mw.e., corresponding to the 1840s, 1880s and 1900–70 respectively. Following Reference KoernerKoerner (1977), the amount of meltwater can be considered as a proxy for summer warmth. The δ18O profile (Fig. 4c) shows a minimum at 90m w.e. (AD1790). An increasing trend of δ18O is obvious between 90 and 27mw.e. The d record exhibits annual cycles (Fig. 5), but the long-term trend is nearly constant (Fig. 4b): mean: d = 11.0‰ (dotted line).
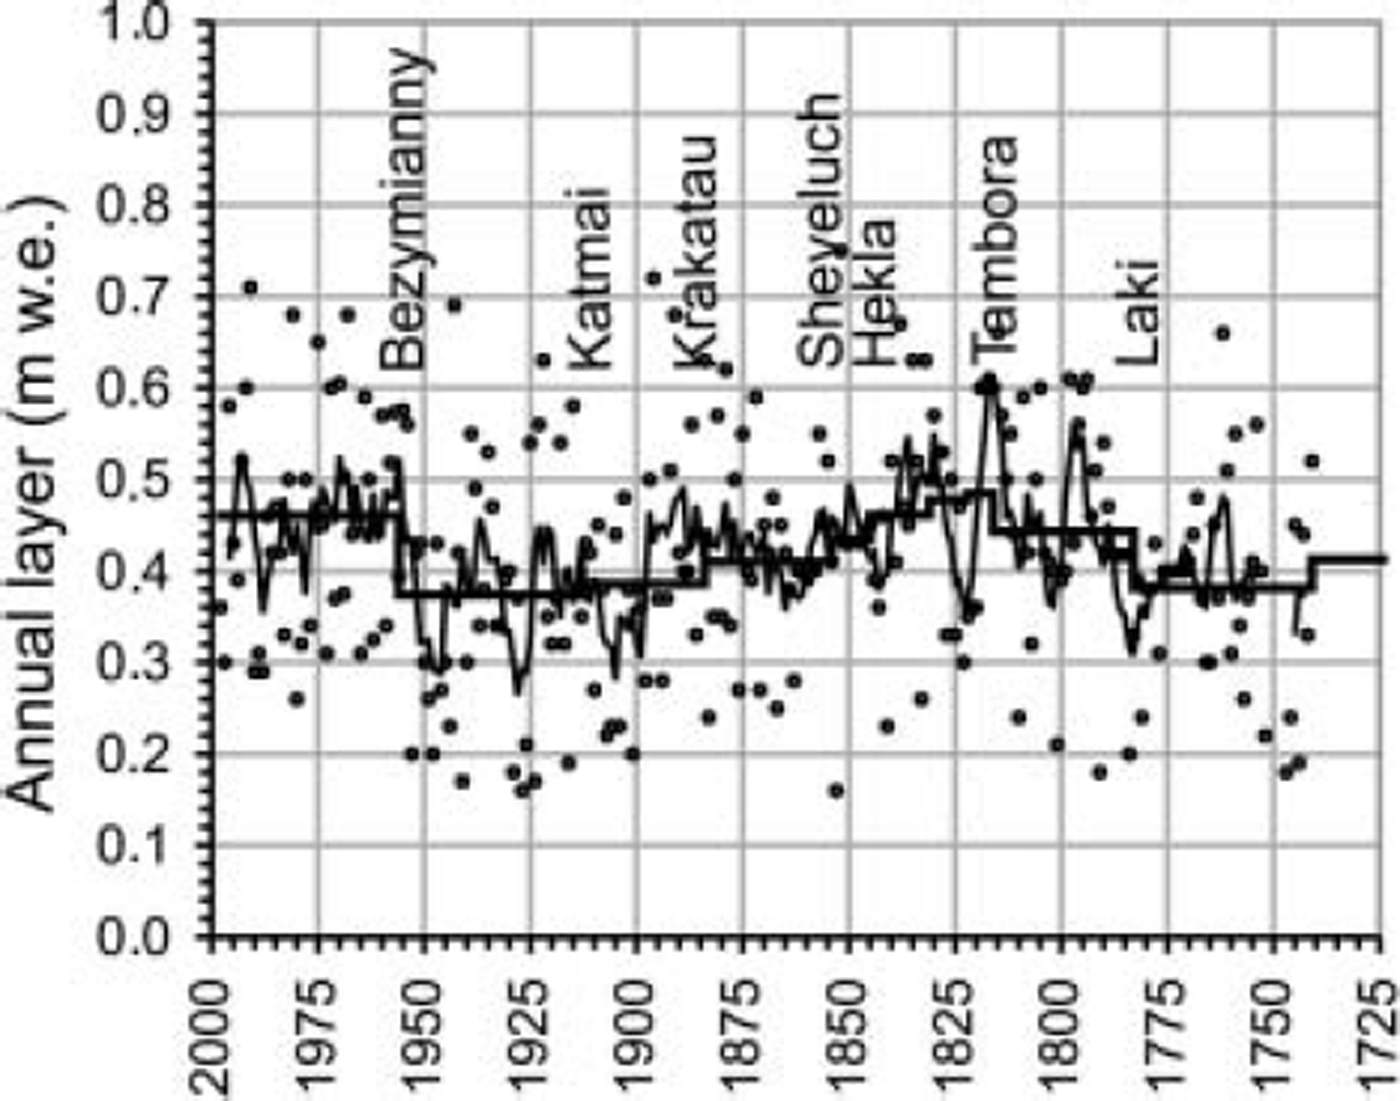
The derived annual-layer thickness for the top 120 m w.e. of the core, corresponding to the period 1725–1999, is plotted in Figure 6. The annual-layer thickness is presented as found in the core (none decompressed). The modern mean annual-layer thickness of about 0.46m w.e. agrees with the recent mean annual accumulation rate at the drill site as calculated earlier from 137Cs measurements (Fritzsche and others, 2002; Reference PinglotPinglot and others, 2003) as well as with the mean accumulation rate of 0.46 m w.e. a–1 in the period 1986/87 published by Reference Zagorodnov, Klementyev, Nikiforov, Nikolaëv, Savatyugin and SasunkevichZagorodnov and others (1990). In deeper parts of the core (not shown here) the annual-layer thickness was determined over discrete 1 m intervals by high-resolution analysis of seasonal δ18O, δD and d and variations of electrical conductivity assumed to be seasonal. We found an annual-layer thickness of about 0.12 m w.e. for the near-bottom layers. From a linear decrease in annual-layer thickness with depth as observed in the DEP profile and assuming no discontinuity in the record, we calculated a bottom age of roughly 2500 years. This is less than the age computed by a Nye model (Reference PatersonPaterson, 1994) with an accumulation rate of 0.46 m w.e. a-1 . Therefore our results imply that this ice cap was not in dynamic steady state throughout its existence, but has been growing until modern times. Similar conclusions have been drawn for Hans Tausen Iskappe, North Greenland (Reference Hammer, Johnsen, Clausen, Dahl-Jensen, Gundestrup and SteffensenHammer and others, 2001).
Annual-layer thickness, AD1725–1999, derived from δ18O and d oscillations and from interpolation between volcanic time markers. Dots show thickness of a single year, black curve the 5year running mean and the step line the mean annual-layer thickness between presumed volcanic eruptions.
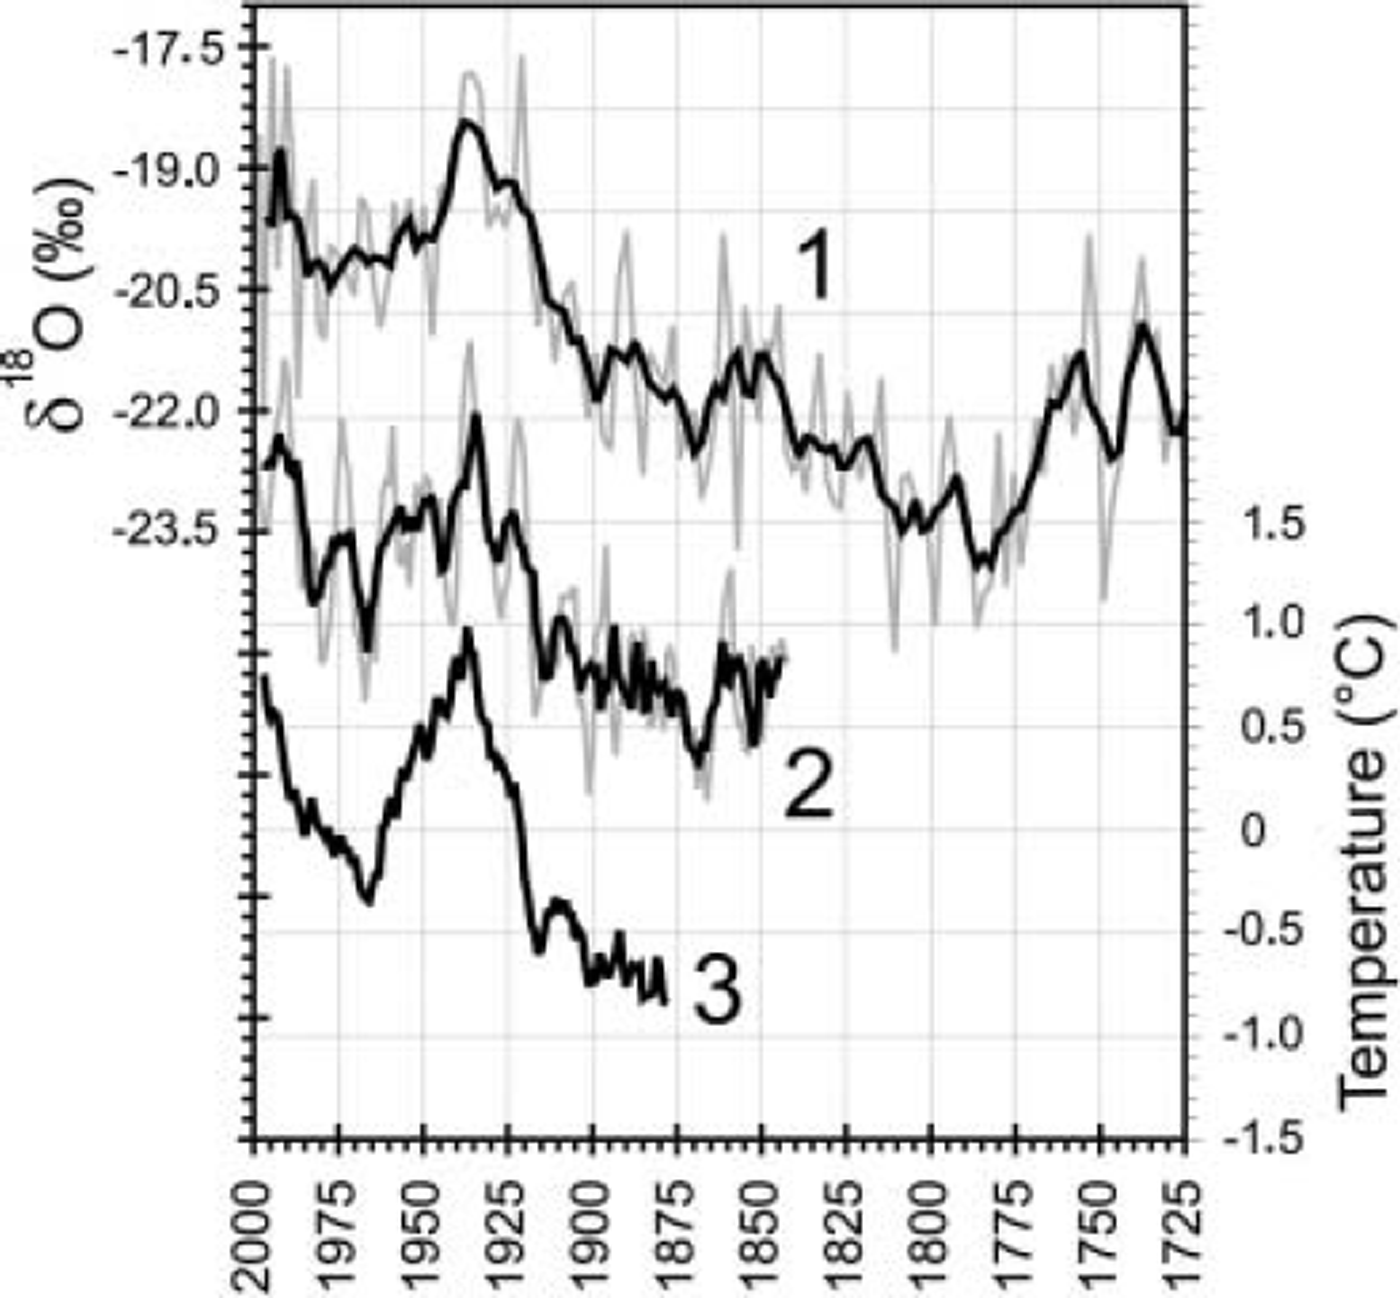
The new δ18O record from Akademii Nauk (Fig. 7) looks similar to the Vardø (Norway) temperature record (data: http://www.giss.nasa.gov/data/update/gistemp/TMPDIR/tmp.634010980003.1.1/634010980003.1.1.txt) and a composite of surface air temperatures in the Arctic (Reference PolyakovPolyakov and others, 2003) (data: http://denali.frontier.iarc.uaf.edu:8080/∼igor/research/data/airtemppres.php). The good agreement suggests that δ18O from Akademii Nauk is a good proxy for mean annual air temperature. Our δ18O record shows an absolute minimum at about 1790, following the eruption of more than ten volcanoes with a VEI ≥ 4 since 1750, including Laki, Iceland, in 1783. Thereafter the δ18O value increased until 1935, interrupted by a 10-20year long reverse trend following huge volcanic eruptions during the 1850s. For the same period, Reference Kotlyakov, Arkhipov, Henderson and NagornovKotlyakov and others (2004) present a long-term warming trend, which was reconstructed from borehole temperature logging in the Akademii Nauk 1986/87 borehole with a model considering the effects of vertical heat transfer by meltwater and its refreezing. The warming trend until the late 1930s was recorded by many meteorological stations in different regions of the Arctic (e.g. at Svalbard (Reference Brázdil and BrázdilBrázdil, 1988)). This trend is also a strong signal in composite air-temperature datasets from the Arctic as well as in data for the Northern Hemisphere at 64–90˚N (http://www.giss.nasa.gov). The increasing temperature in the 19th and at the beginning of the 20th century can also be found in glaciers on Svalbard (Reference IsakssonIsaksson and others, 2003) and in Franz Josef Land (Reference HendersonHenderson, 2002) as well as North Greenland (Hans Tausen Iskappe (Reference Hammer, Johnsen, Clausen, Dahl-Jensen, Gundestrup and SteffensenHammer and others, 2001)).
Comparison of (1) dated δ18O curve for the segment of ice core shown in Figure 4 (1m mean values and 5 m running means (approximately 2.3 and 12 years respectively); (2) air temperature measured at Vardø, North Norway (5 and 10year running mean values); and (3) trend of composite surface air temperature in the Arctic (6year running mean; deviation from mean temperature 1961–2000) (data from Reference PolyakovPolyakov and others, 2003).
Conclusions
Our investigations on the newly drilled ice core from Akademii Nauk revealed:
Annual layers could be identified in the upper 136m of core presented in this paper using a combination of high-resolution (2.5 cm) d and δ18O data.
The core was dated by combining the annual-layer thickness measurements from stable-isotope studies with volcanogenic signals in the electrical conductivity record used as time markers.
The δ18O time series is very similar to trends in air temperature measured in the Arctic. Thus the δ18O data are a good proxy for mean annual air temperature.
The accumulation rate over the period 1956–99 is about 0.46 mw.e. a–1 based on stable-isotope investigations. This finding agrees with the rates we found earlier by 137Cs radioactivity measurements and the annual accumulation rate published for 1986/87 (Reference Zagorodnov, Klementyev, Nikiforov, Nikolaëv, Savatyugin and SasunkevichZagorodnov and others, 1990). It is in disagreement with a modern annual-layer thickness of 0.26–0.28 m suggested by Reference Klement’yev, Korotkov and NikolaëvKlement’yev and others (1988) and used by Reference Kotlyakov, Zagorodnov, Nikolaev, Kotlyakov and SokolovKotlyakov and others (1990) for dating the Akademii Nauk ice core drilled in 1986/87.
Our preliminary chronology of the ice core dates the lowermost part to roughly 2500 years BP.
Acknowledgements
The drilling project was funded by the German Ministry of Education and Research (03PL027A/3). The analysis of the core was financially supported by the Alfred Wegener Institute for Polar and Marine Research. We thank A. Lambrecht for assistance with the DEP measurements, H. Henschel for correcting the English and two anonymous reviewers for their helpful comments.



