INTRODUCTION
There are four garfish species, Belone acus Risso, 1827, Belone euxini Günther, 1866, Belone svetovidovi Collette & Parin, Reference Collette and Parin1970 and Tylosurus imperialis (Rafinesque-Schmaltz, 1810), belonging to the Belonidae family in the Turkish seas (Dalyan & Eryılmaz, Reference Dalyan and Eryılmaz2006; Fricke et al., Reference Fricke, Bilecenoglu and Sarı2007). In the Black Sea and the Sea of Azov the garfish species was reported in previous studies as B. belone euxini by several authors (Salekhova et al., Reference Salekhova, Kostenko, Bogachick and Minibaeva1988; Zaitsev & Mamaev, Reference Zaitsev and Mamaev1997; Samsun et al., Reference Samsun, Samsun, Bilgin and Kalaycı2006). B.b. euxini Günther, 1866 was also recognized by Collette & Parin (Reference Collette and Parin1970) from the Black Sea and Sea of Azov. Recently the endemic garfish species in the Black Sea, the Sea of Azov and the Sea of Marmara was reported as B. euxini by Fricke et al. (Reference Fricke, Bilecenoglu and Sarı2007) and Froese & Pauly (Reference Froese and Pauly2014).
Belone euxini reach sexual maturity at 2 yr and 38.8 cm total length and spawning occurs in the warmer period between May and September in the Black Sea (Samsun et al., Reference Samsun, Samsun, Bilgin and Kalaycı2006). The absolute fecundity of this species was reported as 10,196 and 48,908 oocytes per ovary by Yüce (Reference Yüce1975) and 8460 and 51,694 oocytes per ovary by Samsun et al. (Reference Samsun, Samsun, Bilgin and Kalaycı2006). Garfish species are carnivorous, feeding mainly on small fish, mostly clupeids and crustaceans, especially crab larvae (Yüce, Reference Yüce1975; Dorman, Reference Dorman1988; Sever et al., Reference Sever, Bayhan, Bilge and Taşkavak2009). Females of B. euxini generally reach a longer length than males of the same age (Yüce, Reference Yüce1975; Samsun et al., Reference Samsun, Samsun, Bilgin and Kalaycı2006). Garfish migrate into coastal waters depending on water temperature for spawning, and after the spawning they leave the coastal area and go back to deeper open sea (Dorman, Reference Dorman1989; Zorica et al., Reference Zorica, Sinovčić and Keč2011). They live at the surface and are caught by casting or trawling with surface or near surface lures and in floating gill nets (Nédélec, Reference Nédélec1975; Collette, Reference Collette2003). The garfish is one of the most commercial pelagic fish species in the Black Sea artisanal fishery in Turkey and in recent decades the average annual catch has been about 442.2 ± 34.12 tons (232–661 tons) (TUIK, 2001–2012).
The first detailed study of the biological properties of B. belone, such as meristic characteristics, diet, age and length compositions, spawning time and gonad maturity stages, was carried out by Dorman in Courtmacsherry Bay in Southern Ireland (Dorman, Reference Dorman1988, Reference Dorman1989) and at Strömstad on the west coast of Västervick in the Baltic Sea (Dorman, Reference Dorman1991). After the studies of Dorman, age, growth, mortality (Zorica & Keč, Reference Zorica and Keč2013) and reproduction biology of B. belone such as spawning time, size at sexual maturity and fecundity (Zorica et al., Reference Zorica, Sinovčić and Keč2011) were studied between January 2003 and December 2008 in the eastern part of the middle Adriatic Sea. Embryonic and larval development of B. belone was also studied under laboratory conditions (Dulčić et al., Reference Dulčić, Baždarić, Grubišić and Dragičević2009; Kužir et al., Reference Kužir, Kozarić, Gjurčević, Baždarić and Petrinec2009). Feeding habits and growth of B. belone on Turkey's Aegean Sea coasts was studied by Uçkun et al. (Reference Uçkun, Akalin and Toğulga2004) and Sever et al. (Reference Sever, Bayhan, Bilge and Taşkavak2009). Previous research into B. euxini growth and reproduction has been rather fragmentary on the Anatolian coast of the Black Sea (Samsun et al., Reference Samsun, Özdamar and Erkoyuncu1995, Reference Samsun, Samsun, Bilgin and Kalaycı2006; Samsun, Reference Samsun1996; Polat et al., Reference Polat, İnceismail, Yılmaz and Bostancı2009).
The most common pattern of animal growth is that growth rates continually decrease with time until finally the organism reaches a steady state in adulthood (Von Bertalanffy, Reference Von Bertalanffy1951). Various growth models have been proposed to explain the growth pattern of individuals for a particular species. Non-linear models, such as exponential, Richards, Gompertz, von Bertalanffy, Morgan–Mercer–Flodin (MMF), Weibull and Janoschek models are generally used to describe a particular species' growth pattern during its lifetime (Fitzhugh, Reference Fitzhugh1976; Quinn & Deriso, Reference Quinn and Deriso1999; Henderson & Seaby, Reference Henderson and Seaby2006; Haddon, Reference Haddon2011). Among all the growth models, the von Bertalanffy model generally provides the best fit and adequately describes the growth of most fish species rarely follows a sigmoid or S-shaped curve (Fitzhugh, Reference Fitzhugh1976; Quinn & Deriso, Reference Quinn and Deriso1999; Henderson, Reference Henderson and Seaby2006; Haddon, Reference Haddon2011). Growth pattern of some fish species, such as black Scorpionfish, Scorpaena porcus (Demirhan & Can, Reference Demirhan and Can2009), sharptail mola, Masturus lanceolatus (Liu et al., Reference Liu, Lee, Joung and Chang2009), whitebrow skate, Bathyraja minispinosa (Ainsley et al., Reference Ainsley, Ebert and Cailliet2011), and Atlantic saury, Scomberesox saurus saurus (Agüera & Brophy, Reference Agüera and Brophy2012) are described by different growth models due to goodness of fit of the data, species body shape, growth properties, biological interpretation of parameters and comparison difficulties (Fitzhugh, Reference Fitzhugh1976).
Belone euxini is a long and slender fish species with a laterally compressed body shape. So the above mentioned growth models were applied to this species to obtain reliable and suitable growth parameters to calculate the mortality ratio. Moreover, the objective of the present study was to contribute information on the catch per unit effort, to provide new findings on age and growth of this species, and also to present some detailed estimation on the present rate of mortality, necessary for the introduction of suitable management plans for garfish small scale fisheries on the Anatolian coast of the Black Sea, and to assess the differences in these parameters in other populations in different geographical regions.
MATERIALS AND METHODS
Study area and sampling
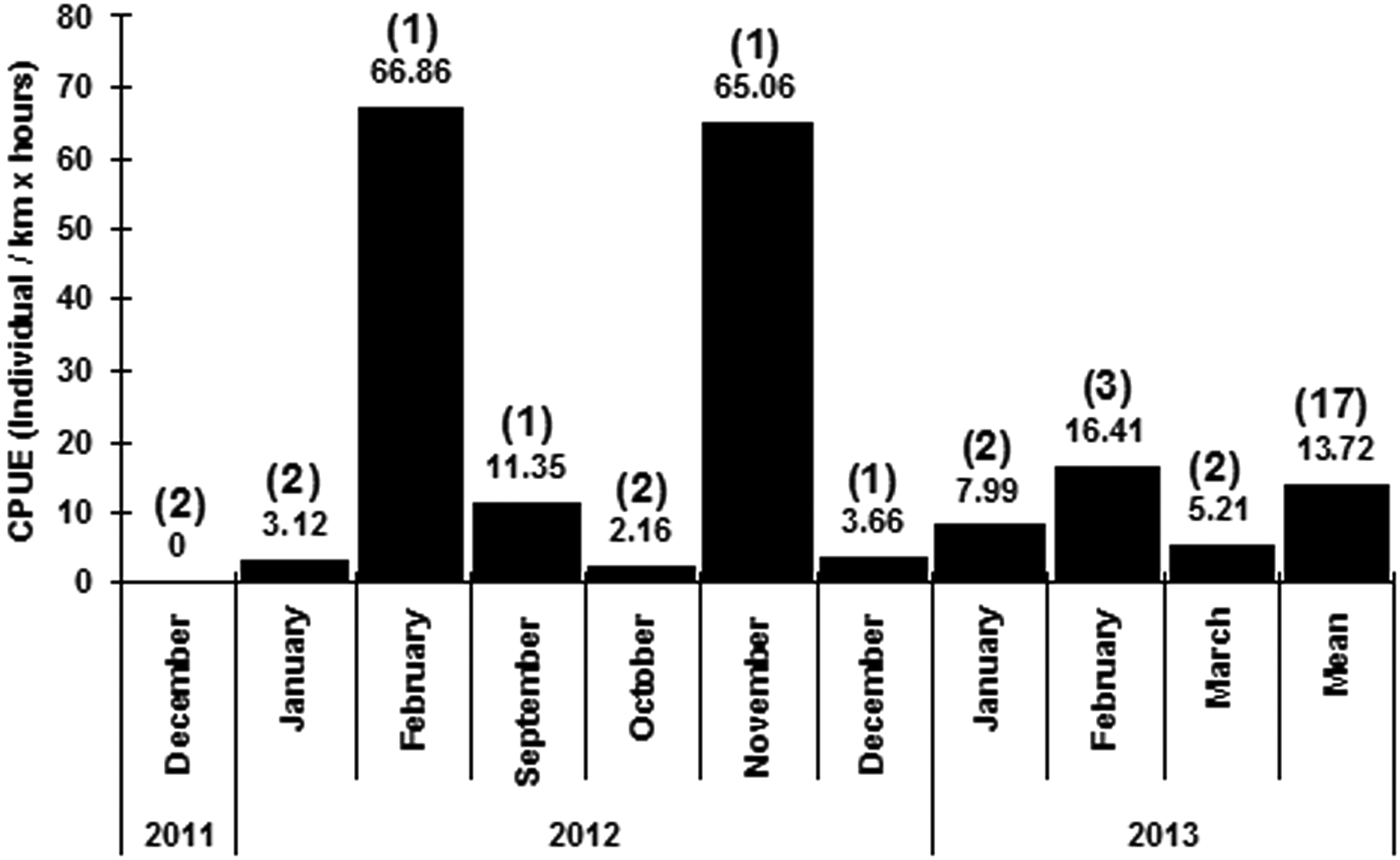
Samplings were conducted monthly between December 2011 and July 2013 except for August from the Rize coasts, in the south-east Black Sea (Figure 1). To calculate catch per unit effort, 17 samplings were conducted some months by garfish encircling nets with 21 mm mesh size during the study (2011: two samplings in December; 2012: two samplings in January and October, one sampling each in February, September, November and December; 2013: two samplings in January and March, three samplings in February). In other months, garfish specimens were obtained from garfish fishermen fishing with commercial garfish encircling nets with 21, 22 and 23 mm mesh sizes. In the warmer period (e.g. May, June and July) there is no garfish fishing due to the absence of schools in the study area (personal observations). Furthermore, because of the fact that the commercial garfish fishing was completely finished in the summer months in the study area, garfish specimens in May 2012 and May, June and July 2013 were obtained from fisheries for red mullet and whiting using bottom set trammel nets.
Study site off Rize coast, Black Sea. Shaded areas indicate the sampling sites.

Catch per unit effort (CPUE)
When a garfish school was seen, the garfish encircling nets were settled around the garfish school and than encircled garfish specimens were frightened and directed into the nets by entering into encircled nets with the fishing boat. Later garfish encircling nets were taken to the boat and the individual garfish specimens and time spent in searching and catching of garfish were recorded to calculate the catch per unit effort (CPUE; individuals/km × h) for garfish (Erkoyuncu, Reference Erkoyuncu1995):
 $${\rm CPUE=}\displaystyle{n \over {{\rm NL} \times t}}$$
where, n = number of caught fish, NL = length of garfish encircling nets (km), t = time spent in searching and catching of garfish (h).
A total of 1211 garfish specimens (618 female and 593 male) were taken to the laboratory and were measured (total length (TL)), weighed and sexed. The TL of each garfish was measured with a sensitivity of 1 mm. Specimens were weighed (wet weight) on a balance with a sensitivity of 0.001 g. Each pair of sagittal otoliths were also removed and stored in plastic Eppendorf tubes for aging.
Age determination
To obtain reliable results for reading sagittal otolith rings (hyaline and opaque zone), four different attempts were made on the sagittal otoliths of 50 fish of different length. Firstly, otoliths were cleaned with distilled water and ethanol 96% and read under the stereomicroscope. Secondly, the cleaned otoliths were placed in an oven for between 15 and 30 min at between 125 and 200°C. Afterwards the otoliths were cooled and rubbed with 96% ethanol and read under the stereomicroscope. Thirdly, the otoliths were cleaned with ethanol 96% and cut with a scalpel latitudinally, and burned with an alcohol flame and later read under the stereomicroscope. Finally, the otoliths were cleaned with distilled water, ethanol 96% and NaOH 4% (for 5–15 min) and read under the stereomicroscope. Thick otoliths were lightly abraded on sand paper for the growth rings to be clearly visible. False rings, hyaline and opaque zones of sagittal otoliths were the most visible and countable in the last attempt. The number of hyaline and opaque zones on the concave side of sagittal otoliths was counted using a Nikon SMZ1000 stereomicroscope at a magnification between ×0.8 and ×8.0, interfaced with a Nikon DSFI1 digital camera connected to a computer, using reflected light. We took into account the number of rings, the sampling date, the ring creation and the spawning period as between May and July (unpublished data). A total of 924 fish sagittal otoliths ring readings were successfully performed at two separate times.
Growth
SIZE–FREQUENCY
Monthly size–frequency distributions for both sexes were calculated as 2 cm total length-class intervals. Size–frequency distribution analysis for females and males was conducted using the Kolmogorov–Smirnov two-sample test. Comparison of the mean total length between female and male was performed using t-test. Statistical analyses were considered significantly different at the level of α = 0.05.
LENGTH–WEIGHT RELATIONSHIP
Least squares regression analysis with MS Excel software was used to calculate the length–weight relationship parameters. The length–weight relationship was estimated as:
 $$W=a\, {\rm T}{{\rm L}^b}$$
where W is the body weight (g), TL is the total length (cm), a is the intercept, and b is the slope of the regression line.
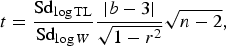
For comparison of the difference of slope value from b = 3 both female and male, Pauly's t-test was performed (Pauly, Reference Pauly1984). Pauly's t-test statistic was calculated as:
 $$t=\displaystyle{{{\rm S}{{\rm d}_{\log {\rm TL}}}} \over {{\rm S}{{\rm d}_{\log W}}}}\displaystyle{{{\rm \vert }b - 3{\rm \vert }} \over {\sqrt {1 - {r^2}} }}\sqrt {n - 2}\comma \;$$
where Sdlog TL is the standard deviation of the log TL values, Sdlog W is the standard deviation of the log W values, n is the number of garfish used in the computation. The value of b is different from b = 3 if t value is greater than the tabled t values for n − 2 degrees of freedom (Pauly, Reference Pauly1984).
The sex-ratio of the garfish was analysed using a χ2 test. A least significant difference (LSD) test was applied for comparison of total length and month for females and males.
GROWTH MODELS
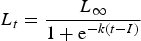
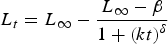
To obtain reliable estimates of garfish growth curve parameters, seven growth models (Gompertz, logistic or Richards curve, Janoschek, exponential, Morgan–Mercer–Flodin (MMF), von Bertalanffy and Weibull) were applied for females and males separately. The formulations of the models were as follows:
 ${L_t}={L_\infty }{{\rm e}^{{{\rm e}^{ - k\lpar t - I\rpar }}}}$: (Gompertz (Reference Gompertz1825, Reference Gompertz1832))
 ${L_t}=\displaystyle{{{L_\infty }} \over {1+{{\rm e}^{ - k\lpar t - I\rpar }}}}\,$: (logistic or Richards curve (Richards, Reference Richards1959))
 ${L_t}={L_\infty } - \lpar {L_\infty } - {\rm \beta }\rpar {{\rm e}^{\lpar - k{t^{\rm \delta }}\rpar }}$: (Janoschek (Reference Janoschek1957))
 ${L_t}={L_\infty } - \lpar {L_\infty } - {\rm \beta }\rpar {{\rm e}^{\lpar - \lpar kt\rpar \rpar }}$: exponential (Everhart et al., Reference Everhart, Eipper and Youngs1975)
 ${L_t}={L_\infty } - \displaystyle{{{L_\infty } - {\rm \beta }} \over {1+{{\lpar kt\rpar }^{\rm \delta }}}}$: (Morgan–Mercer–Flodin (MMF) (Morgan et al., Reference Morgan, Mercer and Flodin1975))
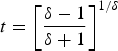 $t={\left[{\displaystyle{{{\rm \delta } - 1} \over {{\rm \delta }+1}}} \right]^{1/{\rm \delta }}}$: (the point of inflection of MMM equation)
 ${L_t}={L_\infty }\lpar 1 - {{\rm e}^{ - K\lpar t - {t_0}\rpar }}\rpar $: (von Bertalanffy (Reference Von Bertalanffy1938))
 ${L_t}={L_\infty } - \lpar {L_\infty } - {\rm \beta }\rpar {{\rm e}^{\lpar - {{\lpar kt\rpar }^{\rm \delta }}\rpar }}$: (Weibull (Reference Weibull1951))
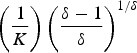 $\left({\displaystyle{1 \over K}} \right){\left({\displaystyle{{{\rm \delta } - 1} \over {\rm \delta }}} \right)^{1/{\rm \delta }}}$: (the point of inflection of MMM equation of Weibull)
where, t is time (age), L t is length at age t, L ∞ is the upper asymptotic total length to which the garfish grows (cm), K = the growth rate parameter (yr−1), t 0 is the nominal age at which the length is zero, I is the age at the inflection point (as I increases in magnitude, the curve moves to the right), β is the lower asymptotic total length (cm), δ is a parameter that controls the x-ordinate (time, age) for the point of inflection.
Analysis of growth models parameters were fitted to age length data using the Growth-II (Pisces Conservation Ltd, Lymington, UK) procedure in the PC-based computer package (Henderson & Seaby, Reference Henderson and Seaby2006). Growth-II is designed by Henderson & Seaby (Reference Henderson and Seaby2006) to fit a variety of common growth curves to data. Growth-II offers a measure of the suitability of a model as a fit for data. The Akaike information criterion (AIC) (Akaike, Reference Akaike1974) is a measure to help in the selection between candidate models. Using this criterion, the best model is the one with the lowest AIC results. This criterion takes into account both the closeness of fit of the points to the model and the number of parameters used by the model (Henderson & Seaby, Reference Henderson and Seaby2006). AIC was calculated as:
 $${\rm AIC}=N\log \lpar {\rm WSS}\rpar +2M\comma \;$$
where N is the number of data points, WSS is the weighted sum of squares of residuals, and M is the number of model parameters. WSS was calculated as:
 $${\rm WSS}=\sum\limits_{i=1}^{i=n} {\displaystyle{1 \over {{\rm SD}_i^2 }}} {\lpar {Y_{{\rm obs}\comma i}} - {Y_{{\rm calculated}\comma i}}\rpar ^2}\comma \;$$
where SD = standard deviations was estimated for the mean size at age.
Growth performance comparisons were made using the growth performance index (Φ′) which is preferred rather than using L ∞ and K individually (Pauly & Munro, Reference Pauly and Munro1984) and was computed as:
 $$\Phi {\rm ^{\prime}}={\rm log}\lpar K\rpar + 2\, {\rm log\lpar }{L_\infty }\rpar .$$
Mortality
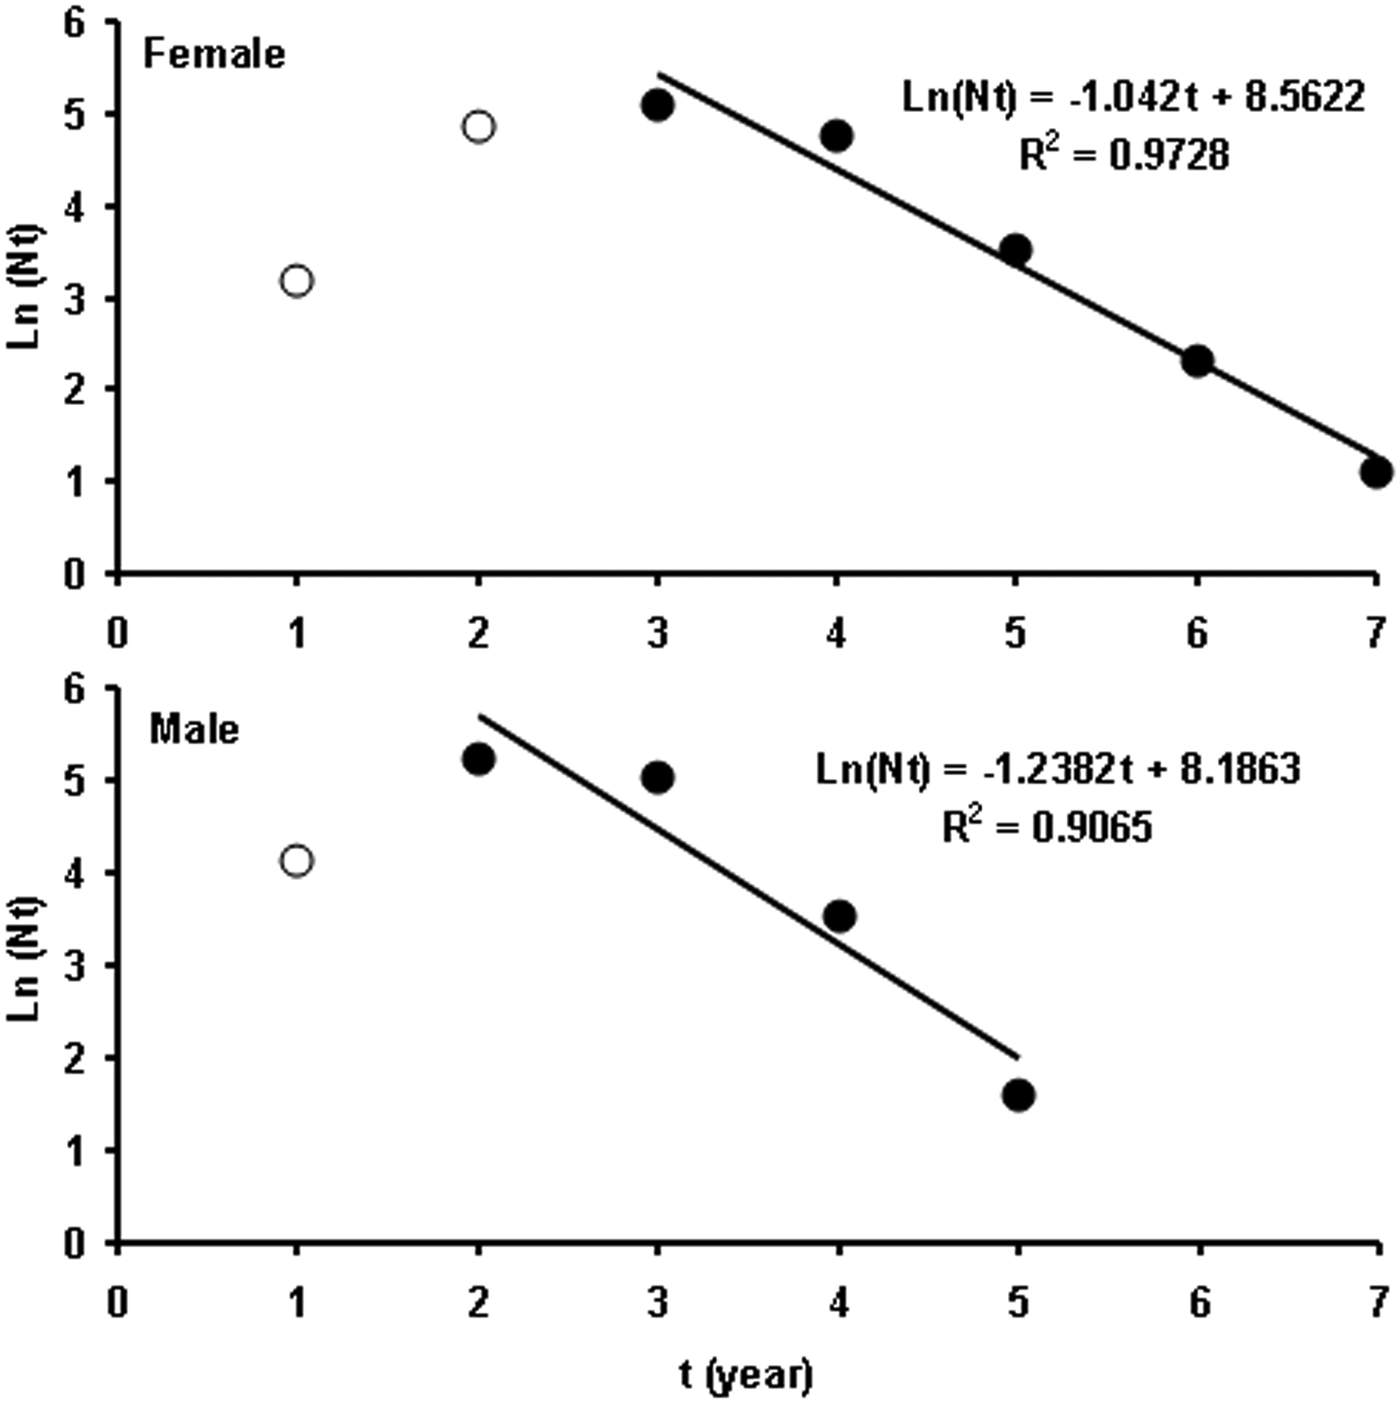
Total instantaneous mortality rate, Z, was estimated using the catch curve method for both sexes (Pauly, Reference Pauly1984). Catch curve analysis assumes that the decrease in observed numbers of individuals across the age structure of the population is the result only of mortality. The calculated Z is the slope (b) of the fitted regression line plotted to log-transformed numbers at age t. Catch curve (Pauly, Reference Pauly1984) was used to estimate Z as:
 $$\ln \lpar {N_t}\rpar =a+bt$$
where N t is the frequency in age-class t, t is the age, a is the intercept and b is the slope corresponding to Z with the sign changed. The Z values were estimated from the right side of the linearized catch curve based on age composition without extreme age groups are not fully recruited. Moreover, male' age 6 was only one individual indicated that natural logarithm of the number of fish in age group 6 was equal to zero, and so between 2 and 5 age groups were used for Z estimation for male.
Garfish growth pattern was analysed by seven mathematical growth models to obtain the most accurate L ∞ and K parameters and then to calculate the M rate which required L ∞ and K as input of growth model. To obtain reliable estimates of the instantaneous natural mortality rate, M, four empirical equations of Pauly (Reference Pauly1980), Djabali et al. (Reference Djabali, Mehailia, Koudil and Brahmi1993), Alagaraja (Reference Alagaraja1984) and Srinath (Reference Srinath1998) were applied:
 $\log {M} = 0.8\lpar \!- 0.0066 - 0.279\log {\rm T}{{\rm L}_\infty }+0.6543\log K +0.4634\log T \rpar$ (Pauly, Reference Pauly1980)
 $\log M =0.8\lpar \!- 0.736 - 0.114\log {\rm T}{{\rm L}_\infty }+0.522\log K +0.583\log T\rpar $ (Djabali et al., Reference Djabali, Mehailia, Koudil and Brahmi1993)
 $M=1.680\, K$ (Srinath, Reference Srinath1998)
 $M=1.535\, K$ (Alagaraja, Reference Alagaraja1984)
where T is the mean annual surface water temperature (T) of 15°C at the study area (Bat et al., Reference Bat, Şahin, Satılmış, Üstün, Birinci Özdemir, Kıdeys and Shulman2007), K = the growth rate parameter (yr−1) and TL∞ is the asymptotic total length (cm) to which the garfish grow. This empirical equation assumes that the length is measured as total length (TL) in cm (Gayanilo et al., Reference Gayanilo, Sparre and Pauly2005).
Fishing mortality rate, F, estimated by subtracting instantaneous natural mortality, M, rates (obtained from empirical equations of Pauly (Reference Pauly1980), Djabali et al. (Reference Djabali, Mehailia, Koudil and Brahmi1993), Alagaraja (Reference Alagaraja1984) and Srinath (Reference Srinath1998)) from the total instantaneous mortality rate (Z). Fishing mortality rate, F, was estimated as:
 $$F=Z-M.$$
The rate of exploitation, E, was estimated from Ricker (Reference Ricker1975) as:
 $$E=F/Z.$$
Fishing mortality rate, instantaneous natural mortality rate and exploitation rate were calculated according to input parameters (e.g. L ∞ and K) of seven growth models parameters for females and males, separately.
RESULTS
Population structure
From the 17 fishing surveys a total of 1828 individual garfish weighing a total of 89.4 kg were caught by garfish encircling nets. Garfish specimens were not obtained in two surveys in December 2011. Monthly CPUE values showed that garfish are fished only in winter and autumn seasons. Mean CPUE (individuals/km × h) value was calculated as 13.7 ± 8.1 with a peak of 66.9 and 65.1 in February and November, respectively (Figure 2). It was recognized that garfish catch falls to the lowest levels in spring, especially after May, and was completely finished by the summer months in the study area.
Monthly catch per unit efforts (CPUE) of Belone euxini off Rize coast, Black Sea. The number in parentheses is the number of sampling.
Length structure
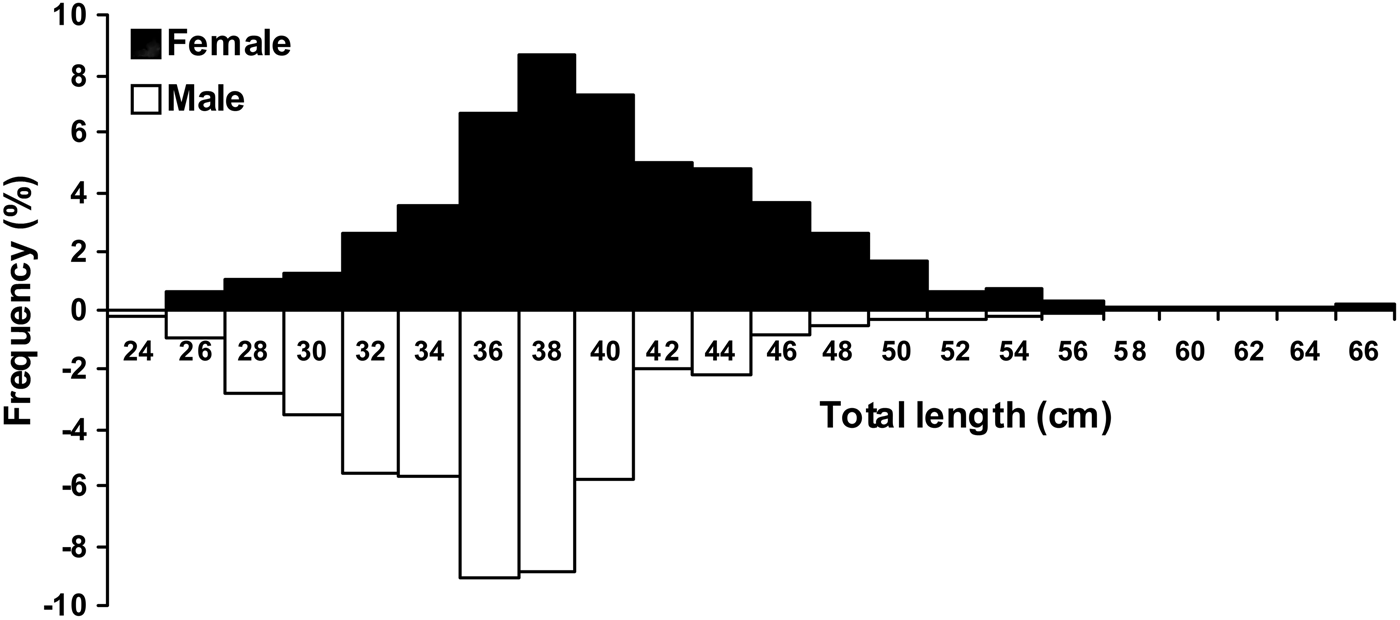
A total of 1211 garfish (618 female, 593 male) were examined between January 2012 and July 2013. The total length of females ranged between 24.7 and 65.1 cm (mean 39.10 ± 0.248 cm) and the total length of males ranged between 22.2 and 55.3 cm (mean 35.2 ± 0.209 cm). The mean total length of females was significantly (t-test: P = 9.41 × 10⁻³¹) greater than the mean total length of males. Size–frequency distributions were also significantly different (Kolmogorov–Smirnov two-sample test: d = 0.29178, P = 3.95 × 10⁻²³) between females and males. Looking at the overall size–frequency distribution (Figure 3), the dominant length interval was found to be 36–44 cm for females (32.3%) and 32–40 cm for males (35.0%).
Length–frequency distribution (%) of females and males of Belone euxini between February 2002 and January 2004.
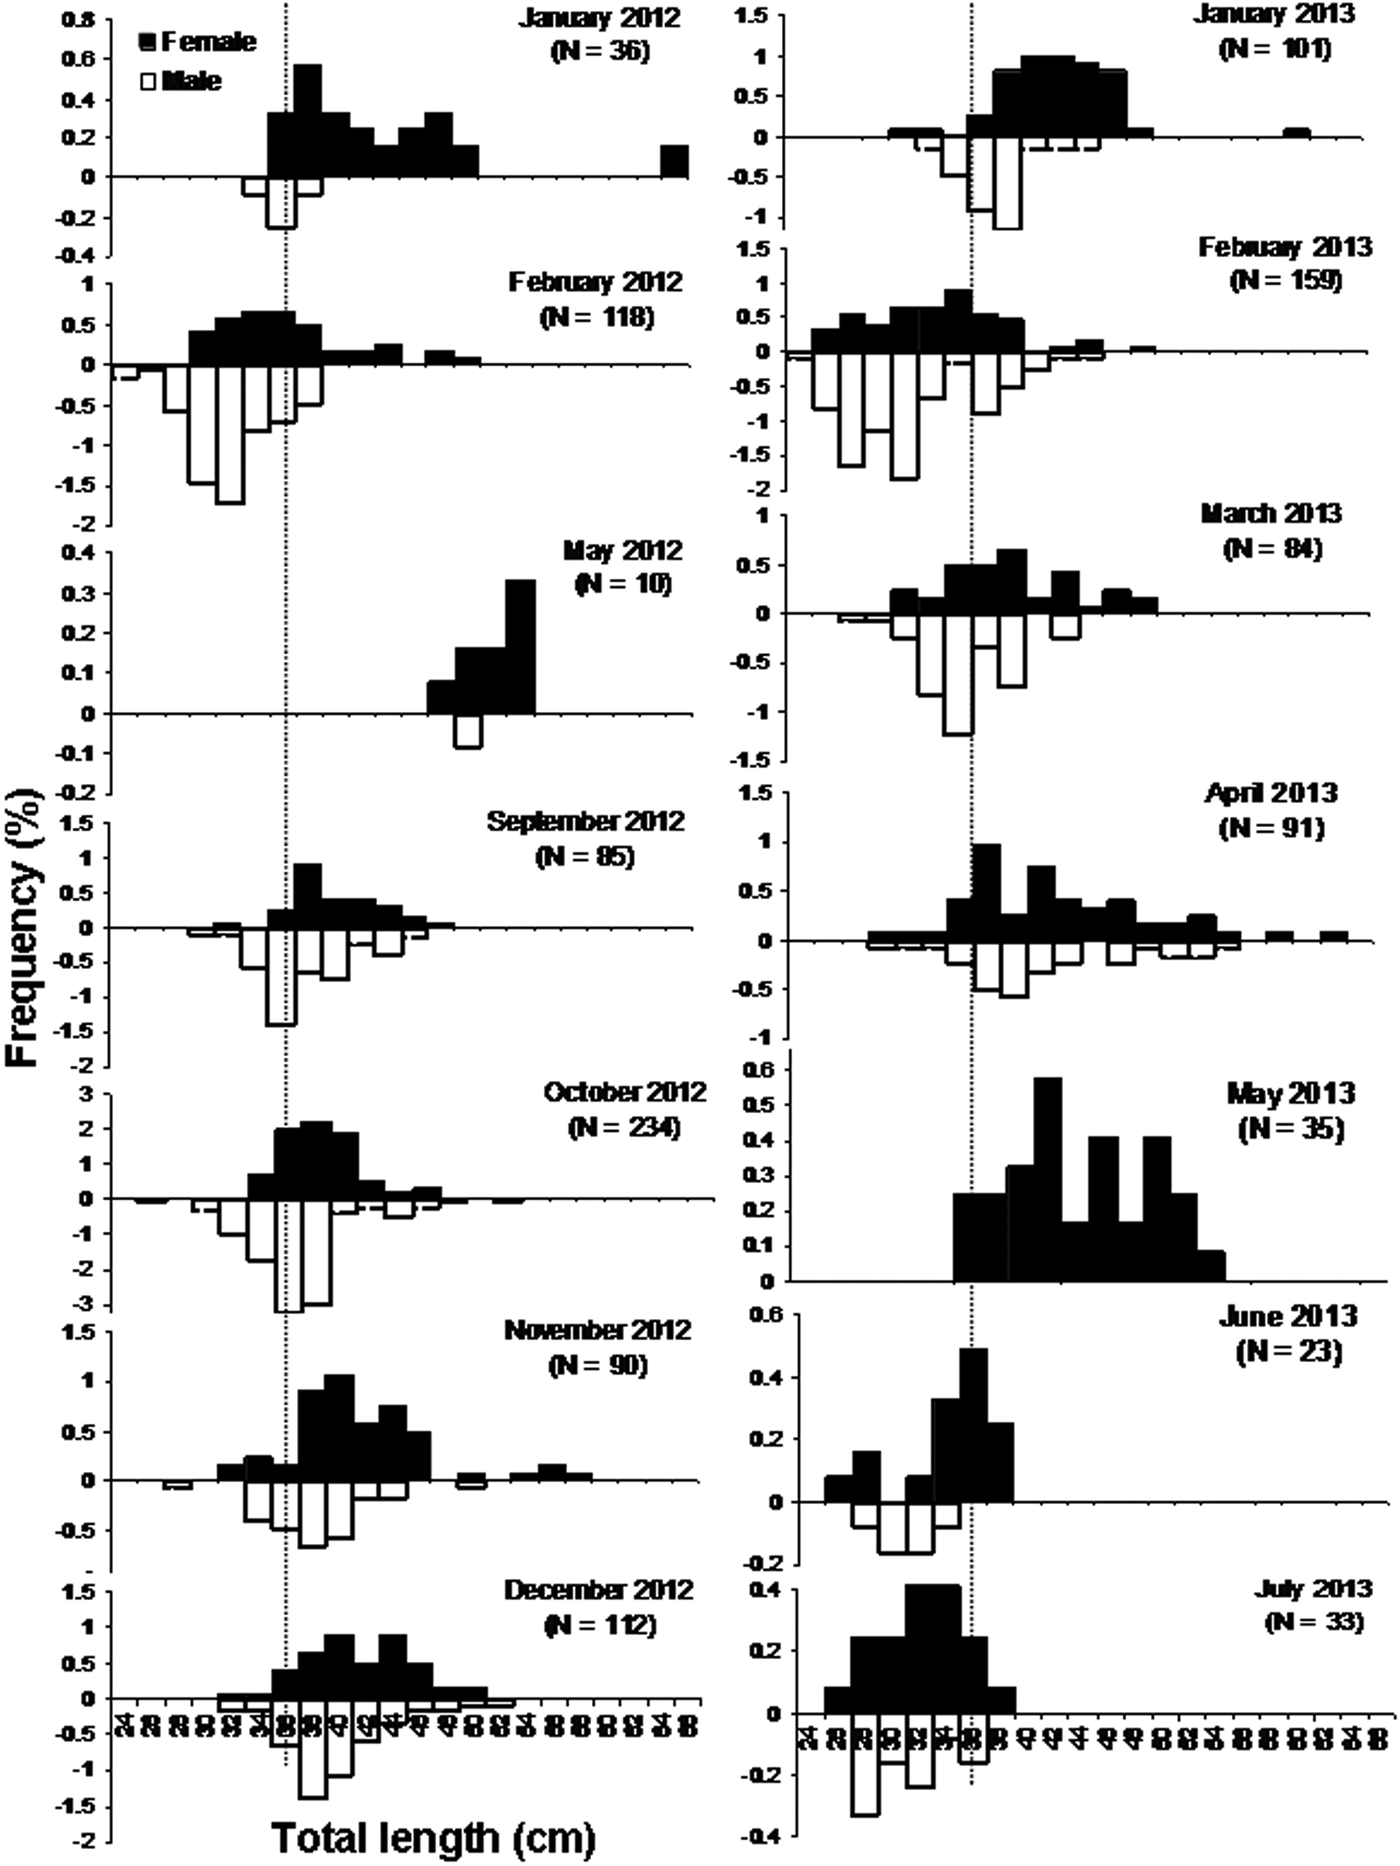
Monthly distribution of the total length of collected garfish females and males is illustrated in Figure 4. Monthly length frequency distribution shows that the amount of the garfish under the size of sexual maturity calculated from our available data (unpublished data: 33.3 cm TL for males and 34.4 cm for females) was found to be important (about 25%), especially for those fish captured in two periods, firstly between February and March and secondly between June and July, indicating groups of small individuals were to be found in the study areas (Figure 4).
Monthly length–frequency distribution (%) of female and male of Belone euxini between January 2012 and July 2013. Dotted line at 35 cm drawn to illustrate recruitment of immature and small individuals to the population.
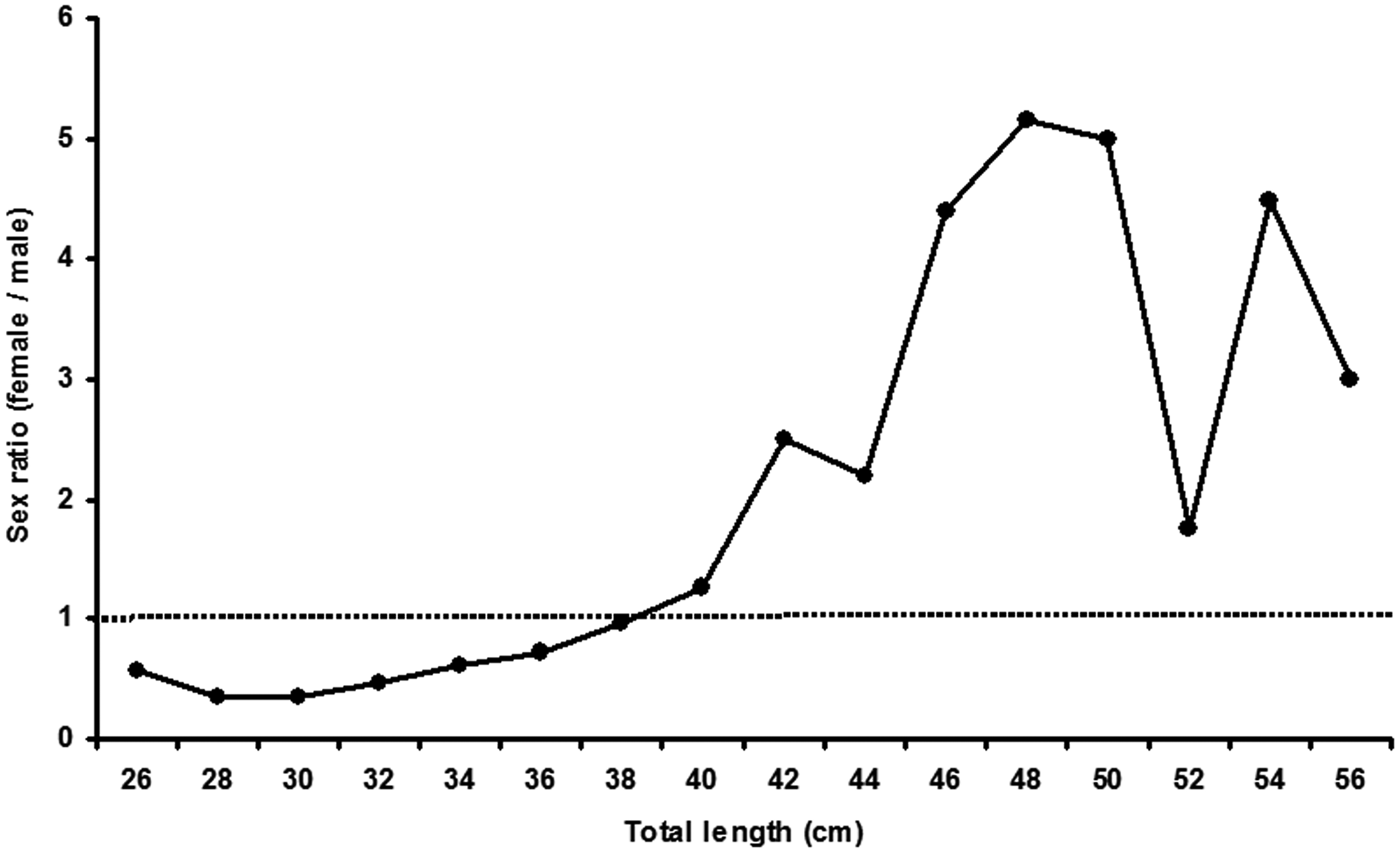
The fluctuation of the sex-ratio of females:males with size is shown in Figure 5. The overall female:male ratio (1.04) of garfish is skewed towards females (χ2 = 603.6755, P < 0.001). Moreover, female:male ratio (0.67) with size was towards males up to 38 cm length-class (χ2 = 457.1833, P < 0.001). In individuals greater than 38 cm, the female:male ratio (3.08) was this time skewed towards females (χ2 = 191.6688, P < 0.001). Moreover, monthly sex-ratio of females:males was found to be biased towards females, except in February (0.59; χ2 = 61.630), September (0.60; χ2 = 43.895), October (0.77; χ2 = 117.383), December (0.90; χ2 = 54.379) 2012 and February (0.61; χ2 = 83.076) and March (0.83; χ2 = 40.745) 2013.
Sex-ratio (female:male) fluctuation of Belone euxini. Dotted line at 1 drawn to illustrate 1:1 sex-ratio.
Length–weight relationship
The length–weight relationships for female and male were estimated as follows:
Female: W = 0.0005TL3.1802 (r 2 = 0.9208, n = 618, Sdlog TL = 0.0678, Sdlog W = 0.2248, P < 0.05)
Male: W = 0.0007TL3.0904 (r 2 = 0.8967, n = 593, Sdlog TL = 0.0628, Sdlog W = 0.2048, P < 0.05)
The slope of the length–weight relationship regression lines for females (Pauly's t test = 4.794) and males (Pauly's t test = 2.095) were significantly different from the isometric growth curve slope (P < 0.05). These results show that both females and males have positive allometric growth characteristics.
Age composition
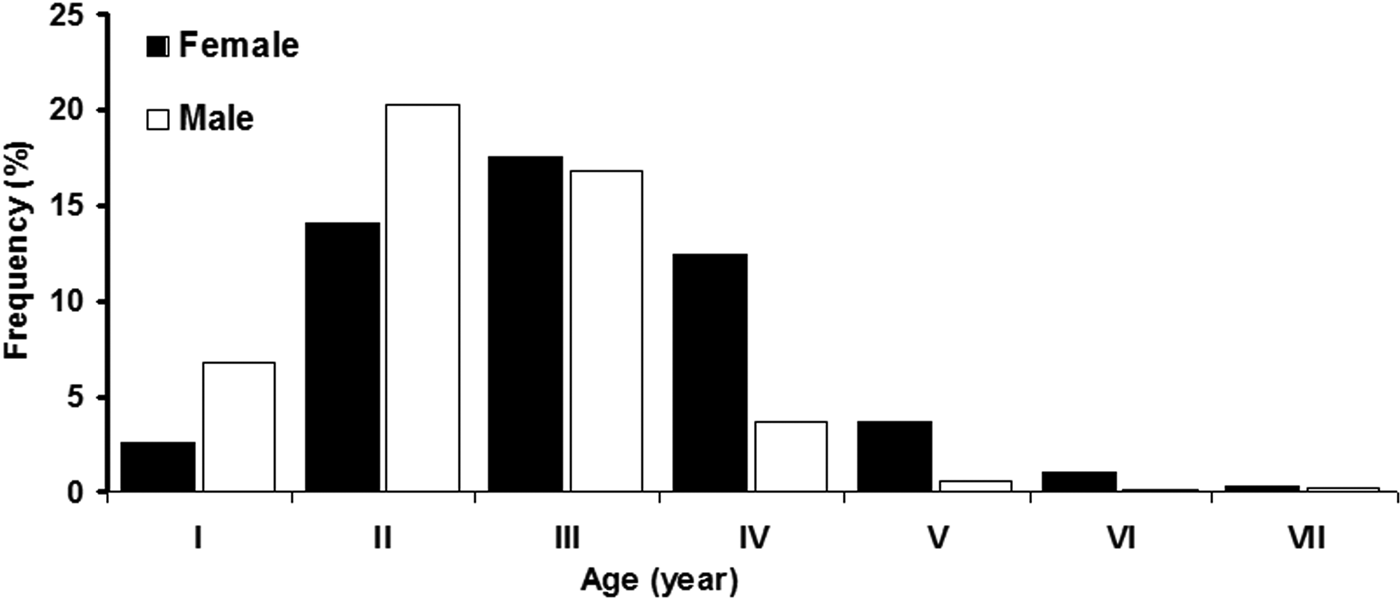
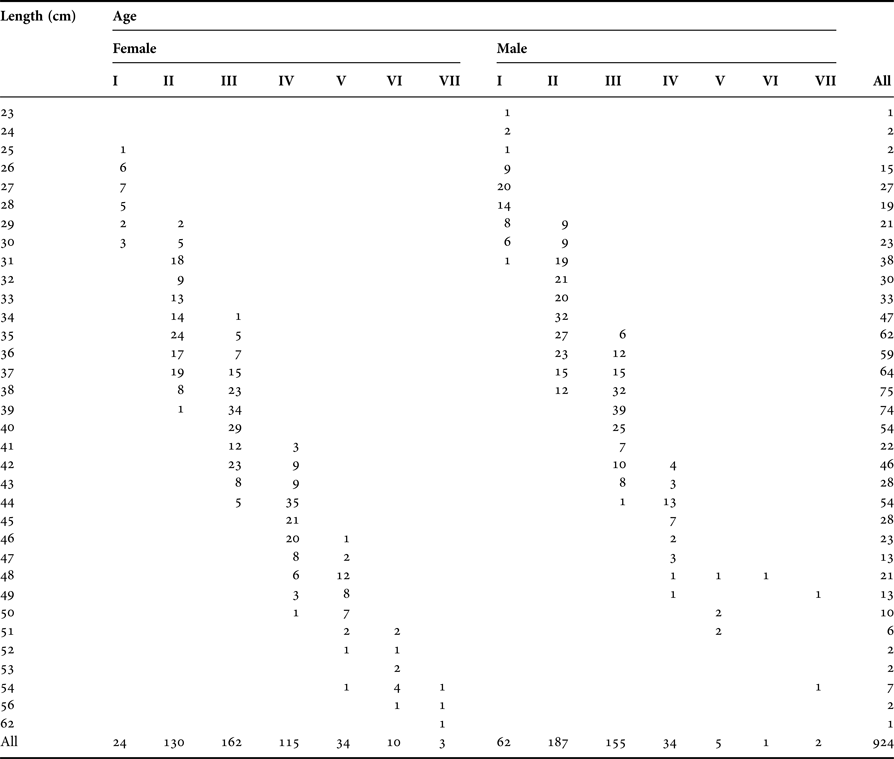
Of the 1211 total garfish specimens, 287 specimens were discarded due to deformation and amorphous structure of otoliths and unclear age reading. Successful age determination was achieved on a total of 924 garfish otoliths (478 female and 446 male). The age–length key for both sexes is shown in Table 1. Total lengths of aged specimens ranged from 24.7 to 61.1 cm (mean: 39.3 ± 0.28 cm) for females and from 22.2 to 53.4 cm (mean: 35.4 ± 0.25 cm) for males. The age range estimated was up to 7 yr for both females and males. The dominant age group was 3 yr for females (17.5%) and 2 yr for males (20.2%). Aged specimens of both sexes showed an approximately 85% ratio between 2 and 4 yr age groups for both females (44.1%) and males (40.7%) (Figure 6).
Age–frequency distribution (%) of female and male Belone euxini.
Age–length key of both female and male of Belone euxini, in the Black Sea.
Growth models
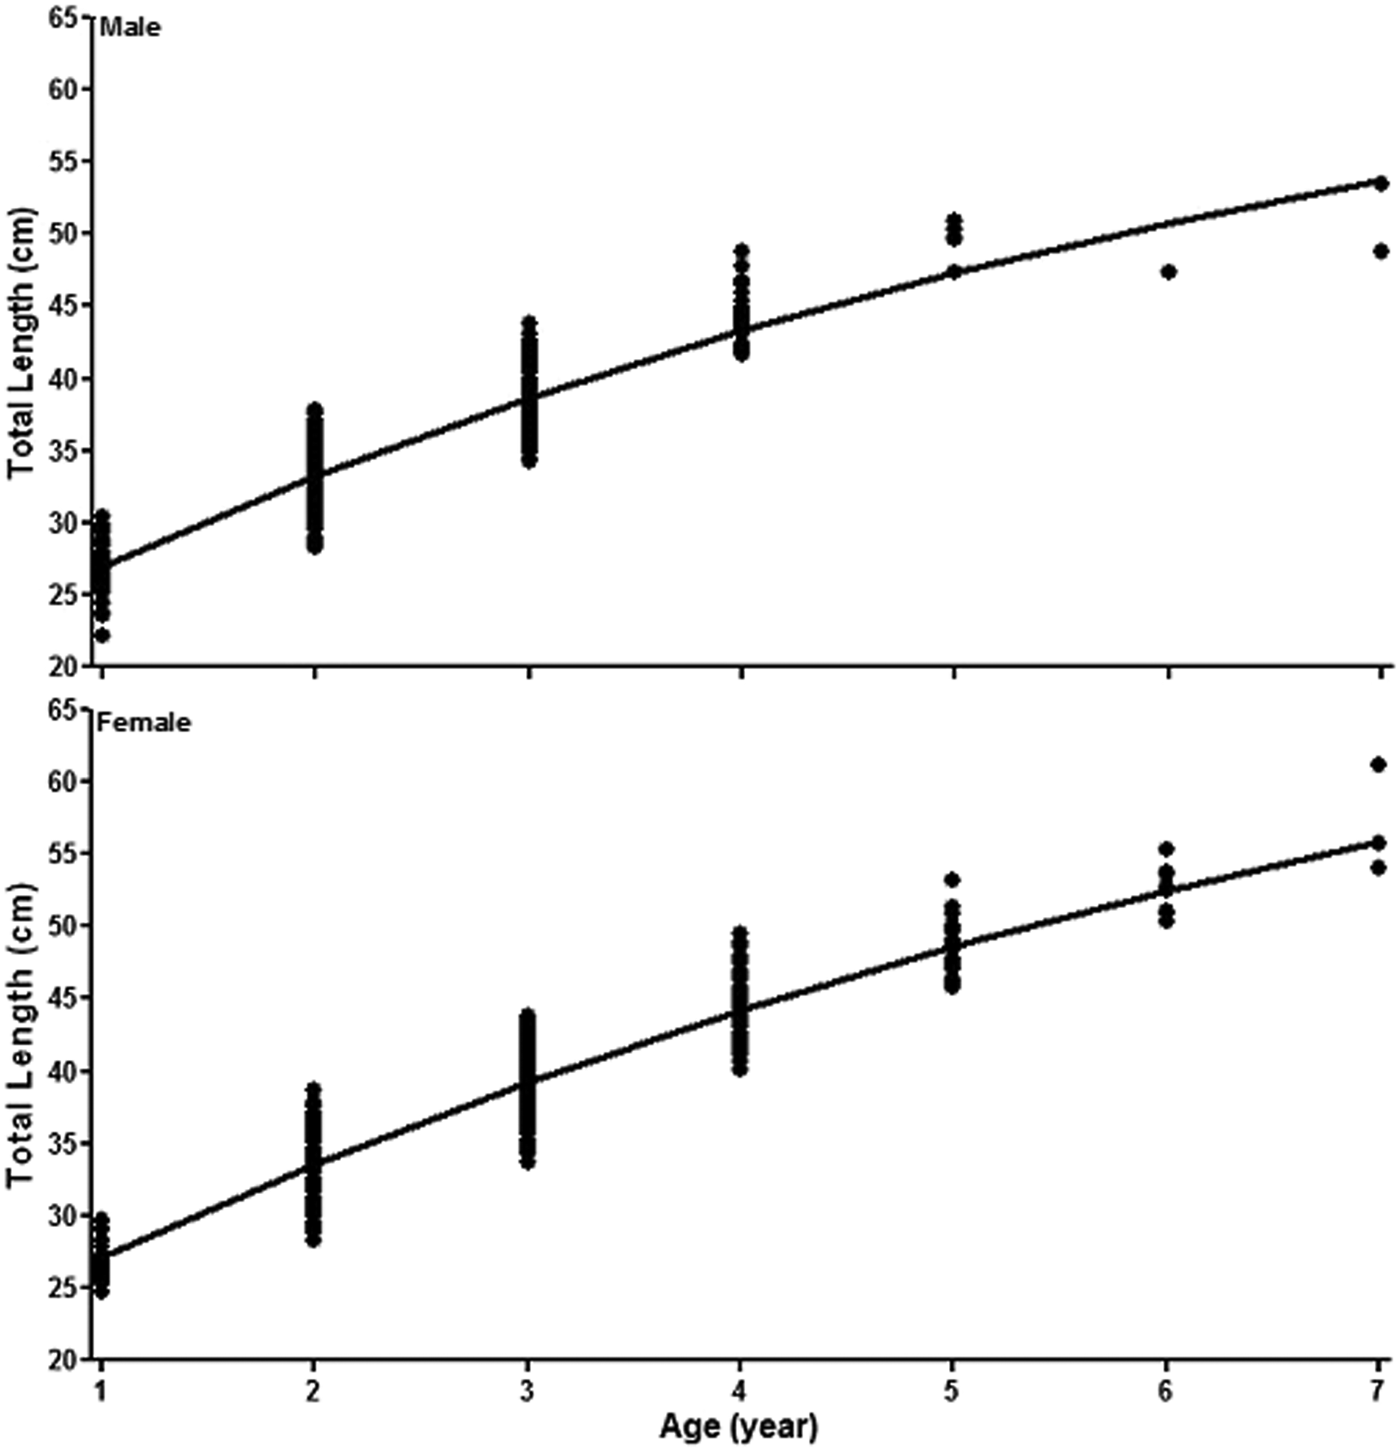
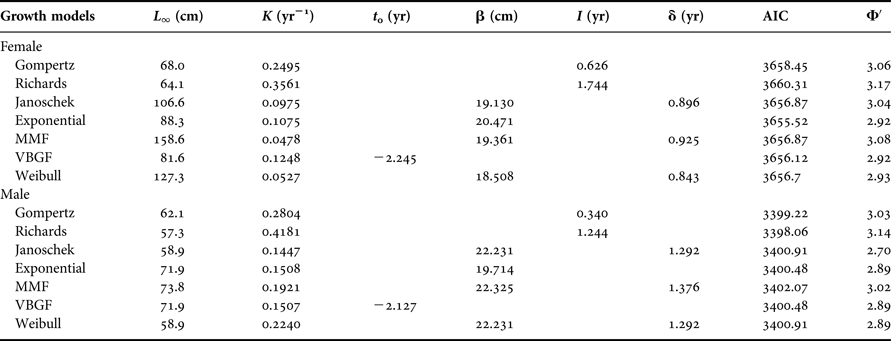
Growth parameters estimated by different models for females and males are shown in Table 2. According to the AIC, the exponential and von Bertalanffy curve attained a better fit of the data than the other models in females, and these models are considered as the most suitable growth models for females (Figure 7). On the other hand, the results of the growth model AIC values for males were fairly similar to each other, and a ‘best’ model was not selected.
The von Bertalanffy growth curves for female and male Belone euxini.
Results of growth models parameters, Akaike information criterion (AIC) and growth performance index. L ∞=the upper asymptote, K = the growth rate, t 0 = the time when L = 0, b = lower asymptote (the size at t = 0), I = the age at the inflection point, b = lower asymptote (the size at t = 0), δ = a parameter that controls the point of inflection (as d decreases in magnitude, the point of inflection moves to the right and the curve becomes less steep), Φ′ = growth performance index.
According to the growth models the asymptotic length (L ∞) of females was estimated higher than males, and the L ∞ varied between 64.1 and 158.6 cm for females and between 57.3 and 73.8 cm for males. The L ∞ values of females were also estimated to be higher than male except by the Richards model. Moreover, the growth rate (K) of males derived from different models was estimated higher than females. The K values ranged between 0.0478 and 0.3561 yr−1 for females and between 0.1447 and 0.4181 yr−1 for males.
The age at inflection point of the growth curve (I) was estimated as 1.7 yr by the Richards model and 0.6 yr by the Gompertz model for females. For males, I was estimated as 1.2 yr by the Richards model and 0.3 yr by the Gompertz model. Therefore, the parameter that controls the point of the growth curve (δ) was estimated as 0.8 yr by the Weibull model and 0.9 yr by both the Janoschek and Morgan–Mercer–Flodin models for females. For males δ was estimated as 1.4 yr by the Morgan–Mercer–Flodin model and 1.3 yr by both the Janoschek and Weibull models. Besides all these, exponential and von Bertalanffy growth models selected more biologically suitable models to characterize growth of both sexes of garfish.
Growth performance index, Φ′, derived from seven growth methods was ranged between 2.92 and 3.17 and had a mean of 3.02 ± 0.04 for females. For males Φ′ ranged between 2.70 and 3.14 and had a mean of 2.94 ± 0.05.
Mortality
The linearized catch curve based on age composition data showed a recruitment age for the garfish fishery of 3 yr for females and 2 yr for males. Males age 1 and females age 1 and 2 were excluded from the regression line as they were not fully recruited (Figure 8). From this regression, Z was estimated as 1.04 yr−1 for females and 1.24 yr−1 for males.
Linearized catch curve based on age composition showing the recruitment age for female at 3 yr old and for male at 2 yr old and obtained regression equation.
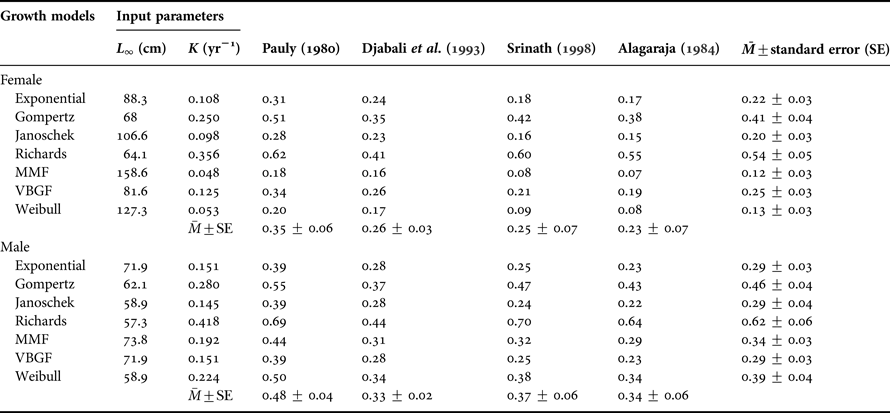
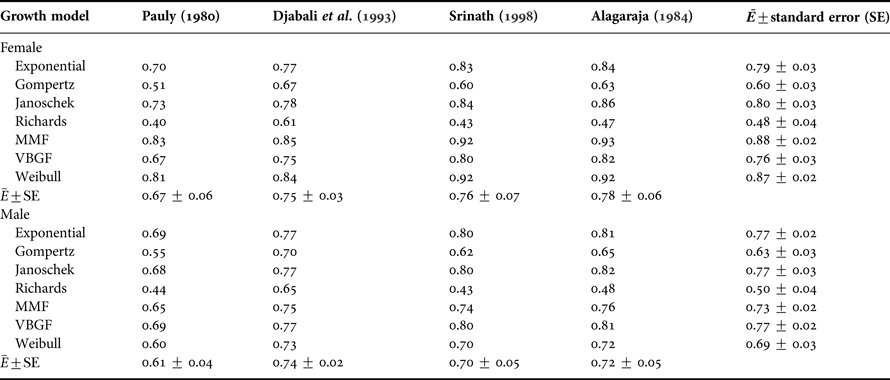
Estimated mean instantaneous natural mortality ratio was higher for males than for females obtained by four empirical equations of Pauly (Reference Pauly1980), Djabali et al. (Reference Djabali, Mehailia, Koudil and Brahmi1993), Alagaraja (Reference Alagaraja1984) and Srinath (Reference Srinath1998), which required L ∞ and K as input for seven growth modes (Table 3). Moreover, mean exploitation ratio, which required F and Z as input derived from each empirical natural mortality ratio which calculated input parameters of seven growth models, was lower for males than for females (Table 4). The exploitation rate of the both sexes was also higher than the optimum exploitation (E = 0.5) criterion (Gulland, Reference Gulland1971), which is indicative of overfishing in the garfish population.
Four empirical instantaneous natural mortality ratio, M, results obtained from results of different growth models input parameters for female and male.
Exploration ratio, E, results obtained from results of seven growth models and four empirical natural mortality rates for female and male.
DISCUSSION
Population structure
There are seasonal fluctuations in abundance in the B. euxini population in the south-east Black Sea coastal area. The highest catches occurred in the autumn (November) and winter (February). Garfish abundance decreased to its lowest levels in the spring months, especially after May, and it was completely finished by the summer months, which is similar to the observations of Dorman (Reference Dorman1989). This is also a general characteristic of garfish small scale fisheries in the Black Sea (personal observation).
Length composition
Our data showed a larger length range than previous studies conducted in the Black Sea (Samsun et al., Reference Samsun, Özdamar and Erkoyuncu1995, Reference Samsun, Samsun, Bilgin and Kalaycı2006; Samsun, Reference Samsun1996), Aegean Sea (Uçkun et al., Reference Uçkun, Akalin and Toğulga2004) and Mediterranean (Fehri-Bedoui & Gharbi, Reference Fehri-Bedoui and Gharbi2004; Ghailen et al., Reference Ghailen, Abdallah, Hassan, Mourad, Abderrahmen and Othman2010) but the length range was lower than the Adriatic Sea (Dulčić & Soldo, Reference Dulčić and Soldo2006; Zorica & Keč, Reference Zorica and Keč2013). While the largest individual of B. euxini determined in the present study was 65.1 cm total length in the Black Sea, 103.5 cm is the greatest length ever reported to date (Dulčić & Soldo, Reference Dulčić and Soldo2006), and 75.4 cm (Zorica & Keč, Reference Zorica and Keč2013) for B. belone in the Adriatic Sea. The differences of length composition between various geographical regions and within regions may be due to different strength of the year-class, different mortality rates and growth. Warm and calm seawater conditions in summer months, protection from predators and quality and quantity of the amount of prey of garfish (e.g. Dorman (Reference Dorman1988) reported that postlarval garfish feed on small neustonic organisms, particularly copepods and crustaceans, especially crab larvae, and juvenile fish, mostly clupeids were also dominant in the diet of adults) affects positively the survival of juveniles and hence the strength of the garfish year class and growth should be effected (Dorman, Reference Dorman1989).
Monthly length–frequency distribution shows that small and under the size at sexual maturity individuals at ages 1 and 2 yr mostly appeared in samplings in February 2012, February and March 2013 and June and July 2013, which may imply hatching in June or July 2010, 2011, 2012, respectively. Gürcan (Reference Gürcan2012) reported 10 mm total length garfish larvae as being first found in June 2012 off the Sinop coast in the Black Sea. Dorman (Reference Dorman1989) also reported that garfish spawning occurred in June, and juveniles reached about 34 mm total length one month later, and by the end of August young garfish reached about 15 cm total length in the Courtmacsherry Bay. This rapid growth rate of garfish continues into the second year, but slows in the third, associated with the size at sexual maturity (Dorman, Reference Dorman1989).
Sex-ratio
Sex-ratio and size of B. euxini implies that males are dominant at lower size up to 38 cm total length-classes, while sex-ratio was towards female after 38 cm total length. Similar difference in sex-ratio and size was reported for B. belone in the eastern part of the middle Adriatic Sea (Zorica et al., Reference Zorica, Sinovčić and Keč2011) and from Strömstad on the west coast to Västervick in the Baltic Sea (Dorman, Reference Dorman1991). The sex-ratio and changed size of B. euxini is the same with B. belone reported from the Adriatic Sea. We agree with the exploration of Zorica et al. (Reference Zorica, Sinovčić and Keč2011) on the probable reasons of garfish sex ratio fluctuation at size, e.g. sexual dimorphism in size, gear selectivity, sampling strategies and spawning migrations. Moreover, monthly fluctuation of sex-ratio of B. euxini may be complicated by differential sex mortality rates and migration patterns. Namely, garfish migrate into the coastal area depending on water temperature in summer months for the purpose of spawning (Dorman, Reference Dorman1989; Zorica & Keč, Reference Zorica and Keč2013).
Age and growth
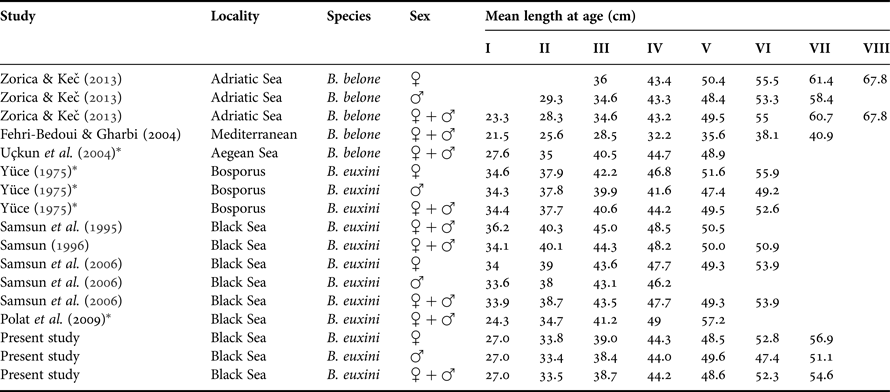
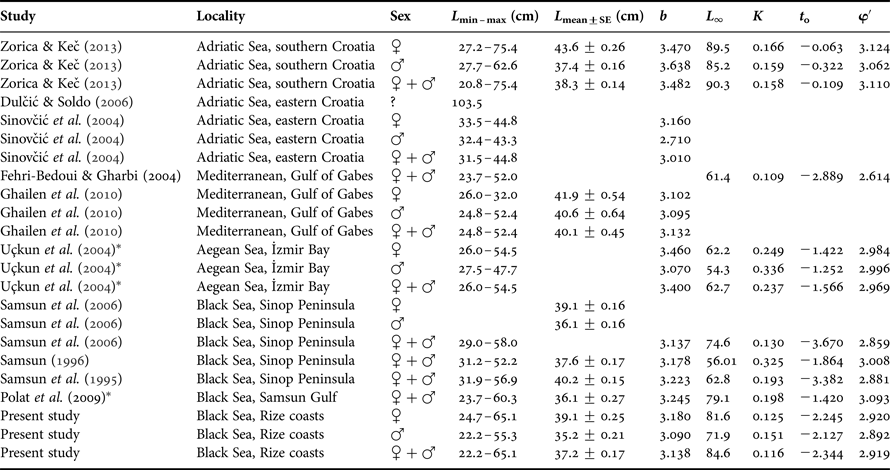
Comparisons of mean length at age of garfish obtained from previous studies are shown in Table 5. Zero year old of garfish have not been reported so far, so it is not known what length is attained in the early stages of life (Table 5). This may be most probably due to fishing gears selectivity. Belone euxini specimens attained age very fast in the first year, being approximately 50% of their ultimate total length, and a similar fast growth property was obtained from early study for garfish populations in the Black Sea (Polat et al., Reference Polat, İnceismail, Yılmaz and Bostancı2009), although this growth property for B. belone was relatively lower (about 35%) in the Adriatic Sea (Zorica & Keč, Reference Zorica and Keč2013).
Comparison of mean total length at age of garfish species obtained from other populations of the different geographical localities.
*, studies measured size as fork length.
Fisheries assessments are generally based upon mathematical models of the production processes and the populations being fished (Haddon, Reference Haddon2011). Mean total length and length–frequency distribution between females and males are statistically different, and so growth parameters were estimated for both sexes separately. The AIC value is a useable tool to choose a growth model among candidate growth models which is best supported by the data (Henderson & Seaby, Reference Henderson and Seaby2006). Moreover, to obtain biologically sensible interpretations concerning how a fish grows from a model, then model selection cannot solely depend upon the quality of statistical fit of the data. The suitable growth model selection should be also based on the fish biology and reflect the theoretical viewpoint of growth (Haddon, Reference Haddon2011). Our results showed that non-linear von Bertalanffy and exponential growth models attained better fit for females, and Richards, von Bertalanffy and Gompertz models were a better fit for males than the other models (see Table 2). So, the von Bertalanffy model was believed to be more biologically realistic to characterize the B. euxini growth pattern. This model fitted well, and estimated L ∞ was reasonable and gave the best results with the lowest AIC value and biologically reasonable growth parameters among the applied growth models.
Growth of some fish species from different geographical areas is described by different growth models due most probably to the goodness of fit length at age data, growth properties of species, biological interpretation of growth parameters and so on. Sharptail mola, Masturus lanceolatus growth model was calculated using three growth mpdels; von Bertalanffy, Gompertz and Robertson were used to model the observed length at age data and the von Bertalanffy was suggested as the better model to describe growth of this fish species (Liu et al., Reference Liu, Lee, Joung and Chang2009). Whitebrow skate Bathyraja minispinosa and Atlantic saury Scomberesox saurus saurus growth functions were calculated to be better described by the Gompertz model than by the von Bertalanffy model (Ainsley et al., Reference Ainsley, Ebert and Cailliet2011; Agüera & Brophy, Reference Agüera and Brophy2012). Moreover, three growth models; the von Bertalanffy, the logistic and the Schnute and Richards models were applied to estimate black Scorpionfish, Scorpaena porcus growth, and the von Bertalanffy growth curve did not reach an asymptote within the observed range of data, and the L ∞ estimate appeared to be an overestimate. Although the logistic model fitted well and estimated L ∞ was reasonable, the Schnute and Richards models approach gave the best results with the lowest residual sum of squares and biologically reasonable growth parameters among the applied growth models (Demirhan & Can, Reference Demirhan and Can2009).
In the present study, female garfish reach a larger size then males. Namely, the asymptotic total length changed between 64.1 and 158.6 cm for females and between 57.3 and 73.8 cm for males (Table 6). Similar results were obtained in a previous study of B. belone in the Aegean Sea (Uçkun et al., Reference Uçkun, Akalin and Toğulga2004) and in the Adriatic Sea (Zorica & Keč, Reference Zorica and Keč2013). The other studies from Black Sea did not contain growth parameters for both sexes separately, and we did not compare our result with them. Solely, we calculated selected growth models (von Bertalanffy) parameters for combined sexes to compare previous studies and realized that the asymptotic total length of B. euxini was longer than in other parts of the Black Sea (Samsun et al., Reference Samsun, Özdamar and Erkoyuncu1995, Reference Samsun, Samsun, Bilgin and Kalaycı2006; Samsun, Reference Samsun1996; Polat et al., Reference Polat, İnceismail, Yılmaz and Bostancı2009). This may probably be due to the larger length composition and age range obtained in our study (see Table 6). In addition, the K values estimated using all models for males of B. euxini were estimated higher than females, and ranged between 0.048–0.356 yr−1 for females and 0.145–0.418 yr−1 for males. A similar result was obtained for B. belone in the Aegean Sea (Uçkun et al., Reference Uçkun, Akalin and Toğulga2004). But, Zorica & Keč (Reference Zorica and Keč2013) reported higher K value of B. belone in males (0.159) than females (0.166) in the Adriatic Sea. In the previous study, estimated K values of B. euxini were generally close to each other, but sometimes the K value was estimated to be higher. For example, the K value was estimated as 0.193 (Samsun et al., Reference Samsun, Özdamar and Erkoyuncu1995), 0.130 (Samsun et al., Reference Samsun, Samsun, Bilgin and Kalaycı2006), 0.198 (Polat et al., Reference Polat, İnceismail, Yılmaz and Bostancı2009) and 0.325 (Samsun, Reference Samsun1996) in different parts of the Black Sea. While garfish are generally identified as a slow growing species (Zorica & Keč, Reference Zorica and Keč2013), K can be affected by year and geographical region and may be due to different length composition, age range and different biotic (e.g. prey availability, predators, genetic variation) and abiotic factors (e.g. salinity, temperature, habitat structure).
Comparison of von Bertalanffy growth curve parameters, growth performance index (φ′), size range and slope of the length–weight regression line (b) of garfish obtained from other populations of the different locality. L ∞ is the upper asymptotic total length to which the garfish growth (cm), K = the growth rate parameter (yr−1), t 0 is the nominal age at which the total length is zero.
*, studies measured size as fork length.
Growth performance index is a good tool for averaging growth parameters for a particular species (Sparre & Venema, Reference Sparre and Venema1992) and useful for the evaluation of growth under a variety of environmental stresses (Pauly, Reference Pauly1991). The growth performance indices, calculated from different studies are shown in Table 6. Our results of Φ′ for females were a bit greater than for males, indicating that females grew relatively faster and reached a larger asymptotic total length at age compared to males. When studies from different regions are compared, the Φ′ of B. belone and B. euxini are close to each other in the Black Sea (Samsun et al., Reference Samsun, Özdamar and Erkoyuncu1995, Reference Samsun, Samsun, Bilgin and Kalaycı2006; Samsun, Reference Samsun1996; Polat et al., Reference Polat, İnceismail, Yılmaz and Bostancı2009), Aegean Sea (Uçkun et al., Reference Uçkun, Akalin and Toğulga2004) and in the Adriatic Sea (Zorica & Keč, Reference Zorica and Keč2013).
The age at inflection point of the growth curve (I) is the age corresponding to reproductive maturity in the growth curve, or described as the theoretical time of maximum growth. I also generally coincides with the onset of reproductive maturity in animals (Fitzhugh, Reference Fitzhugh1976; Karkach, Reference Karkach2006). Zorica et al. (Reference Zorica and Keč2011) estimated 50% total length at sexual maturity for B. belone as 28.0 cm for females and 31.5 cm for males, corresponding to about age 2 yr (Zorica & Keč, Reference Zorica and Keč2013). Similarly, Dorman (Reference Dorman1989) mentioned that the rapid growth rate of B. belone continues into the second year, associated with the size at sexual maturity. In the Black Sea, B. euxini reached 50% size at sexual maturity at age 2 yr and 38.8 cm (Samsun, et al., Reference Samsun, Samsun, Bilgin and Kalaycı2006). The age at inflection point was estimated from the present study as 1.7 yr for females and 1.2 yr for males by the Richards model. These results approximately suggest that the age at inflection point of the growth curve of garfish specimens coincide biologically with the age at sexual maturity calculated from previous study.
Mortality
Mortality rate is one of the most important parameters for fisheries management, and the most accurate estimates of mortality are difficult. The results of mortality rates and exploitation rates of garfish obtained from previous studies from the Black and Adriatic Seas are shown in Table 7. Total instantaneous mortality rate of B. euxini was estimated to be lower for females (1.042 yr−1) than for males (1.238 yr−1). Natural mortality rate for this species was estimated using four empirical equations using input parameters of seven growth models, showing that natural mortality of males was also higher than for females (Table 3). A similar result was obtained for B. belone stock in the Adriatic Sea (Zorica & Keč, Reference Zorica and Keč2013). Higher natural mortality estimation for males may be due to sexual dimorphism in size (e.g. sex-ratio fluctuation with size was represented up to 38 cm total length by male than by female), fishing gear selectivity, sampling strategies and spawning migration patterns. Moreover, fishing mortality rate was higher than in the Adriatic Sea, and in the Black Sea fishing mortality rate changed between years (see Table 7), maybe due to different fishing pressure and biotic and abiotic factors affecting the garfish stock, e.g. strength of the garfish year-class and growth. On the one hand, larger size usually leads to greater mating success, greater fertility, lower vulnerability to environmental hazards, and thus lower mortality (Karkach, Reference Karkach2006). Therefore, the differences in the estimates may arise either from the stock being at equilibrium and a constant mortality for different sizes, or the data do not represent the true population.
Comparison of mortality and exploitation rates of garfish obtained from different studies in the Black Sea (Belone euxini) and Adriatic Sea (Belone belone). Z is total mortality rate (yr−1), M is natural mortality rate (yr−1), F is fishing mortality rate (yr−1), E is exploitation rate (yr−1).
Gulland (Reference Gulland1971) suggested that in a stock that is optimally exploited, fishing mortality should be about equal to natural mortality, or F opt ≈ M which correspond to E opt ≈ 0.5 (Pauly, Reference Pauly1984). The exploitation rates of B. euxini for both sexes obtained using input parameters from four empirical natural mortality rates and seven growth models showed that garfish stock was overexploited in the Black Sea (E > 0.5). The severity of exploitation on the garfish stock off the Sinop coast in the middle Black Sea also changed year to year, and was estimated as 0.7, 0.6 and 0.8 in the previous studies by Samsun et al. (Reference Samsun, Özdamar and Erkoyuncu1995, Reference Samsun, Samsun, Bilgin and Kalaycı2006) and Samsun (Reference Samsun1996), respectively. These fishing levels have been contentious on the Turkish Black Sea coast.
According to Duzgunes & Erdogan (Reference Duzgunes and Erdogan2008), fishing regulation is based on the following criteria in the Turkish Seas: minimum mesh and fish size; closed season and area; species under full conservation (e.g. cetaceans, salmon, sturgeon); completely banned fishing methods and fishing gears; gear restriction for identified species and gear or fishing method restrictions; and some restrictions concerning pollutants. None of these regulations apply to the garfish fishery. Therefore, a stock assessment and management of this species in the Black Sea is urgently needed. To protect garfish stock and to build sustainable garfish fisheries in the Black Sea, some management measures such as total allowable catch and landing quotas, exclusive regional fishing permits or closed area (e.g. coastal garfish spawning area), minimum fish size (e.g. 35 cm total length) and closed season (e.g. May–July) should be applied as soon as possible by a competent body (the Ministry of Food, Agriculture and Livestock). The results of this study should be used as biological input parameters for further evaluation of the garfish stock in the Black Sea and regarded as a reference for management of other stocks of this species.
ACKNOWLEDGEMENTS
We thank two anonymous referees for their valuable comments on earlier drafts of this manuscript. We also thank Associate Professor Dr Selcuk Demir for improving the language of this manuscript.
FINANCIAL SUPPORT
This study was supported by Recep Tayyip Erdoğan University with project number 2012.103.03.3.