Introduction
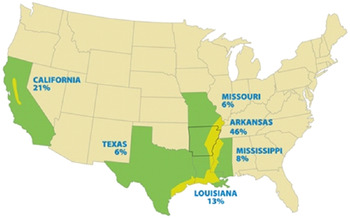
Rice (Oryza sativa L.) is an imported crop in North America, from multiple origins, and has no wild relatives in this region. Rice cultivation in the United States started in the coastal lowlands of South Carolina, a landmark anthropological offshoot of trading slaves from West Africa into the New World (Carney Reference Carney2002). The earliest record of rice production was in 1685, with the growers planting an African rice ‘Carolina Gold’ (Chang Reference Chang2003). Rice culture in the midsouthern United States started in Louisiana, most likely between 1716 and 1720, courtesy of French immigrants presumed to have originated from the West Indies (Lee Reference Lee1960). Rice seeds they planted originated from three possible sources: the West Indies, Guinea Coast, and later from South Carolina (Lee Reference Lee1960). Rice culture then expanded to Arkansas in 1901 (Brown and Morris Reference Brown and Morris1970). Meanwhile, substantial rice production in east Texas in the Gulf Coast region was recorded in 1853, with seed from Madagascar varieties, via the Carolinas (Dethloff Reference Dethloff1988). Today, rice production in the United States occurs primarily through the Mississippi River alluvial valley in the Missouri bootheel, Arkansas, Mississippi, and Louisiana; along the Gulf Coast of Texas and Louisiana; and in the Sacramento River Valley of California (Figure 1). In 2019, the United States produced 8.4 billion kg of rice, 46% of which was from Arkansas (USDA-NASS 2020), and currently ranks fifth in global rice exports (Shahbandeh Reference Shahbandeh2021).
Rice production areas in the U.S., with proportion produced by each state in 2019. http://prodriceold.aristotle.net/rice-information (accessed: January 10, 2021).

Along with the cultivation of rice came weedy rice, introduced as a contaminant of imported seed. Genomic evidence informs us that the widely divergent U.S. weedy rice populations (Constantin Reference Constantin1960; Noldin et al. Reference Noldin, Chandler and McCauley1999; Shivrain et al. Reference Shivrain, Burgos, Scott, Gbur, Estorninos and McClelland2010) are all descendants of cultivated ancestors, specifically, O. sativa (Kanapeckas et al. Reference Kanapeckas, Vigueira, Ortiz, Gettler, Burgos, Fischer and Lawton-Rauh2016; Reagon et al. Reference Reagon, Thurber, Gross, Olsen, Jia and Caicedo2010). U.S. weedy rice is of the same species as cultivated rice, O. sativa, but the largest majority (up to 96%) belong to the indica subspecies group (Bevilacqua et al. Reference Bevilacqua, Basu, Pereira, Tseng, Zimmer and Burgos2015; Gross et al. Reference Gross, Skare and Olsen2009; Vaughan et al. Reference Vaughan, Ottis, Prazak-Havey, Sneller, Chandler and Park2001) in contrast to the primarily japonica subspecies of cultivars grown in the southern United States. When present, weedy rice is the most difficult weed to control in rice because its biological traits are nearly identical to those of cultivated rice. When not controlled, weedy rice is one of the most economically damaging rice weeds globally, due to severe yield losses (reviewed in Roma-Burgos et al. Reference Roma-Burgos, Sudo, Olsen, Werle and Song2021) and reduction of grain quality (Ottis et al. Reference Ottis, Smith, Scott and Talbert2005). In Arkansas, weedy rice is deemed the third most problematic weed in rice, behind Echinochloa spp. and Cyperus spp. (JK Norsworthy and TR Butts, personal communication). Thus, the herbicide-resistant (HR) Clearfield® (HorizonAg, LLC, Memphis, TN, USA) rice was rapidly adopted by rice growers when it was released in 2002 (Hardke Reference Hardke2020). Weedy rice is historically called “red rice,” because its seed has a red pericarp. This traditional name no longer applies to the contemporary weedy populations, which include an admix of crop–weed outcrosses with long, white grains that are more crop-like (Burgos et al. Reference Burgos, Singh, Tseng, Black, Young, Huang, Hyma, Gealy and Caicedo2014; Singh et al. Reference Singh, Singh, Black, Boyett, Basu, Gealy, Gbur, Pereira, Scott, Caicedo and Burgos2017). These contemporary weeds also include segregating, volunteer offspring from hybrid rice, which gained a large share of rice hectares in the recent decade (Hardke Reference Hardke2020).
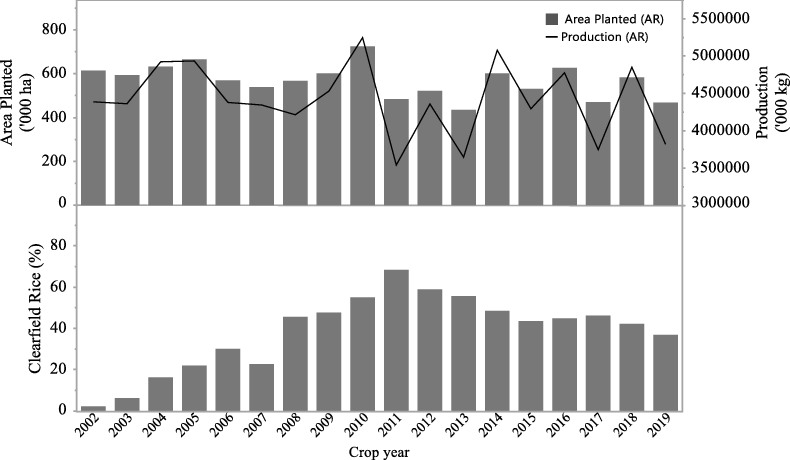
Since the early 2000s when Clearfield® rice was commercialized in the U.S. Midsouth, the planted hectares of Arkansas rice have fluctuated between 435,000 and 725,000 ha (Figure 2). Of these, the highest proportion planted with Clearfield® rice was close to 70% in 2011. For 11 yr, at least 40% of rice varieties planted in Arkansas were Clearfield®, until it fell below 40% in 2019 (Hardke Reference Hardke2020). The decline in Clearfield® rice hectares may be due to increasing incidence of outcrossed HR weedy rice, which was identified by growers early on (Burgos et al. Reference Burgos, Norsworthy, Scott and Smith2008; Zhang et al. Reference Zhang, Linscombe, Webster, Tan and Oard2006). To help manage this modern rice production problem, a new generation of HR rice, Provisia® (BASF Corp., Research Triangle Park, NC, USA), was commercialized in 2018. Whereas Clearfield® rice is resistant to Group 2 herbicides, particularly the imidazolinones, Provisia® rice is resistant to Group 1 selective grass herbicides, specifically the aryloxyphenoxypropanoates (i.e., quizalofop). Throughout the rest of this article, HR rice varieties will be referred to as “IMI-resistant” or “quizalofop-resistant” rice.
Rice production in Arkansas, USA, and the proportion of rice hectares planted with herbicide-resistant (imidazolinone-resistant) rice varieties from the first year of commercialization in 2002 to 2019 (Hardke Reference Hardke2020; USDA-NASS 2020).

This survey aimed to assess the current status of the weedy rice problem in the U.S. Midsouth, specifically in Arkansas, the bootheel of Missouri, and northeast Louisiana, after nearly two decades of IMI-resistant rice technology adoption. This study was conducted in anticipation of increased adoption of quizalofop-resistant rice, with the goal of using current information to enable better integration of this new tool into the existing weed management practices and stewardship program for long-term management of weedy rice.
Materials and Methods
To gauge the status of the weedy rice problem and how HR technology might have impacted this, a questionnaire for rice producers or consultants (Supplementary Appendix 1) was distributed using multiple approaches throughout 2020. This survey was approved by the University of Arkansas Institutional Review Board (IRB) under IRB protocol no. 2001244387. Electronic copies were sent to County Extension agents (CEAs) or directly to growers and consultants by email. Physical copies were distributed to growers and consultants at county Extension production meetings and through personal visits during the growing season. The CEAs also facilitated the distribution of questionnaires to growers. The producer/consultant questionnaire was patterned after the first survey conducted in 2007 (Burgos et al. Reference Burgos, Norsworthy, Scott and Smith2008) and comprised four sections: (1) overview of rice production; (2) weed management practices; (3) weedy rice problem; and (4) HR rice technology. Section 1 contained questions about farm size and location, tillage and crop rotation practices, rice varieties planted, and major problem weeds. Herbicides used and other weed management practices were explored in Section 2. Section 3 contained questions on practices to prevent weedy rice infestation, the status of weedy rice infestation, best management practices for weedy rice, and the respondent’s perspective on the trend of the weedy rice problem and the utility of HR rice technology to curb this problem. The respondents were asked about HR rice varieties they planted in the last 5 yr and the efficacy of herbicides associated with the technology on weedy rice. Growers were also asked about resistant weeds in fields planted with HR rice technology. A questionnaire specifically designed for CEAs (Supplementary Appendix 2) was also distributed by email to obtain a broader perspective on the status of the weedy rice problem in each county. To gauge their level of familiarity and experience with rice production and the weedy rice problem, the CEAs were asked about their overall length of service with the Cooperative Extension Service and their length of service in the counties where they were currently assigned. With respect to weedy rice, they were asked to estimate the proportion of rice fields in their counties with a weedy rice infestation and the level of infestation, assess whether the weedy rice problem is generally increasing or decreasing, and list what they perceive as the most effective practices for weedy rice management.
Summaries of responses were tabulated. Cluster analysis was conducted on the estimated levels of weedy rice infestation using Ward’s hierarchical clustering in JMP v. 15.2.0 (SAS Institute, Cary, NC) to generate statistically supported categories of weedy rice infestation levels. Generalized regression analysis using zero-inflated gamma distribution was also done on weedy rice infestation data and production practices that could influence the weedy rice problem (Supplemental Table 1).
Results and Discussion
Survey Coverage
In 2020, 35 counties in Arkansas had at least 500 ha of rice (USDA-NASS 2020); 26 of these were represented in the survey (Figure 3). Also represented in the survey were 7 of 10 rice-producing counties in the Missouri Bootheel area and four parishes in northeast Louisiana. Rice production practices in these adjoining areas are similar to those in Arkansas. Due to the relatively open distribution methods utilized, the total pool of potential recipients reached is unknown. Thirty-three respondents returned the rice producer survey; eight of these were consultants. Collectively, the Arkansas respondents farmed or managed a total of 95,872 ha, which represented 16.2% of planted hectares in Arkansas in 2020. Meanwhile, 17 CEAs from Arkansas returned the CEA survey, representing 48% of counties with some rice production. One CEA respondent was from the Missouri Bootheel area and provided information for seven counties.
Rice-producing counties in Arkansas, USA, and adjacent locales included in the weedy rice survey, 2020 (shaded in green). Counties shaded in gray are also reported to have some commercial rice production.

Overview of Rice Farming
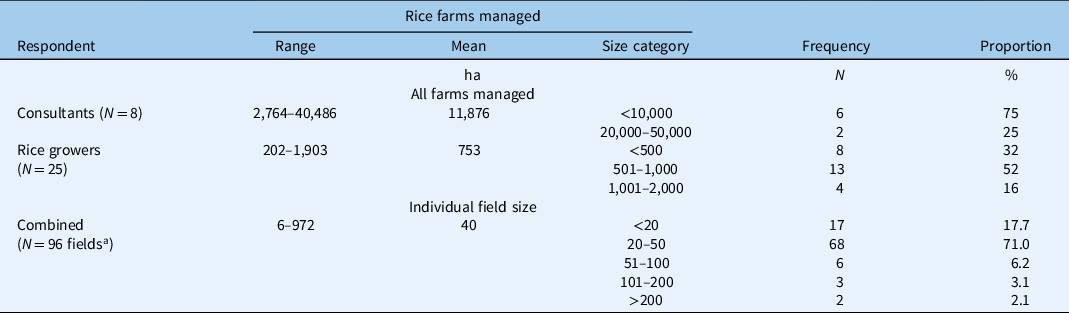
The total farm size that rice grower respondents managed ranged from 202 to 1,903 ha with an average of 753 ha (Table 1). On the other hand, the consultants managed between 2,764 and 40,486 ha of rice fields, with each respondent managing almost 12,000 ha on average. Overall, the respondents described a total of 106 separate fields, with field-size data on 96 fields. Field sizes ranged from 6 to 972 ha and averaged 40 ha. Most fields (71%) were within 20 to 50 ha, with only about 5% of fields larger than 100 ha. This indicates that in general, rice growers manage more than five separate fields.
Rice farm size managed by grower or consultant respondents in Arkansas, USA, and adjacent locales, 2020.

a N = the total number of fields described by respondents that included field-size data. Some respondents did not indicate field-size information. The majority of respondents provided data on up to five individual fields they managed, which was the maximum requested in the survey. Overall, the respondents described a total of 106 fields.
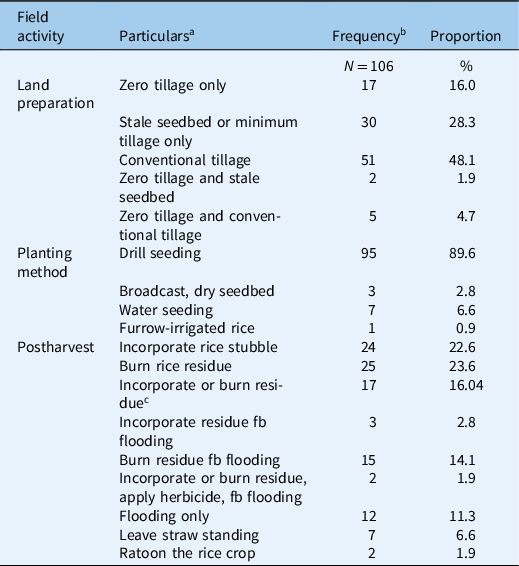
About 50% of fields described by the respondents were conventionally prepared (Table 2). Conventional tillage entails at least three trips to the field, starting with tillage in the fall after harvest to knock down levees and incorporate rice residue. If the field is too wet for tillage, then the residue is rolled to enhance decomposition. Either in the fall or spring, the field is disked to level or fill the ruts. Then the field is harrowed, land-planed, and leveled. Almost 30% of the fields were under minimum tillage or stale seedbed, which means that land preparation operations are done in the fall and the field is left undisturbed in the spring. Rice is drill seeded into the undisturbed seedbed. This practice requires the use of preplant herbicides to desiccate vegetation before planting. Some growers practice zero tillage (16% of fields).
Overview of rice-farming practices at least within the last 3 yr related to weed management in up to five fields described by the weedy rice survey respondents in Arkansas, USA, and adjacent locales, 2020.

a fb, followed by.
b Total number of fields described by respondents.
c Depending on time and environmental conditions.
Rice is planted primarily by drill seeding in 90% of the fields; only 7% were water seeded (Table 2). This reflects the overall rice establishment practice in the U.S. Midsouth (Hardke et al. Reference Hardke, Barber, Bateman, Butts, Hamilton, Henry, Lorenz, Mazzanti, Norsworthy, Roberts, Slaton and Wamishe2020). Water seeding of rice is primarily practiced in the Gulf Coast of Louisiana and in California (Roma-Burgos et al. Reference Roma-Burgos, Al-Khatib, Webster, McKnight, Bond, Bagavathiannan and Rao2017). One respondent reported growing furrow-irrigated rice in one of his fields. Furrow-irrigated rice hectares have been gradually increasing in Arkansas, in the quest to save water, labor, tillage passes, and fuel and as more research data have been generated on how to produce aerobic rice on shallow, furrow-irrigated beds. Furrow-irrigated rice (also known as row rice) hectares in Arkansas increased from less than 1% in 2015 to 10% in 2019 (Hardke and Chlapecka Reference Hardke and Chlapecka2020). Hybrid rice cultivars, with high resistance to rice blast fungus (Magnaporthe oryzae B. Couch), perform well in this system. Furrow-irrigated rice can save up to 40% of irrigation water normally used in flooded rice and facilitates rotation to upland crops (Hardke and Chlapecka Reference Hardke and Chlapecka2020). Most adopters shared that they are not saving water, but instead are saving expenses on tillage passes and labor (from not having to tear down and rebuild levees) as well as saving time (TR Butts, personal communication). The increased flexibility in crop rotation indicates that furrow-irrigated rice has the potential to reduce the weedy rice problem.
The primary postharvest activity in the fall pertains to rice residue management, as rice straw decomposes slowly during the winter. Some fields (23%) were tilled to incorporate the rice residue after the levees were knocked down (Table 2). Rice residue was burned in 24% of fields; whereas in others (16%), residue management depends on the weather and time of year. If it rains a lot and/or it is close to winter, growers need to burn the residue. Residue burning is also associated with zero tillage. Although residue burning is closely monitored because of smoke hazards, some growers do it by necessity, or for economic reasons, to reduce the number of trips across the field. Other variations of residue management included burning followed by flooding (14%) or rolling followed by flooding (11%). Flooding rice fields in the winter is a practice favored by duck and geese hunters. The U.S. Midsouth is along the winter migration route of waterfowl, and croplands provide prime feeding grounds for migrant birds. Winter flooding not only enhances degradation of seeds on the soil surface (Fogliatto et al. Reference Fogliatto, Vidotto and Ferrero2011; Singh et al. Reference Singh, Burgos, Singh, Abugho, Earnest, Gbur and Scott2016a) but also attracts birds and encourages predation of freshly deposited rice (weedy or not) seeds. Intact rice seeds are not passed through the feces of ducks, and there is little chance of birds spreading viable rice seeds (Cummings et al. Reference Cummings, Handley, Macbryde, Tupper, Werner and Byram2008). Thus, winter flooding is an effective cultural strategy to reduce a weedy rice infestation. On rare occasions rice residue would be left standing in the field (7%). In this case, the field would be planted no-till the following season.
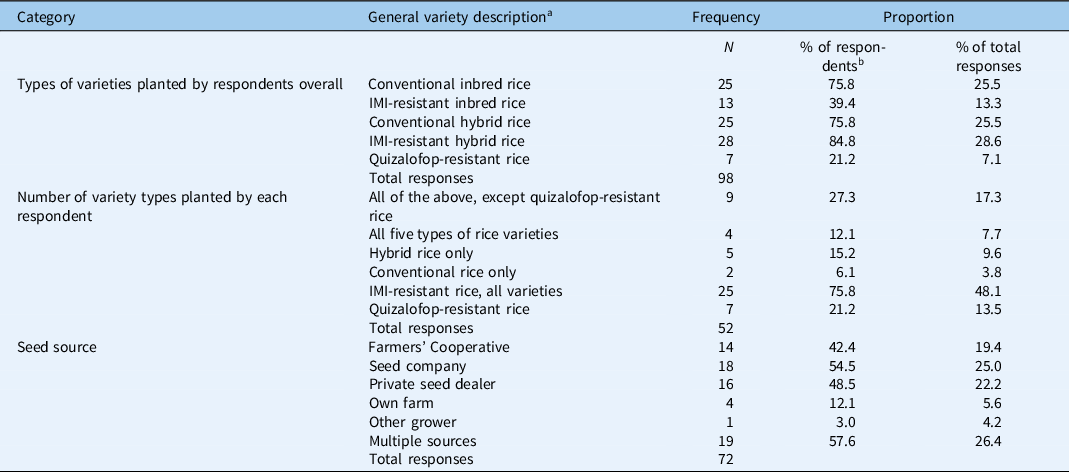
The respondents planted five types of rice varieties across their fields and across years. Overall, a large majority of respondents (85%) had planted IMI-resistant hybrid rice and equal proportions (76%) planted conventional hybrid rice or conventional inbred rice (Table 3). IMI-resistant varieties (inbred or hybrid) were mentioned by the respondents 51% of the time. A few respondents (21%) had grown quizalofop-resistant rice. Only a few respondents commented on variety preference. Those who did, mentioned that they prefer hybrids because of high yield potential and consistency of performance across different soil types (data not shown). A few also commented on the need to have high-yielding quizalofop-resistant rice varieties. Rice producers value this technology for the control of IMI-resistant weedy rice outcrosses and volunteers but are constrained by the relatively low yield potential of the first-generation varieties. Once the yield limitation is overcome, we expect the proportion of rice fields planted with this new HR rice technology to increase rapidly. Almost 30% of respondents had planted all types of rice varieties, except the recent quizalofop-resistant rice, in the last 3 to 5 yr, and 76% had planted all types of IMI-resistant rice varieties. It is notable that only two respondents had not planted hybrid rice, which is indicative of the popularity of hybrid rice varieties. The producers were overwhelmingly in favor of HR rice varieties, as indicated by having only seven respondents who planted only conventional inbred or hybrid rice despite its contribution to weedy volunteers and HR weedy populations, as discussed elsewhere in this survey.
Rice varieties planted by respondents in the last 3 yr, across all fields they managed, in Arkansas, USA, and adjacent locales, 2020.

a IMI, imidazolinone.
b Rice growers: 25; rice consultants: 8. Generally, each respondent had planted multiple types of varieties.
Fifty-four percent of respondents procured their seeds from seed companies, and 48% sourced their seeds from private dealers (Table 3). The Farmers’ Cooperative is also an important source of rice seeds, patronized by 42% of respondents. Because of the diversity of rice varieties planted by growers, the majority of them (58%) had procured seeds from multiple sources as appropriate. On rare occasions, a few producers would use their own seed or that of their fellow producers, a practice known as “brown bagging.” Such practice has been blamed for inadvertent spread of weedy rice-contaminated rice seed. This practice is illegal in regard to conventional and HR hybrids as well as HR inbred varieties; thus, most of the brown bagging occurs with public inbred varieties.
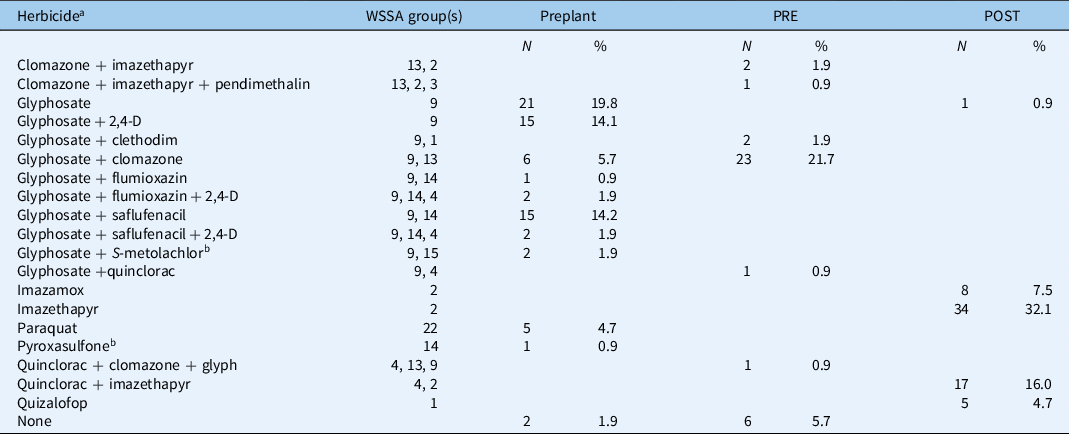
Rice producers use a wide array of herbicide modes of action (MOAs; up to 11 groups; data not shown); those with activity on weedy rice are listed in Table 4. The respondents collectively described their herbicide use for 106 separate fields. Glyphosate was used preplant on 60% of these fields, primarily in combination with the residual herbicide saflufenacil. It was also used with 2,4-D in 14% of the fields or alone (20%). In several cases (26 fields), glyphosate was used at planting. This pertains to minimum-tilled or stale seedbed fields. The application of glyphosate before or at rice planting controls weedy rice that emerged ahead of crop planting under stale seedbed culture. This practice reduces the population size of weedy rice in the growing season and helps reduce the soil seedbank size if new seed deposit is prevented. Several of the residual herbicides used PRE can also be applied early POST up to immediately before permanent flooding. Imazethapyr was applied POST in 32% of the fields as a solo formulation, or as a premix with quinclorac in 16% of the fields, in association with IMI-resistant rice. This was in addition to being used PRE. Quinclorac was also applied POST to IMI-resistant rice in 18% of the fields or as a premix with imazethapyr (Clearpath®; BASF Corp., Research Triangle Park, NC, USA) in 16% of the fields. This reflected the continuing popularity of IMI-resistant rice varieties. Although not related to weedy rice control, it is noteworthy that propanil was used on only about 20% of the fields (data not shown), indicating a departure from what was historically a propanil-based rice weed management program (Talbert and Burgos Reference Talbert and Burgos2007). This trend is primarily driven by the prevalence of Echinochloa spp. resistance to propanil (Rouse et al. Reference Rouse, Burgos, Norsworthy, Tseng, Starkey and Scott2018) and the expansion of the herbicide MOAs available for use in rice.
Herbicides with activity on weedy rice used by respondents on individual rice fields in Arkansas, USA, and adjacent locales, 2020.

a Total number of fields described = 106; other herbicides that are not effective on weedy rice were excluded.
b Fall application. This is an off-label application.
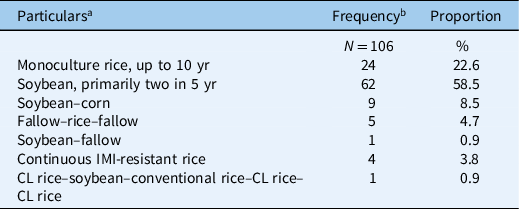
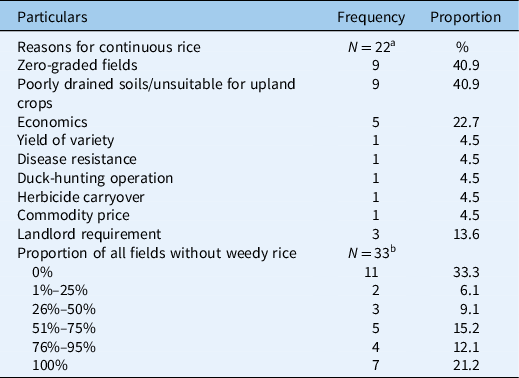
Almost one-fourth (23%) of rice fields described by respondents were planted with continuous rice for the previous 10 yr (Table 5). Planting continuous rice for many years was inevitable, primarily because such fields were either zero-graded (41%) or poorly drained (41%) (Table 6). Some respondents provided multiple reasons, among them being the landlord’s preference. Almost 60% of fields were planted with a rice–soybean [Glycine max (L.) Merr.] rotation, generally consisting of two soybean crops in 5 yr (Table 5), which means planting soybean every other year. The frequency of soybean in the rotation is dictated by commodity prices. Other variations of crop rotation involving soybean include rice–soybean–corn (Zea mays L.) and rice–fallow–soybean. Collectively, 73 fields (69%) had been in some variation of a soybean crop rotation system. Soybean remained the most compatible rotational crop with rice, as was reported more than a decade ago (Burgos et al. Reference Burgos, Norsworthy, Scott and Smith2008), especially with IMI-resistant rice, because of its tolerance to IMI herbicides. Four fields had been in continuous IMI-resistant rice for 4 yr, which is against the stewardship recommendation. This practice has resulted in the increasing occurrence of HR weedy rice.
Crops planted by respondents in the last 3 yr, in rotation with rice, in Arkansas, USA, and adjacent locales, 2020.

a CL, ClearfieldTM; IMI, imidazolinone.
b The respondents were rice growers (25) and rice consultants (8). Each respondent provided information for up to five fields they manage, collectively describing 106 fields.
Reasons for planting continuous rice or not planting other crops more frequently and reported occurrence of weedy rice across all fields the respondents managed in Arkansas, USA, and adjacent locales, 2020.

a Of the 24 fields that were in rice monoculture for various lengths of time, reasons for not practicing crop rotation more often or not at all were provided for 22 fields. Some respondents provided multiple reasons for each field being in continuous rice.
b Respondents’ overview of weedy rice infestation across all fields.
Perspectives of Rice Growers and Consultants on Weedy Rice
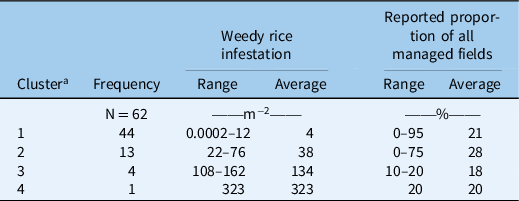
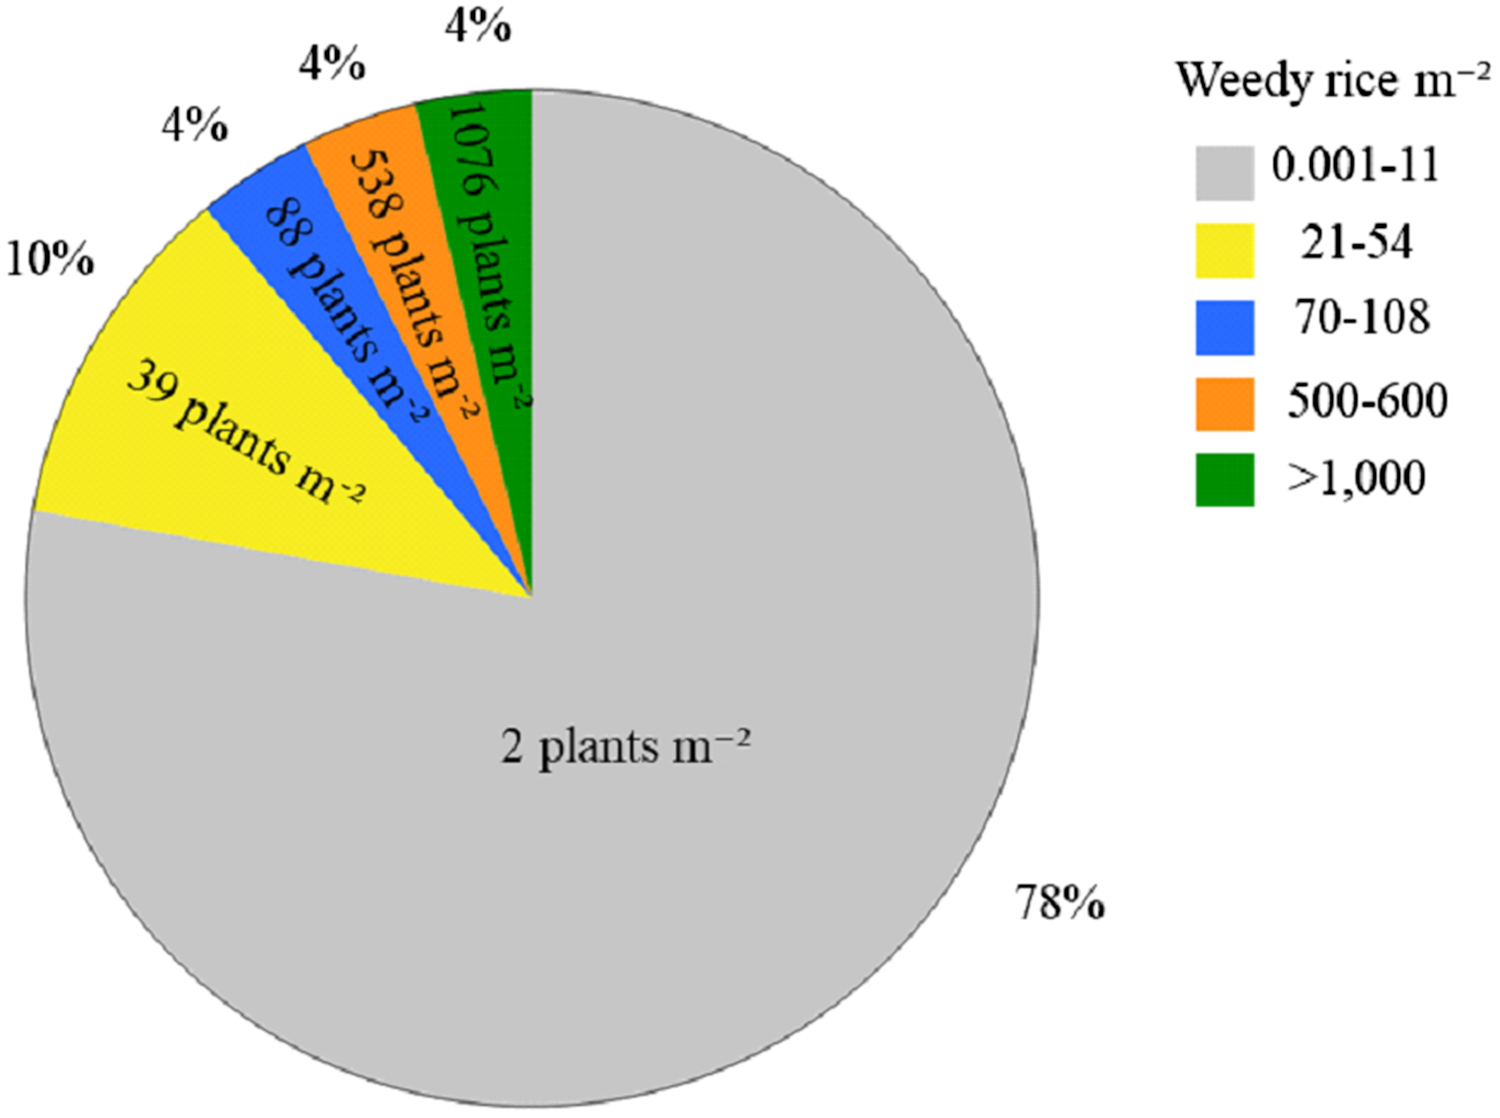
One-third of respondents reported that all of their fields had some level of weedy rice infestation, whereas only 21% reported that all of their fields did not have weedy rice (Table 6). The rest had various proportions of their fields infested with weedy rice. Across all fields that respondents farmed or managed, they reported 62 data points for weedy rice infestation levels. These numbers fell into four clusters, the largest being fields with 0.0002 to 12 weedy rice plants m−2 (Table 7). This was classified as light infestation according to the respondents’ perspective. Although statistically supported, the range within this cluster is still large. The upper margin of this range would not be considered light by many. On average, 21% of respondents’ fields were described to be in this category, with a range of up to 95% of their fields. A slightly larger proportion (28%) of all fields managed by the respondents were in the second cluster, with 22 to 76 weedy rice plants m−2. A few respondents reported extremely high levels of weedy rice infestation. The availability of HR rice technology has helped with weedy rice management, but it is not going to eliminate the problem completely. Respondents also provided details of weedy rice infestation in up to five specific fields. Data were obtained for a total of 81 infested fields. Of the 106 fields described by respondents, 25 (24%) did not have weedy rice infestation. Cluster analysis separated the infested fields into five groups based on the estimated density of weedy rice (Figure 4). The largest cluster included 78% of infested fields, with an average infestation of 2 weedy rice plants m−2. This indicates that in general, the weedy rice problem is being managed well. There were a few fields with extreme levels of infestation, just as the respondents described in the overview of all fields they managed.
Perspective of rice growers and consultants on the overall level of weedy rice infestation of fields they manage in Arkansas, USA, and adjacent locales, 2020.

a Each respondent with weedy rice-infested fields reported up to three levels of infestation, from light to heavy, with an estimate of weedy rice population density, according to the respondent’s perception. These data were across all fields a respondent farmed or managed. Cluster analysis was done on the estimated weed density using Ward’s hierarchical clustering method in JMP v. 15.2.0 (SAS Institute, Cary, NC).
Weedy rice infestations in individual fields in Arkansas, USA, and adjacent locales, 2020. The respondents provided information for 1 to 5 fields (106 fields total). Cluster analysis was done on data from 81 fields with weedy rice infestations; the rest did not have weedy rice. Ward’s hierarchical clustering method was performed in JMP v. 15.2.0 (SAS Institute, Cary, NC). The average weedy rice infestation per cluster is indicated in each section of the pie chart. The proportion of fields that belong to each cluster is indicated as percentage beside each section.

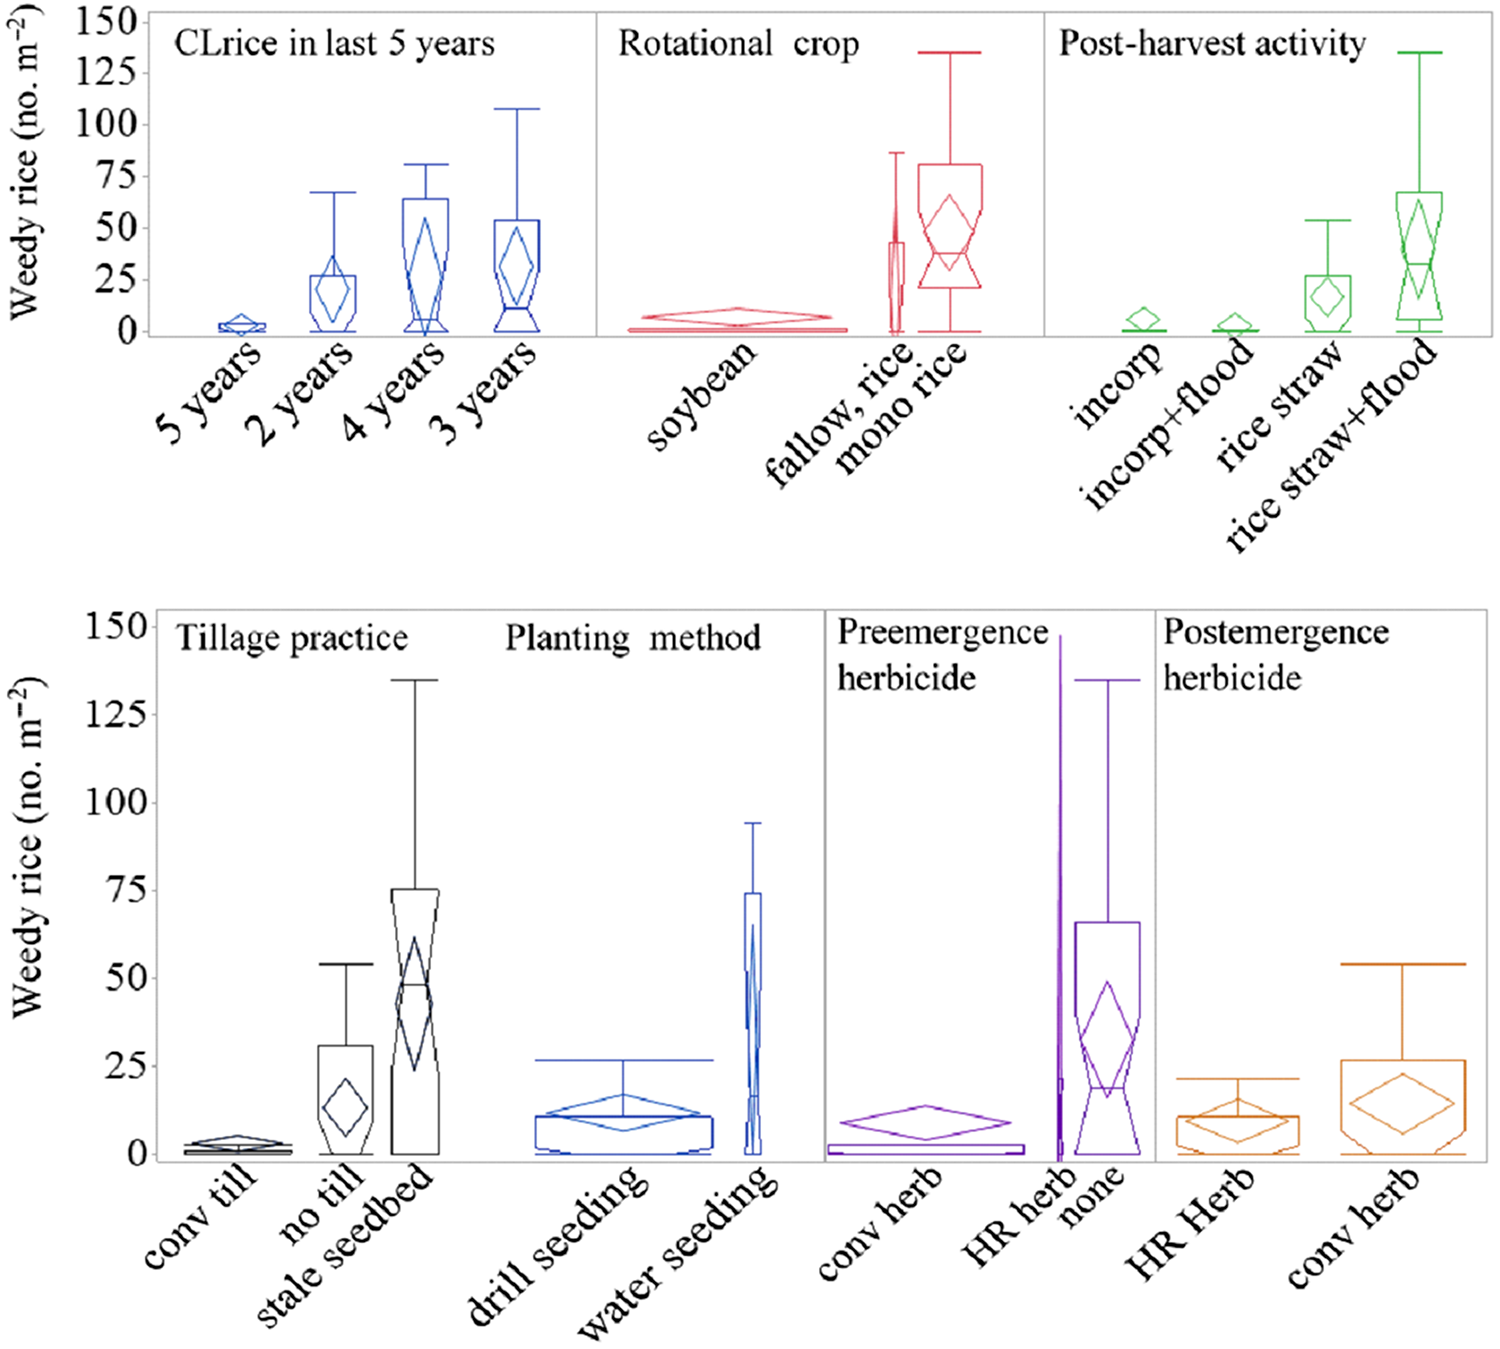
The most important management factors influencing weedy rice infestation were tillage practice and crop rotation (Supplementary Table 1). The primary tillage practices reported and included in the analysis were zero tillage, stale seedbed, and conventional tillage, with the last being practiced in about 50% of the fields in this data subset (Supplementary Table 2). Considering that we cannot know the actual response rate of this survey due to the various methods used to distribute the questionnaire, the distribution of responses still reflected the historical predominance of conventional tillage in rice production and the increasing adoption of conservation tillage practice in Arkansas (Hardke et al. Reference Hardke, Wamishe, Lorenz and Bateman2018). Conventionally tilled fields had the least number of weedy rice infestation, while fields under conservation tillage (no-till or stale seedbed) had higher weedy rice infestation (Figure 5). Crop rotation had a significant influence on weedy rice infestation (Supplementary Table 1), which conformed with results of previous surveys (Burgos et al. Reference Burgos, Norsworthy, Scott and Smith2008; Norsworthy et al. Reference Norsworthy, Bond and Scott2013). Rotation to other crops has been the most reliable cultural practice to reduce weedy rice infestation. Considering a subset of 99 fields (excluding rare crop rotation practices), weedy rice infestation was lowest under the rice–soybean rotation production system. Fields under prolonged rice monoculture were reported to have an estimated 44 plants m−2 of weedy rice by the respondents in contrast to 17 plants m−2 under soybean rotation. The number of years in IMI-resistant rice and the use of IMI herbicides did not influence weedy rice infestation. Specifically, the number of years in IMI-resistant rice was not clearly related with weedy rice infestation. This could be because of the low number of fields under each of these categories and the high variability in the intensity of adhering to stewardship recommendations across growers. A larger, detailed follow-up survey focused on this aspect would allow better understanding of the effect of HR rice technology adoption on weedy rice infestation.
Crop production practices that could potentially influence weedy rice infestation, weedy rice survey in Arkansas, USA, and surrounding locales, 2020. Data were analyzed using generalized regression with zero-inflated gamma distribution. The box-plot width is sized by frequency of responses. The ends of the box represent the first (Q1) and third (Q3) quartiles. The IQR (Q3 − Q1) represent an estimate of the variability of the middle 50%. The median (Q2) is “inside” or at the base of the box. Notches in the box represent the 95% confidence interval of the median. When the notches do not overlap, the medians are significantly different. The top and bottom of the diamond are 95% confidence interval of the mean. The middle of the diamond is an estimate of the population mean. When two diamonds do not overlap, the means are significantly different.

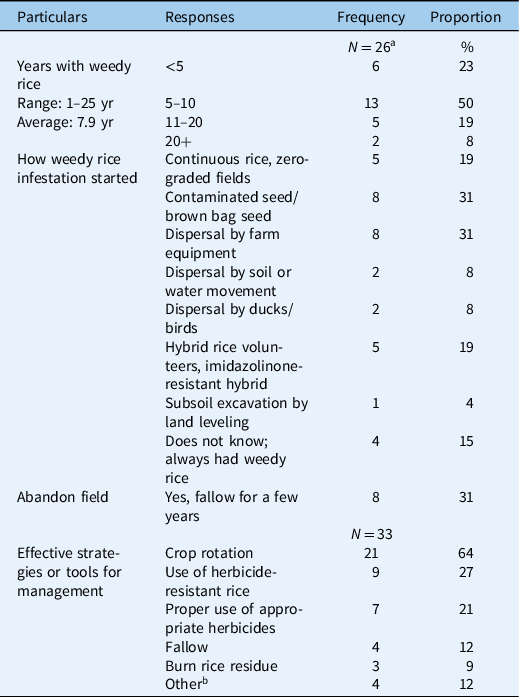
Seventy-nine percent of respondents reported having weedy rice in some of their fields. One-half of these respondents have had weedy rice between 5 and 10 yr (Table 8). This proportion came close to the roughly 75% of individual fields having weedy rice as described in the previous section. Others (15%) have had weedy rice since they started farming rice, a testament to the persistence of weedy rice, which could escalate out of control if a grower ignores best management practices for some time. Almost one-third of respondents with a weedy rice problem acquired it from contaminated rice seed, specifically the ones who used brown bag seeds. However, inadvertent introduction of weedy rice into clean fields could still happen occasionally with certified seeds. One respondent believed his weedy rice infestation came from the certified seed he planted when he observed weedy rice growing in the row (none between drill rows) in his otherwise clean field. One cannot ignore the rare chance of a few weedy rice plants escaping detection in seed production fields. Another 31% of respondents reported weedy rice being spread into other fields via farm machinery. Sanitation of farm equipment is one of the recommended best management practices to prevent the spread of weedy rice, but this can be a time-consuming activity. Considering the popularity of hybrid rice, about 20% of respondents attributed the weedy rice problem to hybrids they planted (IMI-resistant or conventional). This is because hybrid rice, specifically the earlier lines, has high seed shattering. This results in a high number of volunteer rice plants the next season, 20% on average, compared with 5% volunteers from inbred rice varieties (Singh et al. Reference Singh, Burgos, Singh, Gealy, Gbur and Caicedo2016b). Volunteer plants from hybrid rice will be weedy, because F1 plants segregate into various plant types with different phenology, unknown yield potential, and variable grain quality. Volunteer plants from IMI-resistant hybrid rice would be IMI herbicide–resistant, of course. Volunteer rice infestation of 8% will reduce head rice yield, and an infestation of about 20% will reduce total rice yield (Singh et al. Reference Singh, Burgos, Singh, Gealy, Gbur and Caicedo2016b). On occasion, some producers (31%) had to abandon rice production because of severe weedy rice infestations. In this case, they would either fallow the field, then plant soybean for a few years, or just plant soybean until the weedy rice population decreased to a minimum level. Across years of dealing with weedy rice, the majority of respondents (64%) shared that crop rotation is the most effective practice to curtail weedy rice. Several respondents listed multiple best management practices, which include the use of herbicide-resistant rice (27%) and the proper use of herbicides (21%). The latter specifically pertains to the proper use of imidazoline herbicides (imazethapyr and imazamox) and quizalofop, glyphosate for preplant desiccation of emerged weedy rice in a stale seedbed, benzobicyclon, or herbicides in rotational crops with activity on weedy rice.
Historical perspective on weedy rice infestation from rice growers and consultants in Arkansas, USA, and adjacent locales, 2020.

a Of the 33 respondents, 26 reported having a weedy rice problem. Because respondents could have multiple fields with weedy rice, each respondent could indicate multiple ways of weedy rice introduction into fields.
b Other management strategies considered effective for weedy rice include minimum or zero tillage, zero tolerance for weedy rice, rope-wick application of glyphosate, and water seeding.
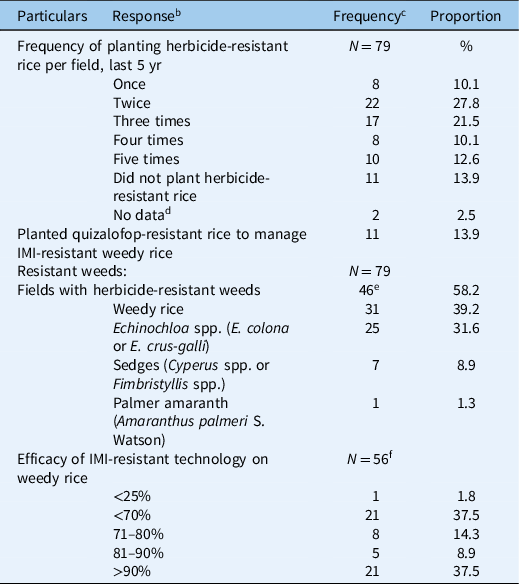
Considering that IMI-resistant rice hectarage still hovered around 40% to 50% in the last 5 yr, respondents were asked about the frequency of planting IMI-resistant rice varieties in any one field. The respondents provided information for 79 fields, of which 44% were planted three to five times with IMI-resistant rice in the last 5 yr (Table 9). Thus, some fields (13%) had continuous IMI-resistant rice when the recommendation is no more than two successive years. Norsworthy et al. (Reference Norsworthy, Bond and Scott2013) also reported an overuse of IMI-resistant rice in Arkansas and Mississippi. Subsequently, it is not surprising to see that 39% of fields had IMI-resistant weedy rice. Thirty-two percent of these fields also had Echinochloa spp. with resistance to various rice herbicides. Some respondents (14%) planted quizalofop-resistant rice, even though the yield potential was low, to alleviate the IMI-resistant weedy rice problem that had evolved in some fields. Close to 40% of respondents reported excellent control (>90%) of weedy rice with IMI-resistant rice, just like in the early years of this technology. The rest reported various magnitudes of decline in efficacy of IMI herbicides, with the largest group reporting <70% weed control. In 2007, 5 yr after IMI-resistant rice was commercialized, 86% of the surveyed consultants reported >90% control of weedy rice. Hence, respondents had great anticipation for better quizalofop-resistant varieties to help manage the HR weedy rice problem.
Respondents’ perspectives on the utility of herbicide-resistant rice for weedy rice control. a

a Data were from up to five fields per respondent in Arkansas, USA, and adjacent locales, 2020.
b IMI, imidazolinone.
c Depending on the question, the respondents provided information on up to five fields, resulting in up to 79 total fields described.
d Two fields with a history of herbicide-resistant (HR) rice did not have data on frequency of planting HR rice
e In many cases, a field had two resistant weed species; primarily Echinochloa spp. plus weedy rice
f Of 68 fields reported to have been planted with HR rice, respondents provided information on efficacy of IMI-resistant rice technology for 56 fields.
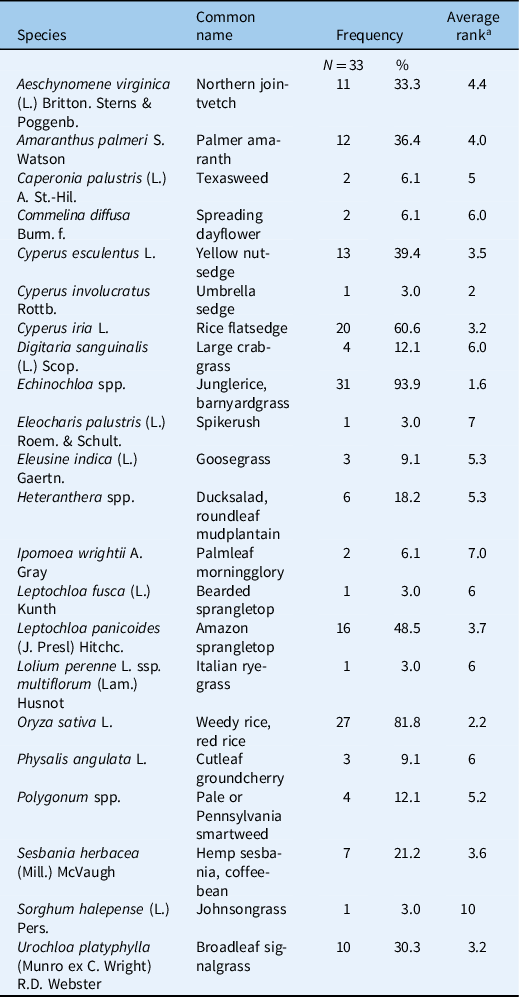
The only other weed that outranks weedy rice as most problematic to rice producers is the Echinochloa spp. complex composed of barnyardgrass [Echinochloa crus-galli (L.) P. Beauv.] and junglerice [Echinochloa colona (L.) Link], which we collectively call “barnyardgrass.” The respondents mentioned Echinochloa spp. 94% of the time, ranking it either 1 or 2; hence, giving it an average rank of 1.2 (Table 10). Weedy rice was mentioned 82% of the time, with an average ranking of 2.2. Also in the top five were rice flatsedge (Cyperus iria L.), Amazon sprangletop [Leptochloa panicoides (J. Presl) Hitchc.], and yellow nutsedge (Cyperus esculentus L.). If we combine Cyperus species, then the top three weeds in rice were Echinochloa spp., Cyperus spp., and weedy rice.
The most problematic weeds in rice according to rice grower and rice consultant respondents in Arkansas, USA, and adjacent locales, 2020.

a Respondents were asked to rank the most problematic weed species in their rice fields, with no. 1 being the most problematic.
The Extension Agents’ Perspective on Weedy Rice
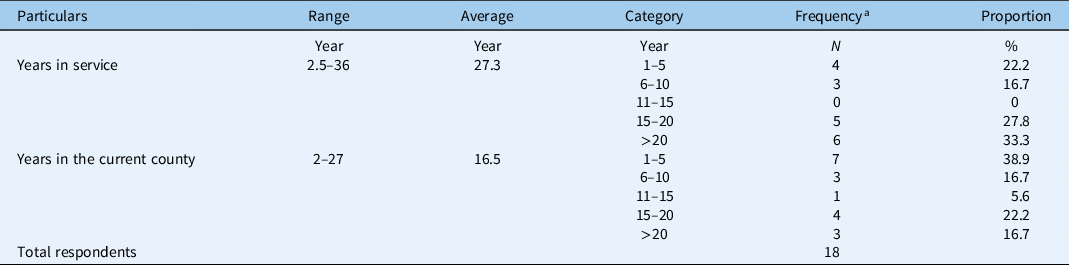
The 17 CEAs in Arkansas who returned the survey provided an overview of the weedy rice problem. This represented 49% of rice-producing counties in the Arkansas delta and the Arkansas River valley. One Extension personnel represented the Missouri Bootheel region, providing information across seven counties, which comprised 70% of the rice-producing counties in Missouri. These respondents had been in the Extension Service for as few as 2.5 yr to as long as 36 yr (Table 11). Roughly one-fifth of the respondents were relatively new hires (1 to 5 yr of experience), while the rest had been on the job for more than 6 yr. More than one-half of the CEA respondents would be considered senior personnel. It is customary to relocate the CEAs to other counties at some point in their careers. The duration of time spent in the current county reflected this. Almost 40% of the CEA respondents had been in their counties for 5 yr or fewer. The same proportion had been assigned in their counties longer than 15 yr. Overall, the CEA respondents had been in their positions for an average of 27 yr and, therefore, were very familiar with rice production problems in the state and in their counties.
Level of work experience of County Extension agent respondents, Arkansas and Missouri Bootheel, USA, 2020.

a This survey represented 17 of 32 rice-producing counties in the Arkansas delta and Arkansas River valley and 7 of 10 rice-producing counties in the Missouri Bootheel, USA.
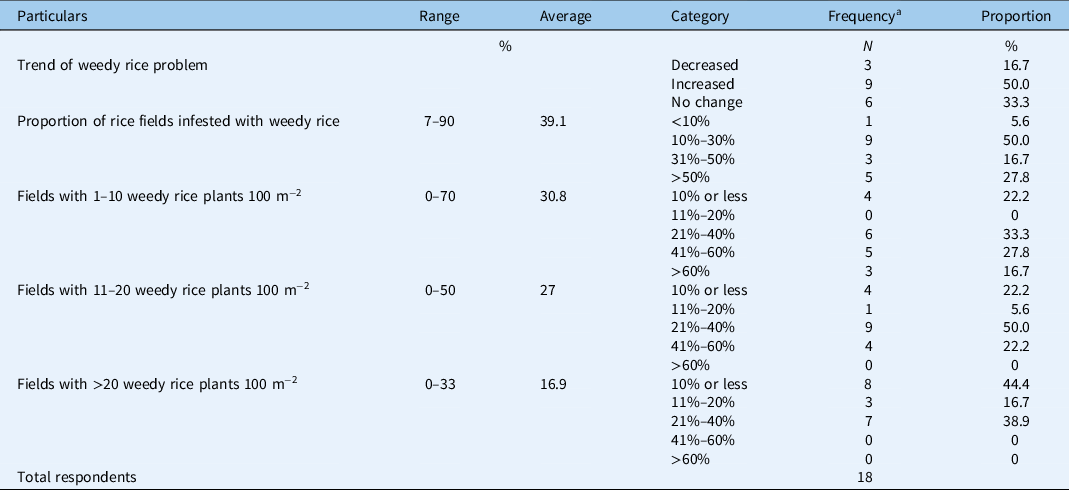
One-half of the CEA respondents perceived that the weedy rice problem was increasing, although maybe only slightly, as specified by some (Table 12). They reasoned that some areas have what is locally called “gumbo” soil, which is a very sticky, clay soil. This prevents crop rotation and following the stewardship guidelines for HR rice. Many fields in some counties are in the “river bottoms,” which have heavy clay soil, are difficult to drain, and flood frequently, and therefore are suited for rice production only. Also, many fields are zero-graded in the quest for efficient water management and increasing the uniformity of weed control with soil-active herbicides. Zero-grading locks the field into rice production. It is in such fields that weedy rice has become increasing problem or has remained the same. The CEAs of three counties added that the IMI-resistant rice technology no longer works or that the incidence of IMI-resistant weedy rice is increasing. The growers/consultants also reported declining efficacy of IMI-resistant rice technology. This implies that after almost two decades of using the technology, the build-up of IMI-resistant weedy rice populations has resulted in the resurgence of weedy rice in some areas. Three CEAs said that weedy rice had declined slightly in their respective counties. One respondent commented that more rice farmers are planting rice in rotation with soybean and are trying the new technology, quizalofop-resistant rice, in fields where weedy rice infestation is worse. Quizalofop-resistant rice technology is perceived to be the solution for the resistant weedy rice problem, but the CEAs cited low yield of the current varieties as a significant limitation. This can be overcome in a short period, as was the case with the evolution of IMI-resistant rice varieties (Burgos et al. Reference Burgos, Norsworthy, Scott and Smith2008).
County Extension agents’ perspectives on the weedy rice problem in their respective counties in Arkansas and the Missouri Bootheel, USA, 2020.

a This survey represented 17 of 32 rice-producing counties in the Arkansas Delta and River Valley and 7 of 10 rice-producing counties in the Missouri Bootheel, USA.
Within a broader perspective, the CEAs estimated an average of 39% of rice fields in their counties had weedy rice (Table 12); the majority (almost 60%) did not have weedy rice. Considering that nearly 100% of respondents had planted HR rice, the large proportion of clean fields indicates that many farmers are managing weedy rice successfully. This bodes well for the continuous integration of HR rice technology into best management practices for rice. On closer inspection, one-half of the respondents estimated 10% to 30% of fields had weedy rice infestations, while roughly one-third reported >50% of fields were infested, with the highest observed being 90%. This echoes the perspectives of producers and consultants that weedy rice is still a major weed problem—one for which we need to continue finding solutions. Where weedy rice was present, the level of infestation was mostly deemed low (1 to 10 plants 100 m−2) to moderate (11 to 20 plants 100 m−2). High levels of infestation (>20 plants 100 m−2) were reported in up to 40% of fields in seven counties. On average, 17% of fields were reported to have high weedy rice infestations.
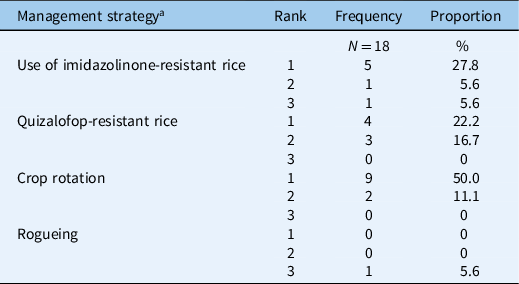
From what the CEAs have seen across years of visiting rice fields and working with rice growers, crop rotation is the most effective tool to manage weedy rice (Table 13), in accordance with the responses of producers and consultants. IMI-resistant rice technology (Clearfield®; FullPageTM- RiceTec Inc., Alvin, TX, USA) came in a close second. Where IMI-resistant rice was ranked second or third, it was because of the increase in IMI-resistant weedy rice populations. Where crop rotation was ranked second, it was because the field situation was not conducive for crop rotation. Despite the low yield potential of current quizalofop-resistant rice varieties, this technology was still ranked first or second by 39% of CEA respondents, indicating a great perceived need for another HR rice technology or other effective and economical tool for weedy rice management. Rogueing is effective, but not economical or efficient; only one CEA respondent mentioned this as a strategy to manage weedy rice.
The most effective strategies for weedy rice management in the county, based on the County Extension agents’ perspectives in Arkansas and the Missouri Bootheel, USA, 2020.

a The survey represented 17 counties in Arkansas and seven counties in the Missouri Bootheel, USA.
In conclusion, weedy rice remains a major problem in rice production. Three in four fields reported by growers/consultants have some level of weedy rice infestation, but this infestation is mostly light, averaging 2 plants m−2 among reported fields. This level of infestation is manageable. Occasionally, there are cases of severe infestations that force producers to plant other crops. Soybean is the most feasible “clean-up” crop for weedy rice and the most frequently used rotational crop. After two decades of adoption, HR rice remains highly popular. The utility of IMI-resistant rice technology has been compromised in several fields due to the occurrence of HR weedy outcrosses and volunteers, but the IMI-resistant rice technology remains the most valuable tool to manage weedy rice. Producers eagerly await better quizalofop-resistant varieties to alleviate the IMI-resistant weedy rice problem. Respondents perceive the role of HR rice technology in effective, integrated weed management to be important. One global challenge for the sustainable adoption of HR rice technology is implementing reduced frequency of HR rice in the cropping system, although the relationship between weedy rice infestation and frequency of planting HR rice is not clear in this survey. To clarify this relationship, a follow-up weedy rice survey is needed to focus on HR rice adoption, specific weed management programs used season-long with HR rice, and number of years in soybean rotation in the last 5 yr. Despite the unknown response rate for this survey, the data obtained generally reflect prior reports and what has been observed across Arkansas and adjoining rice production areas. The responses from CEAs also supported or complemented those of the producers and consultants.
Acknowledgments
We thank the CEAs of Arkansas, USA, who assisted in contacting rice growers and/or for participating in the CEA survey. They serve a multitude of roles in the county, so taking time to facilitate and participate in the survey is greatly appreciated. We also thank James Heiser, Senior Research Associate–Weed Science of the University of Missouri, for representing the Missouri Bootheel area, and Richard Costello, consultant in Arkansas and Louisiana, for providing information across four parishes in Louisiana. We thank Jarrod Hardke for providing the summary statistic of rice hectares from his publication. The authors declare no conflict of interest.
Supplementary material
To view supplementary material for this article, please visit https://doi.org/10.1017/wsc.2021.45