
Introduction
Infrared (IR) spectrum that spans from 2 to 20 µm wavelength range is an important part of the electromagnetic spectrum for many applications. Within this band, only two atmospheric transparent windows (e.g. 3–5 µm (Mid Wavelength (MW)-IR) and 8–14 µm (Long Wavelength (LW)-IR)) are usable due to earth's atmospheric absorption.[Reference Rogalski1] Thermal imaging application in the MW-IR band has received a lot of attention not only for security and military usage but also for commercial uses such as automobile industry and unmanned aerial vehicle.[Reference Kvisteroy, Jakobsen, Vieider, Wissmar, Ericsson, Halldin, Niklaus, Forsberg, Stemme, Kallhammer, Pettersson, Eriksson, Franks, VanNylen, Vercammen and VanHulsel2–Reference Zhou, Mayyas, Qattawi and Omar7] An uncooled detector such as thin-film micro-bolometer and ferroelectric detector dominates the majority of the commercial market. However, their detectivity is low (~2 × 108 cm·Hz1/2/W) and has slow response time (in milliseconds).[Reference Rogalski1] Cooled HgCdTe (MCT) detector is the major industry player in the LW-IR and Very LW-IR (12–18 µm) wavelength range. However, its reproducibility and yield in material growth pose a major issue in producing large MCT array.[Reference Lei, Antoszewski and Faraone8] Quantum-well IR photodetectors (PD) could overcome this due to the mature GaAs and AlGaAs growth technology. However, it has lower quantum efficiency and suffers high thermal generation rate associated with the intersubband transitions and hence could not operate at a temperature as high as that of MCT detector.[Reference Tidrow, Beck, Clark, Pollehn, Little, Dhar, Leavitt, Kennerly, Beekman, Goldberg and Dyer9] InAs(Bi,Sb)-based III–V material systems are the alternative candidate materials for IR detector. For example, the energy bandgap of 0.1 eV (λ = 12.4 µm) and 0.26 eV (λ = 4.8 µm) were reported in InAs0.54Sb0.46 and InAs0.963Bi0.037 alloys, respectively.[Reference Sarney, Svensson, Xu, Donetsky and Belenky10, Reference Okamoto and Oe11] Valence band anti-crossing model predicted an energy band gap of 0.11 eV (λ = 11.3 µm) for InAs0.95Bi0.05 alloy.[Reference Samajdar and Dhar12] The lattice constant of InAs(Bi,Sb) is close to that of InAs (or GaSb). Therefore, it can be grown on InAs or GaSb by utilizing the standard method of layer buffering (abrupt/graded approach). In addition, it uses the same epitaxy growth technology as that of the existing III–V epitaxy.
Recently, an integration of LWIR PD on Si substrate application using a combination of wafer bonding and removal of the native substrate through chemical etching process has been reported.[Reference Zhang, Haddadi, Chevallier, Dehzangi and Razeghi13] While high-performance IR PD directly grown on Si remains a challenge, there is always the motivation to have access to a larger wafer to improve throughput and lower cost. In this paper, we present an epitaxy growth and characterization of InAs PD on a Si substrate through Ge/Si and GaP/Si virtual substrates. The work presented here aims to show viability and the effect of different virtual Si substrates on the InAs material quality and the device performance the InAs PD. Both type of virtual substrates can be used as a starting substrate for the growth of III–V layer. They are available commercially in large wafer size (>200 mm). The Ge layer in Ge/Si substrate is the initial buffer layer to accommodate the large lattice mismatch between III–V and Si semiconductor. The GaP layer in GaP/Si substrate is the buffer layer for the transition from non-polar to the polar semiconductor in the case of GaP/Si substrate. Due to the low defect density in the Ge (and GaP) layer, high performance electronic and photonic devices have been demonstrated.[Reference Yadav, Tan, Kumar, Goh, Liang, Yoon, Gong and Yeo14–Reference Huang, Song, Masuda, Jung and Lee22] Hence, the epitaxy growth of narrow bandgap III–V on large virtual Si substrate could potentially provide the materials needed for the future third-generation IR PD[Reference Rogalski, Antoszewski and Faraone23] which dictates low-cost, high uniformity, and high resolution. Ion exchange methods[Reference Tan, Jia, Loke, Wicaksono and Yoon24, Reference Loke, Tan, Li, Wicaksono and Yoon25] will be used here for epitaxy growth of InAs buffer and device layers. This method could allow an abrupt change of lattice constant without introducing strain in the epitaxial layer at the extremely thin buffer.
Experiment, results, and discussion
Epitaxy growth
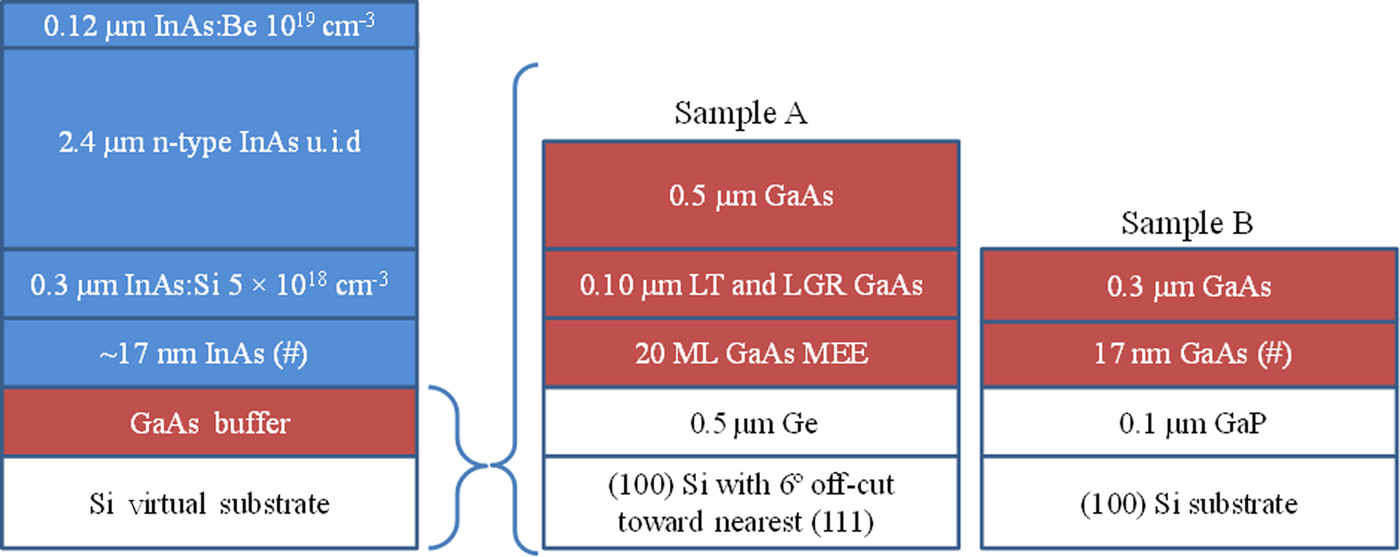
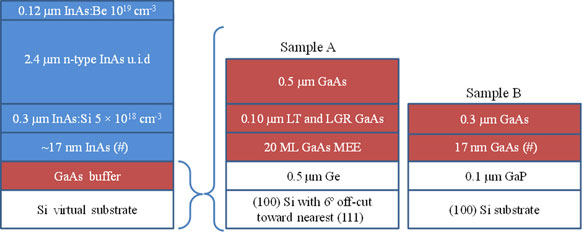
In this experiment, two types of virtual substrates were used to enable the epitaxy growth of InAs material on Si, (1) a Ge/Si substrate, and (2) a GaP/Si substrate. In the Ge/Si substrate, the (100) oriented Si substrate has a 6° offcut towards <111>, whereas in GaP/Si substrate, the Si is exactly (100) oriented. Ge/Si substrate and GaP/Si were used as the virtual substrates in Sample A and Sample B, respectively. All the layers on top of the Ge and GaP layers were grown using solid-source molecular beam epitaxy equipped with ultra-high purity indium (In), gallium (Ga), valved cracker phosphorus (P), and valved cracker arsenic (As) sources. In Sample A, prior to the growth of GaAs, the Ge/Si substrate was heated to 650°C for 20 min for double atomic step formation to suppress formation of anti-phase domain defects in GaAs layer. Subsequently, the substrate was cooled to 250°C. This was followed by the growth of 20 monolayers (MLs) of GaAs using migration-enhanced epitaxy technique. The substrate temperature was then raised to 330°C under As environment. This was followed by a 0.10 µm GaAs deposition at the rate of 0.1 µm/h, after which the growth was interrupted to raise the substrate temperature to 580°C. This was followed by a growth of 0.50 µm thick GaAs. At the end of the GaAs growth, the Ga supply was cut off (Ga shutter close) and the supply of As continued. During this time, the substrate temperature was lowered to 500°C. When the substrate reached 500°C, the As supply was cut off (As valve fully closed) for 3 min. The reflection of high-energy electron diffraction (ED) recorded a (2 × 4) reconstruction indicative of As-stabilized surface. The substrate temperature was then lowered to 330°C in preparation for cation exchange from Ga to In. At this temperature, the growth of InAs was commenced by the introduction of In atoms first followed by As2. This was done by opening the In shutter 5 s (at a rate of 0.1 ML/s) before the opening of the As valve. In the 5-s interval, the In atoms formed approximately half a MLs of InAs. Here, the growth has changed from GaAs to InAs where the Ga ion was replaced by In ion (GaAs→InAs cation exchange). The growth of InAs continued until about 17 nm of InAs had grown. This was followed by a growth interruption in which the In supply was terminated. During this growth interruption, the substrate temperature was raised to 400°C in preparation for subsequent growth of InAs PD layers. The As2 supply was maintained at this time to prevent desorption of arsenic from the InAs surface. The growth of InAs PD was started with the growth of 0.30 µm n-type InAs. This was followed by the 2.4 µm unintentionally doped (u.i.d.) InAs layer. Finally, the layers are capped with 0.12 µm thick p-type InAs layer.
In Sample B, prior to the growth of GaAs, the GaP/Si substrate was heated to 650°C to remove surface oxide under phosphorus environment. After this, the substrate temperature was lowered to 600°C. This was followed by a growth of 0.10 µm thick GaP buffer layer. The growth was then interrupted by closing Ga shutter (keeping P valve open) and the substrate temperature was lowered to 550°C. At the substrate temperature of 550°C, P valve was fully closed for 2 min. Subsequently, the substrate temperature was lowered further to 330°C in preparation for GaAs growth. The GaAs growth was started by opening the Ga shutter 5 s (at a rate of 0.1 ML/s) before the opening of the As valve. The sequence is similar to that of InAs growth on GaAs described in Sample A except that the exchange involves P to As instead. (GaP→GaAs anion exchange). The growth of GaAs continued after the opening of As valve until about 17 nm of GaAs was grown. After this, the growth was interrupted and the substrate temperature was increased to 550°C. This was followed by a growth of 0.30 µm thick GaAs, after which the growth was interrupted and substrate temperature was lowered to 500°C for the growth of InAs layer using the same cation exchange as in Sample A. The subsequent growth sequence and conditions of InAs p-i-n PD for Sample B are identical to Sample A. Details of the layer structure are shown in Fig. 1.
Identical layer structure of InAs p-i-n photodetector grown on Ge/Si (Sample A) and GaP/Si (Sample B) substrates. (# denotes the ion exchange step). Different nucleation schemes for each substrate were depicted next to the InAs photodetector diagram. LT = low temperature and LGR = low growth rate.

Reciprocal space maps
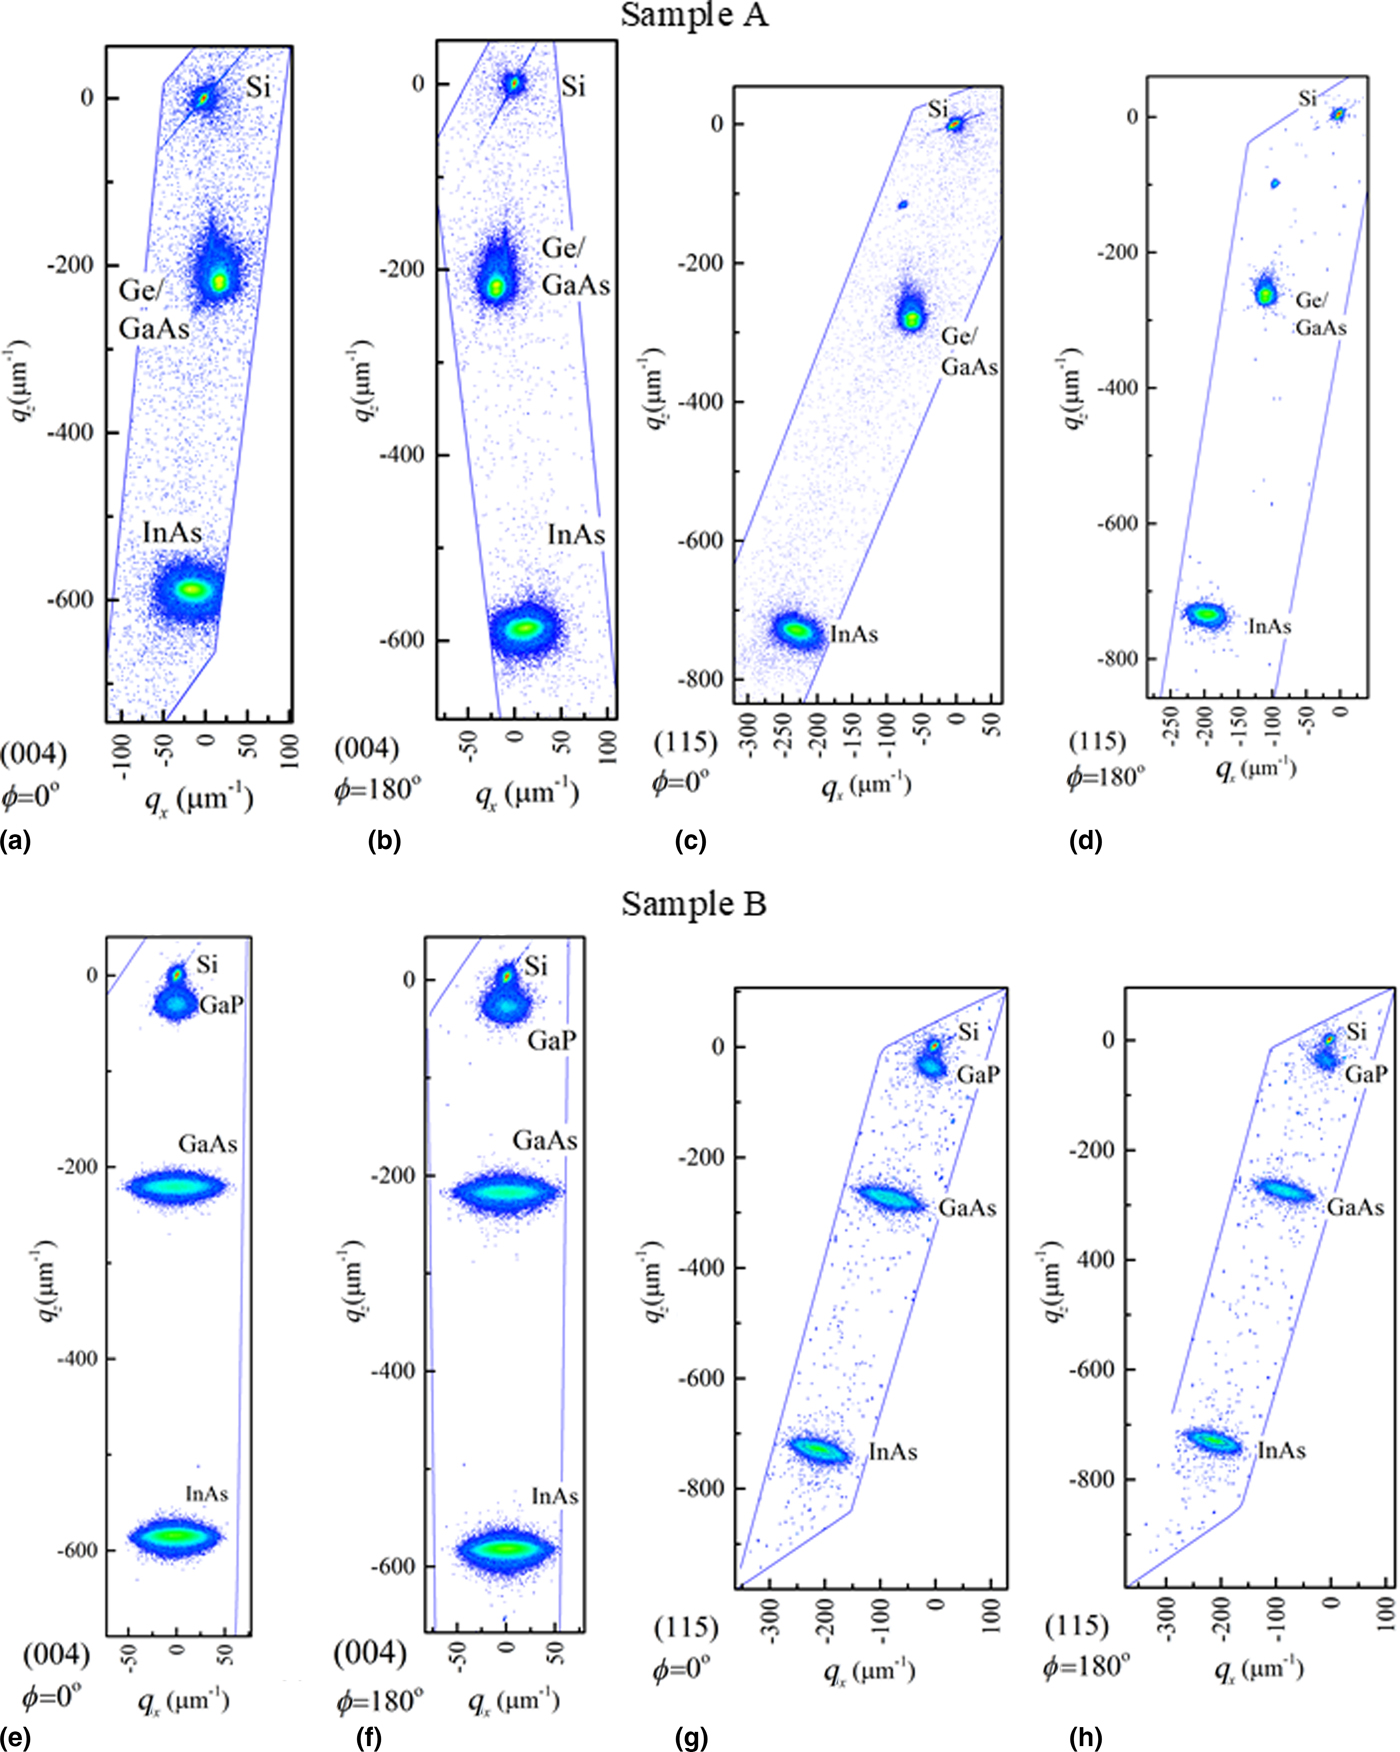
An x-ray diffractometer was used in high-resolution reciprocal space maps (RSM) measurement. The RSM were recorded by scanning a series of sample and detector angular positions. Figures 2(a)–2(b) and Figs. 2(e)–2(f) show the symmetrical (004) RSM of Sample A and Sample B, respectively. As shown in Figs. 2(a)–2(b), an epilayer tilt is present in the InAs layer grown on Ge/Si substrate. In comparison, the InAs layer grown on GaP/Si substrate shows no evidence of epilayer tilt as indicated in Figs. 2(e)–2(f). Notwithstanding, an epilayer tilt is not known to affect the performance of a top-illuminated PD. Figures 2(c)–2(d) and Figs. 2(g)–2(h) shows the asymmetrical (115) RSM of Sample A and Sample B, respectively. The in-plane (ε ||) and out-of-plane (ε ⊥) misfits are defined as follows:
 $$\varepsilon _\parallel = \displaystyle{{\vert {\Delta q_{x,\lsqb {115} \rsqb }} \vert } \over {q_{x,\lsqb {115} \rsqb \; {\rm Si}} + \vert {\Delta q_{x,\lsqb {115} \rsqb }} \vert }} $$
 $$\varepsilon _ \bot = \displaystyle{{\vert {\Delta q_{z,\lsqb {115} \rsqb }} \vert } \over {q_{z,\lsqb {115} \rsqb \; {\rm Si}} + \vert {\Delta q_{z,\lsqb {115} \rsqb }} \vert }} $$
 $$\Delta q_{x/z,\lsqb {115} \rsqb } = q_{x\; /z,\lsqb {115} \rsqb \; {\rm InAs}} - q_{x/z,\lsqb {115} \rsqb \; {\rm Si}}$$
 $$R\% = \displaystyle{{a_{{\rm l},\; {\rm InAs}}} \over {a_{{\rm o},\; {\rm InAs}}}} \times 100$$
Reciprocal Space Mapping of Sample A: (004) at ϕ = 0° and 180° azimuth, (a) and (b), respectively. (115) at ϕ = 0° and 180° azimuth, (c) and (d), respectively. Reciprocal Space Mapping of Sample B: (004) at ϕ = 0° and 180° azimuth, (e) and (f), respectively. (115) at ϕ = 0° and 180° azimuth, (g) and (h), respectively.

where q x /z,[115] InAs and q x/z,[115] Si are the reciprocal lattice positions of InAs and Si peaks, respectively.  $R\% $ is the relaxation in percentage. By using the equation above, the lattice parameter of the epitaxially grown InAs layer (a l,InAs) can be determined and compared with that of the natural InAs lattice constant (a o,InAs = 6.0585 Å). The in-plane to out-of-plane ratios
 $(\varepsilon _\parallel /\varepsilon _ \bot )$ for Sample A and Sample B are 1.019 and 1.016, respectively. The lattice parameters of InAs layer in Sample A and Sample B are 6.0542 Å and 6.0562 Å, respectively. This corresponds to relaxation of 99.93% and 99.96% in Sample A and Sample B, respectively. This indicates that the InAs layers in both samples have very similar residual strain in the crystal lattice.
Cross-sectional transmission electron microscopy
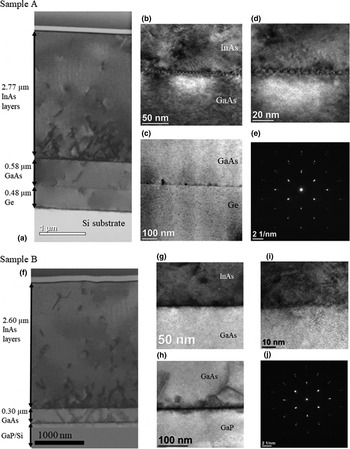
Cross-sectional transmission electron microscopy (TEM) was performed on both samples to examine the interface and bulk layer crystal quality at the PD and buffer region. Figure 3 shows the cross-sectional TEM of Sample A and Sample B. As shown in Fig. 3(a), no threading dislocation (TD) is observed in the Ge layer propagating from Si substrate. High-resolution TEM at the GaAs/Ge interface in Fig. 3(c) shows good GaAs crystal quality with no anti-phase domain defects. However, at the beginning of the InAs/GaAs interface where the ion exchange (Ga to In) was introduced, high density of TDs was observed. High-resolution TEM of the InAs/GaAs interface [Figs. 3(b) and 3(d)] shows an interface with periodic structure but no evidence of long-range interfacial misfit which involves periodic 90° misfit dislocation. This implies that a significant part of the relaxation process occurs through 60° misfit dislocation. Notwithstanding, ED in Fig. 3(e) indicates single crystalline InAs and GaAs and the density of TD gradually reduces with InAs thickness as shown in Fig. 3(a).
Cross-sectional TEM of Sample A, (a). TEM micrograph of Sample A at InAs/GaAs and GaAs/Ge interfaces, (b) and (c), respectively. High-resolution TEM scan at InAs/GaAs interface, (d) and its electron diffraction pattern, (e). Cross-sectional TEM micrograph of Sample B, (f). TEM micrograph of Sample B at InAs/GaAs and GaAs/GaP interfaces, (g) and (h), respectively. High-resolution TEM scan at InAs/GaAs interface, (i) and its electron diffraction pattern, (j).

As shown in Fig. 3(f), misfit TDs are formed in the GaAs buffer layer after the first ion exchange at the GaAs/GaP interface. However, these dislocations cease to propagate at the InAs/GaAs interface after the second ion exchange was introduced. The large strain in the InAs layer could have overwhelmed the residual strain originated from the GaAs layer. Similarly, high density of TDs is observed in the lower part of the InAs PD layers. The InAs and GaAs are single crystalline as shown in Fig. 3(j). The TD density also reduces when the InAs becomes thicker.
Surface morphology
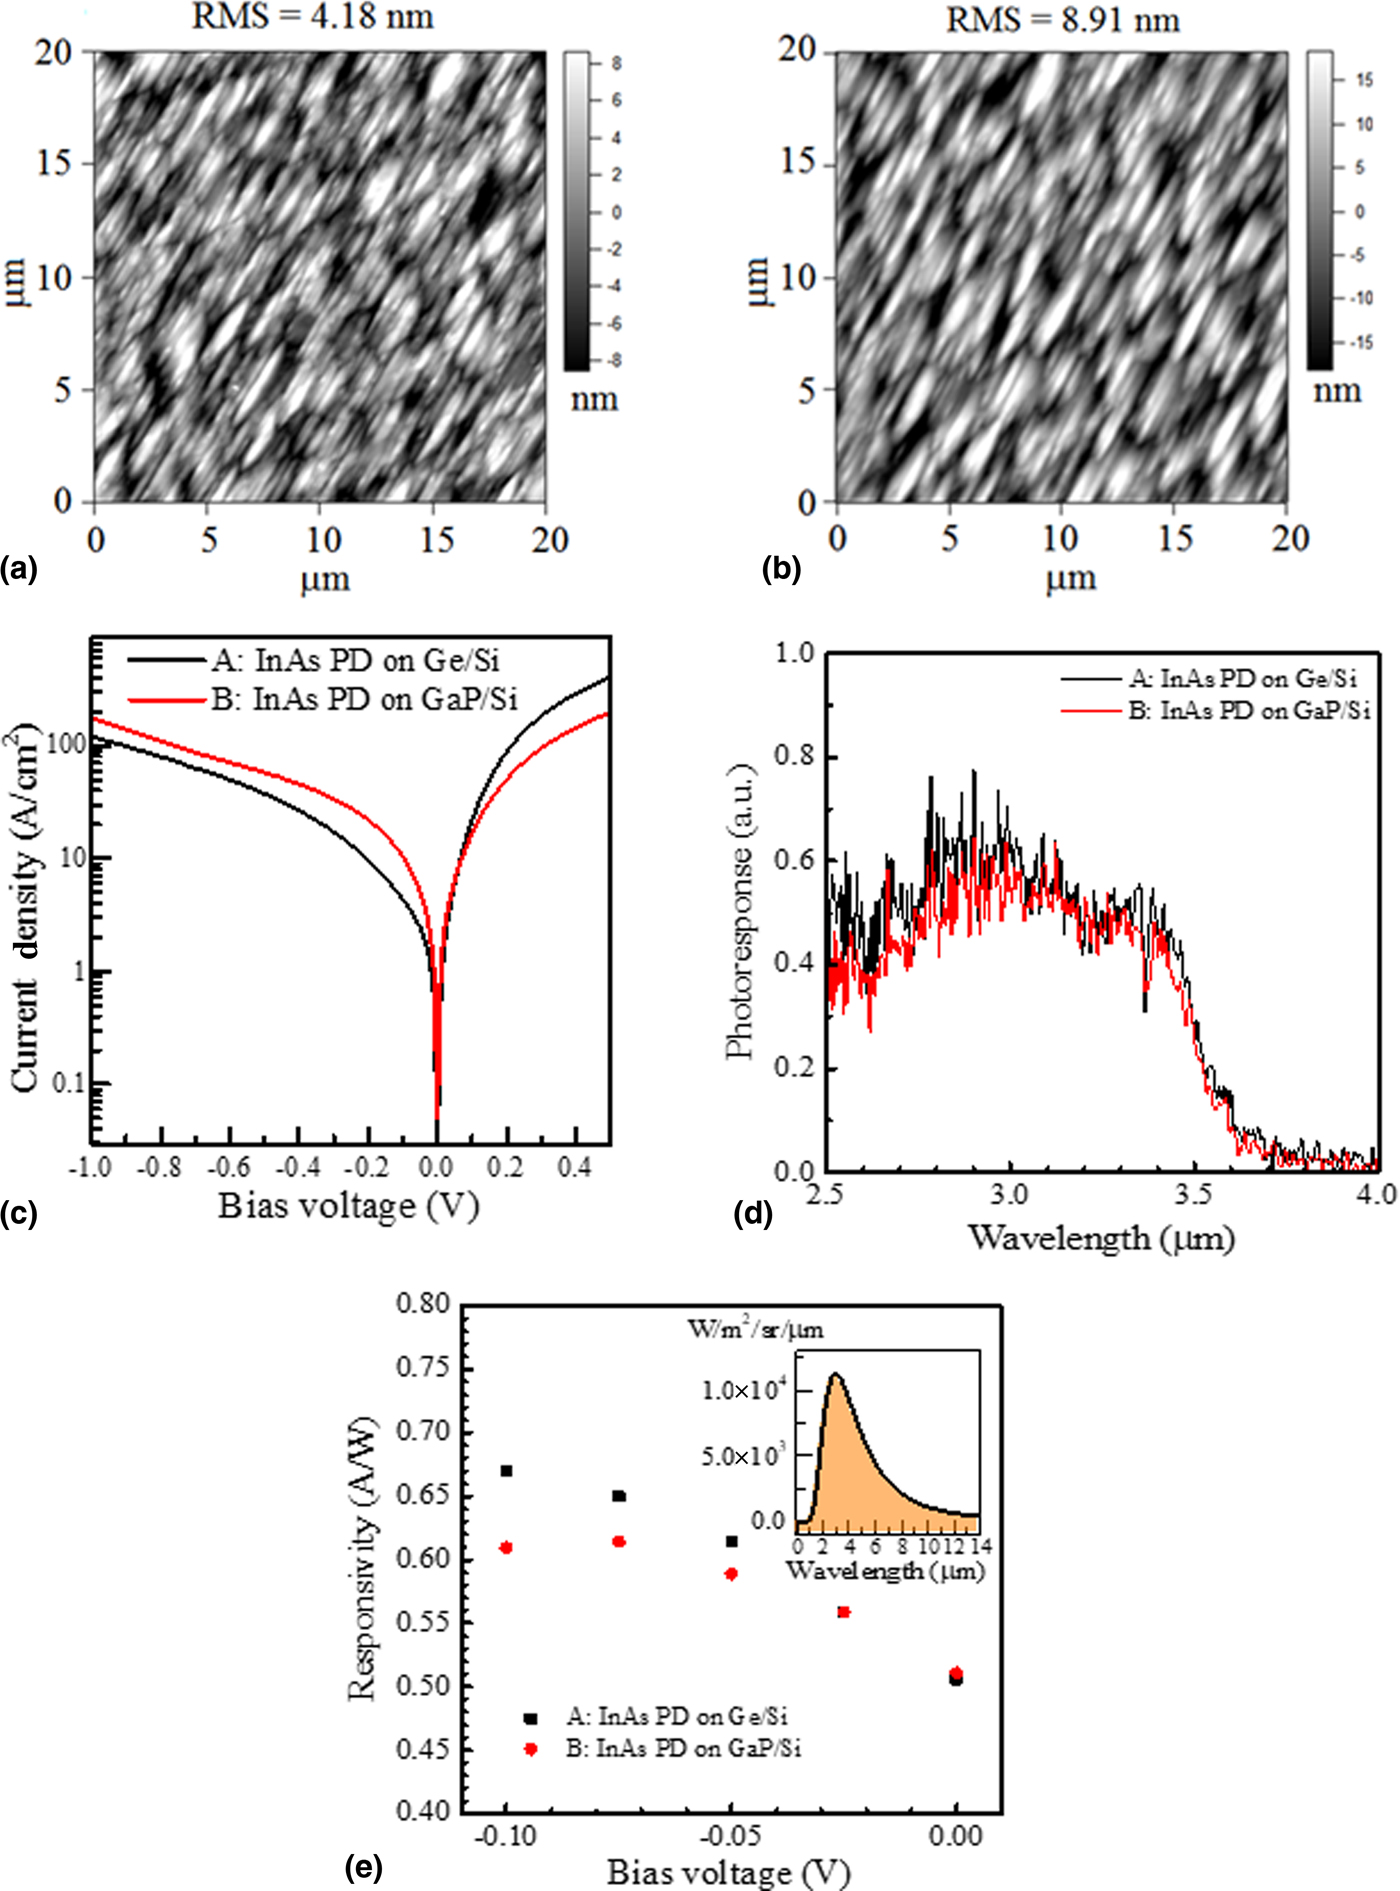
Atomic force microscopy was used to examine the surface morphology of the InAs layer. As shown in Figs. 4(a)–4(b), the surface roughness of InAs grown on GaP/Si substrate is about 2 × of the surface roughness of InAs grown on Ge/Si substrate. This could be associated with surface undulation that has occurred during the ion exchange step. Full relaxation at the ion exchange interface is difficult to achieve. This could have caused the strain relief to occur through surface undulation. There are two ion exchange steps during the growth on GaP/Si, thus the surface of InAs is rougher compared with that of Ge/Si.
Atomic force microscope image of InAs top surface grown on Ge/Si substrate, (a) and GaP/Si substrate, (b). The surface roughness in RMS of InAs grown on Ge/Si and GaP/Si substrate is 4.18 nm and 8.91 nm, respectively. Non-illuminated I–V curves of Sample A and B, (c). Room-temperature photoresponse of Sample A and B. Cutoff wavelength is 3.5 µm, (d). Responsivity measured using blackbody light source at 700°C under different (reverse) bias voltage, (e). Inset: Blackbody radiation spectrum at 700°C.

PD: non-illuminated current-voltage (I–V) characteristics, spectral photoresponse, and response to blackbody radiation
Standard photolithography technique was used to process Samples A and B into top-illuminated InAs PD. The non-illuminated current-voltage characteristic of the both InAs PD is shown in Fig. 4(c). The InAs PD grown on GaP/Si at negative bias (reverse bias) has higher non-illuminated (dark) current density compared with that of InAs PD grown on Ge/Si. This indicates that the generation current in InAs PD grown on GaP/Si is higher than that of InAs PD grown on Ge/Si. This could be due to higher mid-gap traps induced by defects in the i-layer of the InAs PD.
A Fourier Transform Infrared (FTIR) spectrometer with a KBr beam splitter was used to measure the spectral photoresponse of the PD at room temperature. The photoresponse of the PD is shown in Fig. 4(d). As expected, the cutoff wavelength of both InAs PDs is at 3.5 µm, which corresponds to the InAs energy bandgap of 0.35 eV.
A blackbody light source maintained at a temperature of 700°C was used to measure the responsivity of Samples A and B. Figure 4(e) shows the room temperature PD responsivity at a different reverse bias voltage. The inset shows the blackbody radiation spectrum at 700°C. Both samples have approximately the same responsivity of 0.51 A/W at zero bias voltage (photovoltaic (PV) mode). The responsivity of Sample A and Sample B increases up to 0.67 A/W and 0.61 A/W, respectively when a reverse-biased voltage is increased to −0.10 V. This is due to the increase of photon absorption when the space-charge region is widened under higher reverse bias. At room temperature, the PD resistances at zero bias for Sample A and Sample B are 0.017 Ω cm2 and 0.016 Ω cm2, respectively. By using
 $$D^* = R_{\rm p}\left( {\displaystyle{{R_{\rm o}A} \over {4kT}}} \right)^{1/2},$$
where k is Boltzmann's constant and T is the device temperature. R p, R o, and A are the responsivity, resistance at zero bias and device area, respectively. Hence, the estimated blackbody specific detectivity for Sample A and Sample B is 5.2 × 108 cm·Hz1/2/W and 5.1 × 108 cm·Hz1/2/W, respectively. The detectivity is lower than the commercial InAs PD grown on native InAs substrate in the market (~5 × 109 cm·Hz1/2/W), but it is slightly higher than bolometer sensor with D* of typically ~2 × 108 cm·Hz1/2/W.[Reference Rogalski1] Under the current growth condition, the performance of the PD was not significantly affected by the type of virtual Si substrate used.
Conclusion
We have demonstrated room-temperature working InAs p-i-n PD on Ge/Si and GaP/Si virtual substrates with blackbody responsivity of about 0.51 A/W (PV mode). The result shows that the type of virtual substrate has no significant influence on the blackbody specific detectivity of the InAs p-i-n PD grown using ion exchange method. High densities of TD near the InAs/GaAs and GaAs/GaP interfaces which can be reduced with an increase in InAs thickness. This method will be useful in the epitaxy growth of InAs(Bi,Sb) material on Si substrate for future monolithic integration of MW-IR and LW-IR sensor with Si-based electronics.
Acknowledgement
This work was supported by the Singapore National Research Foundation through the Competitive Research Program (Grant No: NRF-CRP6-2010-04).