Seeing with light
Seeing is a commonly used word that we tend to take for granted, however it carries a wide variety of meanings. There is the ability to see with one’s eyes, to discern visually, the act of detecting the scene. There is also the ability to discern mentally after digesting the scene, to understand, as in the phrase “I see what you mean.” Another one that is especially relevant to the transmission electron microscope (TEM) is to see below the surface, which in everyday usage means to see all the ramifications of an issue and understand it in depth. In a similar vein, transmission electron microscopy “sees into” the bulk of a material, whereas scanning electron or scanning probe microscopies mostly “see” the surface.
From the days of Anton van Leeuwenhoek in the Netherlands and Robert Hooke in the United Kingdom, both scientists and non-scientists alike have been fascinated by the optical microscope’s ability to see details that are invisible to the naked eye. As lenses improved, not only were smaller things made visible, but an understanding of the limits to resolution gradually grew. First was the realization that light has many colors, and simple lenses focus each color differently, a problem that was alleviated with the invention of the achromatic lens by Chester Moore Hall around 1730. The geometrical optics limit to resolution took almost another 150 years to appreciate, however. Ernst Abbe (1873)Reference Abbe1 first realized the role of the lens aperture in defining resolution by analogy with the action of a diffraction grating. If the diffracted light did not enter the aperture of the imaging lens, the grating could not be resolved. His famous formula states resolution is proportional to wavelength divided by numerical aperture. General objects could be viewed as an assembly of diffraction gratings of different sizes and spacings.
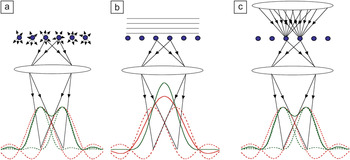
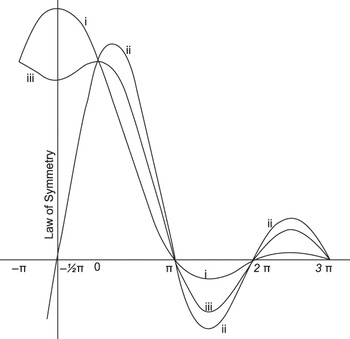
A major advance in the understanding of image contrast came from Lord Rayleigh,Reference Rayleigh2 who explained the role of coherence in optical microscopy. If an object is self-luminous, light emitted from different atoms will be incoherent (i.e., each emitted photon will have a random phase), and all we need to consider is the intensity distribution, as shown in Figure 1a. If, however, we need to illuminate an object, then there are two limiting situations referred to as coherent or incoherent imaging. For a nearly parallel beam (such as from a point source far away), as shown in Figure 1b, neighboring points on the object will be illuminated by wavefronts equal in phase. The images of the two points will also be in phase, and we must sum amplitudes before taking the square to find the intensity. This means that the light from the two points will interfere, and the resulting image is said to be coherent. As seen in Figure 1b, adding the amplitudes leads to a broad amplitude distribution that does not resolve the objects, and therefore neither does the intensity. Lord Rayleigh demonstrated this by taking two point sources and spacing them such that the peak in the intensity distribution of one image lies at the first zero in the intensity distribution of the other, a condition that has become known as the Rayleigh resolution limit. His original diagram is reproduced in Figure 2.Reference Rayleigh2 In the case of incoherent imaging (curve iii), a dip is seen in the image of the two points—they are defined as resolved. In the case of coherent imaging, for in-phase points (curve i), no such dip is present—they are unresolved.
Coherent and incoherent imaging with light. (a) With a self-luminous source, each point in the object emits light with no phase correlation to neighboring points. In the image, the amplitude distributions from each point (red dashed lines) can therefore be squared independently to give separate image intensity contributions for each point (green dashed lines). Adding these gives the total image intensity (green solid line); the two points are resolved. (b) If the object is illuminated by coherent light, the image amplitudes are always in phase and must be summed (red solid line) before squaring to give the intensity. The two points are not resolved. (c) Illuminating with a range of angles provides a close approximation to incoherent imaging.

The Rayleigh resolution criterion. The amplitude distributions of two point objects emitting in phase (curve i, unresolved) and in random phase (i.e., incoherently, curve iii, resolved). Curve ii is for two objects emitting in antiphase (always resolved but not achievable practically). The vertical axis is intensity, the horizontal axis represents distance. Reproduced with permission from Reference 2. © 1896 Taylor and Francis.

Lord Rayleigh also realized that incoherent imaging avoided artifacts caused by interference effects. He stated, “It seems fair to conclude that the function of the condenser in microscopic practice is to cause the object to behave, at any rate in some degree, as if it were self-luminous, and thus to obviate the sharply-marked interference bands which arise when permanent and definite phase relationships are permitted to exist between the radiations which issue from various points of the object.”Reference Rayleigh2 The situation is shown schematically in Figure 1c. Using a condenser lens to increase the range of angles illuminating the object provides a good approximation to incoherent imaging in which the image intensity is a direct reflection of the object.
Seeing with electrons
Optical wavelengths are several orders of magnitude too large to resolve atoms, but it was realized very soon after the invention of the TEM by Ernst Ruska and Max Knoll in 1931Reference Knoll and Ruska3 that electron wavelengths were in fact much smaller than atomic dimensions. To quote Manfred von Ardenne, inventor of the first scanning transmission electron microscope (STEM), from 1939, “sooner or later the ultramicroscopy technique will be able to reveal single atoms and their distribution in the object plane.”Reference von Ardenne4 However, sooner was not to be. Von Ardenne rapidly abandoned his STEM in favor of the Ruska TEM design because of the difficulty in producing a small scanning probe with enough current to give a discernible image. The TEM did not require a small probe, rather it focused a parallel beam onto a large area of the sample, and the transmitted electrons were subsequently imaged onto a screen to form the image. This, however, is a coherent imaging situation, just as in the case of light illumination (Figure 1b). In the next few decades, resolution improved and eventually atomic resolution was achieved.Reference Smith5 However, interpretation of the images was not necessarily trivial since in a coherent image, atoms could be black or white depending on the microscope focus, specimen thickness, and atomic number. Image interpretation generally needed image simulations, and simulations required model structures. Thus, interface structures could not be seen in the sense of being discerned directly from the image. Instead, likely model structures had to be constructed, their images simulated, and the best fit presumed to be the actual structure.
Everything changed with the invention of the field emission STEM by Albert Crewe, though not overnight by any means. In his classic paper, “Scanning Electron Microscopes: Is High Resolution Possible?”Reference Crewe6 he advocates the STEM as the instrument of choice for atomic resolution imaging for several reasons. First, the resolution controlling optics are before the sample, and therefore after the beam has passed through the sample, a set of detectors can be used simultaneously to collect electrons scattered to different angles through different energy losses. The availability of all these modes, he anticipated, would lead to more complete information about the specimen. Furthermore, in a STEM, the post-specimen optics do not degrade the image resolution, which is controlled by the incident probe. Crewe attacked the problem of low beam current by using a field emission gun—an electron gun that uses an electrostatic field to literally drag electrons from a small tungsten tip, generating a beam brightness that is orders of magnitude greater than the usual electron sources of the time, which heated the tip to cause electron emission. (Much more recently, high brightness thermal sources have been reported, but they still have higher energy spread than the cold field emission source.Reference Müller, Uhlemann, Hartel and Haider7)
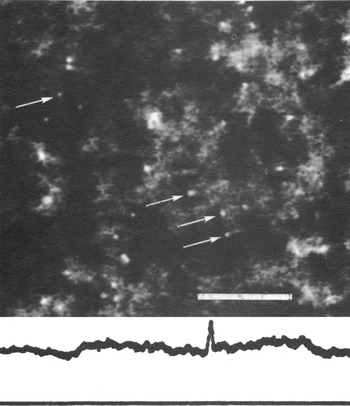
The success of the Crewe microscope was spectacular. Figure 3 shows an image revealing single atoms recorded with an annular detector placed around the transmitted beam (annular dark field [ADF] imaging),Reference Wall, Langmore, Isaacson and Crewe8 a geometry that provided very efficient detection of scattered electrons. While atoms had been discerned in field ion microscopes some years earlier,Reference Müller9 Crewe’s images of individual atoms were the first ever seen in an electron microscope. The ADF detector collected electrons scattered from the atomic nucleus, Rutherford scattering, with a cross-section proportional to Z2. Hence atoms of different atomic number could be easily distinguished (Z-contrast).Reference Isaacson, Kopf, Ohtsuki and Utlaut10 Even atomic diffusion could be studied.Reference Isaacson, Kopf, Utlaut, Parker and Crewe11 Electrons passing through the central hole in the ADF detector could be analyzed using electron energy-loss spectroscopy (EELS) allowing, for instance, the identification of different nucleic acid bases.Reference Crewe, Isaacson and Johnson12 For a review of this remarkable era, see the article by Peter Hawkes.Reference Crewe13
Annular dark field image of a sample of mercuric acetate showing individual atoms with a line trace across a single atom showing a full width half maximum of 2.5 ± 0.2 Å. Scale bar is 50 Å. Reproduced with permission from Reference 8. © 1974 National Academy of Sciences.

The Crewe images showed all the characteristics of an incoherent image, a resolution as expected on the basis of the probe intensity profile (not the amplitude profile) and freedom from contrast reversals, which was also understood from a theoretical point of view.Reference Engel, Wiggins and Woodruff14 But single atoms are a very unusual kind of object, and assembling them into materials leads to many more complex effects, in particular, coherent diffraction and channeling effects, and early attempts to use the Crewe approach for materials proved quite disappointing.Reference Donald and Craven15
Seeing into materials
One of the earliest commercial STEMs was installed in 1974 at the Cavendish Laboratory, University of Cambridge, in the group led by Archie Howie and Mick Brown. I was enticed by this machine to do my PhD under their supervision, however, my research was on cathodoluminescence, not Z-contrast imaging. My colleague, Mike Treacy, was doing his PhD on imaging catalyst particles and was finding that diffraction contrast (due to defects and orientation changes) was at least as strong as Z-contrast (from changes in composition), greatly complicating image interpretation. He proposed increasing the inner angle of the annular detector, as at high angles, incoherent Rutherford scattering replaces the coherent diffracted beams, and one would therefore expect the image to be more incoherent and have more Z-contrast and less diffraction contrast.Reference Treacy, Howie and Wilson16 High-angle scattering did not make it through the narrow bore of the specimen holder used at the time, and so my cathodoluminescence detector was modified instead, to become the first high-angle annular dark field (HAADF) detector,Reference Treacy, Howie, Pennycook and Mulvey17 which was my introduction to the Z-contrast technique.
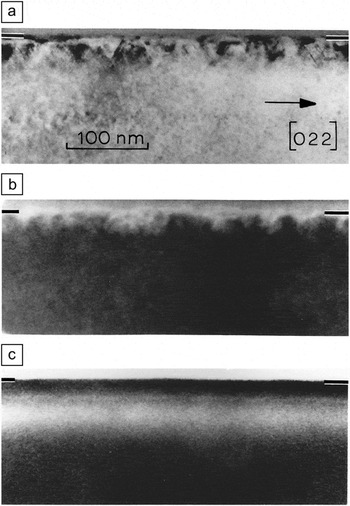
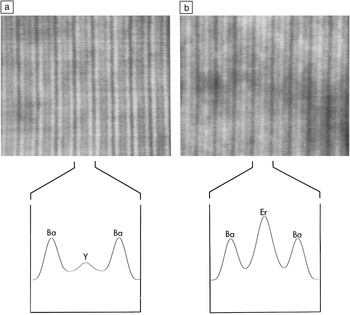
Now cathodoluminescence is an incoherently generated signal,Reference Pennycook and Howie18 depending directly on beam intensity, and therefore will give an incoherent image. High-angle Rutherford scattering comes from each atomic nucleus and is also generated in proportion to the electron beam intensity in its vicinity, another incoherent image. After joining Oak Ridge National Laboratory in 1982, I began to explore the possibility of atomic resolution incoherent imaging with electrons using the HAADF detector. Figure 4 compares TEM, STEM ADF, and HAADF images of Si implanted with Sb ions.Reference Pennycook and Narayan19 The TEM and STEM ADF images are dominated by diffraction contrast, showing the presence of crystal defects, while the HAADF image is dominated by Z-contrast, revealing the profile of the implanted Sb ions, which have a peak concentration of almost 6 at.%. After I acquired a VG Microscopes HB501UX instrument with a high-resolution pole piece (theoretical resolution 2.2 Å), the possibility of atomic resolution Z-contrast imaging was able to be tested. Figure 5 shows images of YBa2Cu3O7−δ and ErBa2Cu3O7−δ in which the Y and Er planes are clearly showing the expected Z-contrast.Reference Pennycook and Boatner20
Cross-sectional images of Sb-implanted Si. (a) Transmission electron microscopy diffraction contrast image showing defects near the surface and a band below the surface, the end of range damage; (b) a low-angle annular dark field image also dominated by diffraction contrast; (c) a high-angle annular dark field image revealing the Sb profile. Reproduced with permission from Reference 19.

High-angle annular dark field images in a planar channeling condition from (a) YBa2Cu3O7−δ and (b) ErBa2Cu3O7−δ, with calculated intensity profiles across each unit cell (c-axis spacing ∼1.2 nm). The expected strong Z-contrast closely matches the experimental result. Adapted with permission from Reference 20.

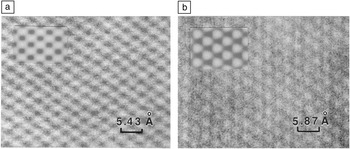
HAADF images of semiconductors also showed all the characteristics of incoherent images. Images of Si along the 〈110〉 zone axis showed elongated image features, revealing the presence of the two closely spaced Si columns commonly referred to as dumbbells, even though they were not resolved, see Figure 6.Reference Pennycook and Jesson21 In the case of InP, the Z-contrast was apparent—the image showed round atomic columns of In, while the lighter P columns were not visible. But more surprising was that the images did not show much change in contrast with increasing specimen thickness, just a gentle decrease, very unlike the oscillatory contrast seen in phase contrast images.Reference Pennycook and Jesson22 This was not so easy to understand, because the beam undergoes multiple scattering as it propagates along a crystal down a major zone axis. How could the incoherent image be apparently immune to variations in specimen thickness?
Z-contrast images from (a) Si and (b) InP in the 〈110〉 zone axis. Si shows elongated features representing the (unresolved) two atomic columns of the Si dumbbells. In InP, the image is dominated by the heavy In columns, which show as round features. Insets show simulated images. Reproduced with permission from Reference 21.

The answer came through a detailed analysis of the Bloch states (quantum stationary states) that carry the beam through the crystal. It turned out to be obvious (in hindsight of course) that high-angle scattering came mostly from the Bloch states closest to the nucleus, which was just one state. In a crystal aligned to a low order zone axis, the dominant Bloch states describing the fast electron traveling through the crystal are similar to two-dimensional molecular orbitals, with 1s, 2s, and 2p like symmetry. The 1s state dominates the high-angle scattering because it is much narrower than the other states and puts the electron beam closer to the nucleus. With just one state dominant, interference effects are reduced to second order.Reference Pennycook and Jesson21, Reference Pennycook and Jesson22 Further analysis revealed that this argument worked well for lateral incoherence (between adjacent columnsReference Jesson and Pennycook23) but was not very effective for longitudinal coherence (down the column), which was broken by thermal vibrations.Reference Jesson and Pennycook24 And since high-angle scattering is dominated by thermal vibrations, all the pieces were in place. Incoherent imaging with electrons was no longer limited to single atoms, but could be applied to the thick, crystalline, strongly diffracting samples common in materials research.Reference Pennycook, Nellist, Rickerby, Valdrè and Valdrè25, Reference Pennycook, Browning, McGibbon, McGibbon, Jesson and Chisholm26
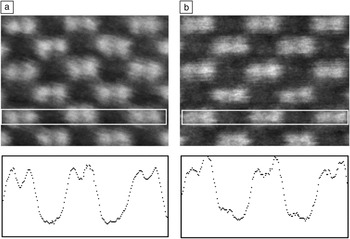
The next task was to improve the resolution, for which a smaller beam was needed. At the time, lens aberrations were optimized by shrinking the pole piece to the minimum achievable, maximizing the strength of the magnetic focusing field, while still having space to insert a specimen. A smaller beam could only be achieved by raising the accelerating voltage (reducing the wavelength and hence the beam diameter). A VG Microscopes HB603U, 300 kV STEM, having a theoretical resolution limit of 1.26 Å was acquired. Could this directly resolve the Si dumbbell? Figure 7 shows the answer was yes! Not only could the dumbbell be resolved in Si, but in compound semiconductors, the sublattice polarity could be read directly from the image.Reference Pennycook, Browning, McGibbon, McGibbon, Jesson and Chisholm26, Reference McGibbon, Pennycook and Angelo27 For the first time, dislocation core structures in compound semiconductors could be determined directly from the Z-contrast image.
Sublattice sensitivity in a 300 kV VG Microscopes HB603U STEM. Z-contrast images of (a) Si and (b) GaAs with line traces averaged vertically within the white rectangles revealing the dumbbell spacings of 0.136 and 0.14 nm, respectively. Adapted with permission from Reference 26.

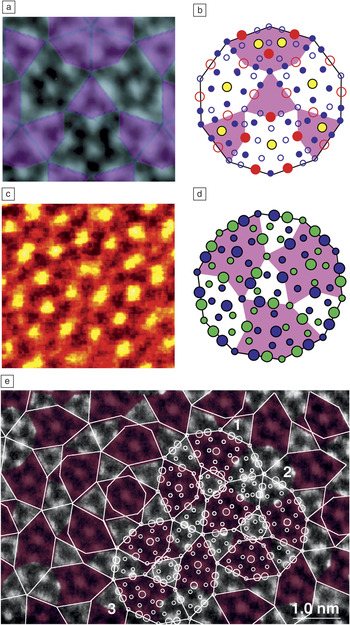
High-resolution Z-contrast imaging revealed unanticipated structures at many interfaces, typically more complex than previously assumed.Reference Chisholm, Browning, Pennycook, Jebasinski and Mantl28, Reference Jesson, Pennycook and Baribeau29 Perhaps the most impact came in the field of quasicrystals, when Z-contrast imaging of the decagonal quasicrystal Al72Ni20Co8 showed the symmetry not to be ten-fold, or even five-fold, but two-fold,Reference Steinhardt, Jeong, Saitoh, Tanaka, Abe and Tsai30 see Figure 8a–b. However, the smaller spot of the 300 kV STEM revealed additional details not previously resolved,Reference Yan and Pennycook31, Reference Abe, Saitoh, Takakura, Tsai, Steinhardt and Jeong32 as shown in Figure 8c–d. For the first time, the light Al sites could be discerned in the image, and density functional calculations of the observed structures showed that the quasicrystalline phase was energetically stable.Reference Yan and Pennycook33 Quasicrystals represented a stable phase of matter.Reference Abe, Yan and Pennycook34 Seeing the atoms more clearly had finally answered the question posed by Per BakReference Bak35 in the title of his paper years before, “Where are the atoms?” and thereby revealed the atomic origin of the so-called matching rules that described the formation of quasicrystals,Reference Penrose36Figure 8e.
(a) Z-contrast image of an Al-Co-Ni decagonal quasicrystal and derived atomic structure (b) showing broken symmetry within the 2-nm rings that form the basic structural units of the quasicrystal. (c) Higher resolution image showing further structural detail. The high Z transition metal columns are seen in yellow, while the Al columns are seen as poorly resolved red features. (d) Derived structure, transition metals shown as large circles, Al as small circles, and the colored shapes highlight the broken symmetry. These images revealed the atomic origins of the quasicrystalline tiling (e). Reproduced with permission from References 30 and 31 (a–d) and Reference 33 (e).

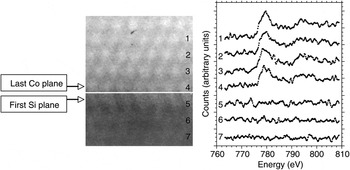
Another success of incoherent imaging was the achievement of atomic resolution EELS (see the January 2012 issue of MRS Bulletin, “Spectroscopic imaging in electron microscopy”). Using the Z-contrast image as a reference, one could precisely know the position of the beam with respect to the atomic columns and therefore could obtain composition and bonding information from precisely the same regions. The first demonstration of atomically resolved spectroscopy used a CoSi2/Si{111} interface, known to be atomically abrupt, by taking spectra plane by plane across the interface; indeed, the Co signal dropped dramatically from the last plane of the silicide to the first plane of the silicon substrate, see Figure 9.Reference Browning, Chisholm and Pennycook37, Reference Pennycook, Varela, Lupini, Oxley and Chisholm38 A few months later, true atomic column resolution was demonstrated at an Si/SiO2 interface,Reference Batson39 and the EELS fine structure was mapped at sub-nm resolution for the first time.Reference Muller, Tzou, Raj and Silcox40
Z-contrast image of a CoSi2/Si{111} interface (marked by a white line) with spectra obtained plane by plane showing disappearance of the Co L2,3 edge in a single plane. The separation between the last Co plane and the first Si plane is 2.7 Å. Reproduced with permission from Reference 83.

Z-contrast with EELS grew in popularity, ironically, partly through the demise of the company that produced the first commercial machines. VG Microscopes ceased business in 1996, and TEM manufacturers were motivated to improve their STEM performance, resulting in STEM becoming a standard part of the commercial TEM. No longer was STEM a dedicated pursuit of the few.Reference James and Browning41, Reference James, Browning, Nicholls, Kawasaki and Stemmer42 However, as is apparent from the examples shown here, while atomic resolution was definitely achieved, the image quality still left a lot to be desired. The problem of noise still remained.
Aberration correction
In his 1959 lecture, “There’s Plenty of Room at the Bottom,” Richard Feynman set a challenge: “I would like to try and impress upon you while I am talking about all of these things on a small scale, the importance of improving the electron microscope by a hundred times. It is not impossible; it is not against the laws of diffraction of the electron.”Reference Feynman43 He appreciated that what was commonly regarded as a fundamental resolution limit, the inherently high aberrations of electron lenses, was not actually fundamental, “merely” technological. Electron lenses, unlike glass lenses, cannot be ground into arbitrary shapes—they use magnetic fields that obey the equations of physics. It was understood from the 1940s that combinations of multipole lenses could be used to compensate for the aberrations of the round lenses that formed the primary objective lenses in electron microscopes.Reference Scherzer44 It was, however, an insurmountable technical problem in 1959. One could construct the required optical elements, but with a human brain, it was impossible to focus in the 40- to 60-dimensional space necessary to power all elements to the accuracy of parts per million or higher. Such a task nowadays is possible with the computer, which measures aberrations and iteratively changes the optics to tune to the desired aberration targets. Also helpful was the development of the charge-coupled-device to allow RonchigramsReference Ronchi45 (in-line electron holograms that can diagnose the aberrationsReference Cowley46–Reference Sawada, Sannomiya, Hosokawa, Nakamichi, Kaneyama, Tomita, Kondo, Tanaka, Oshima, Tanishiro, Takayanagi, Richter and Schwedt48) to be detected rapidly and quantitatively. So in the last decade or so, we have seen the successful correction of aberrations first in the TEMReference Haider, Uhlemann, Rose and Urban49 and then the STEM.Reference Batson, Dellby and Krivanek50
Our 100 kV STEM was upgraded with a Nion aberration corrector in 2001 and gained the resolution previously only possible with our 300 kV STEM. Not only did the resolution improve, but aberration correction meant that the same current could now be focused into a spot about half the size of the uncorrected case, so the peak current density is four times higher, and the noise is reduced by a factor of two. Single Bi atoms could be located in individual atomic columns in Si〈110〉.Reference Lupini and Pennycook51, Reference Pennycook, Lupini, McBride, Rosenthal, Krivanek, Wang, Nellist, Pantelides, Yahil and Dellby52 Individual dopant atoms had been imaged before aberration correction,Reference Voyles, Grazul and Muller53, Reference Voyles, Muller, Grazul, Citrin and Gossmann54 however, after correction, the atoms could be seen much more clearly. Single dopant atoms could even be identified by EELS within individual atomic columns of a crystal.Reference Varela, Findlay, Lupini, Christen, Borisevich, Dellby, Krivanek, Nellist, Oxley, Allen and Pennycook55
With the addition of an aberration corrector to our 300 kV STEM in 2002, the smaller spot allowed the first sub-Ångstrom imaging of a bulk material, the resolution of Si dumbbells in the 〈112〉 orientation, where the two columns of the dumbbell are only 0.78 Å apart.Reference Nellist, Chisholm, Dellby, Krivanek, Murfitt, Szilagyi, Lupini, Borisevich, Sides and Pennycook56 In ceramics, the long-elusive sites of dopant atoms in disordered grain boundary intergranular films were finally found.Reference Shibata, Painter, Becher and Pennycook57, Reference Shibata, Pennycook, Gosnell, Painter, Shelton and Becher58 Light elements became visible in the Z-contrast image, where before they could be lost under the background of nearby high-Z columns and even identified spectroscopically. Oxygen was seen to occupy specific sites in α-Si3N4, explaining its stability over the β phase.Reference Idrobo, Oxley, Walkosz, Klie, Ogut, Mikijelj, Pennycook and Pantelides59
Aberration correction also allowed us to see below the surface. The larger aperture possible with aberration correction improved the lateral resolution, but also reduced the depth of field, improving the depth resolution also. For the first time, we could see inside materials just by changing focus.Reference Borisevich, Lupini and Pennycook60 Stray Hf atoms were located in three dimensions in the 1-nm-thick gate dielectric of a high dielectric constant device structure.Reference van Benthem, Lupini, Kim, Baik, Doh, Lee, Oxley, Findlay, Allen, Luck and Pennycook61 Single point defects could be detected inside a bulk crystal for the first time.Reference Yurdakul, Idrobo, Pennycook and Turan62, Reference Oh, van Benthem, Molina, Borisevich, Luo, Werner, Zakharov, Kumar, Pantelides and Pennycook63
Another consequence of aberration correction is that a high quality phase contrast image could be obtained simultaneously with the Z-contrast image, with pixel to pixel correlation between the two.Reference Pennycook, Chisholm, Lupini, Varela, Borisevich, Oxley, Luo, van Benthem, Oh, Sales, Molina, Garcia-Barriocanal, Leon, Santamaria, Rashkeev and Pantelides64 Heavy atom positions could be accurately obtained in the Z-contrast image and light atom positions more easily seen in the phase contrast image.Reference Jia, Lentzen and Urban65 Dislocation core structures became visible even in light materials,Reference Shibata, Chisholm, Nakamura, Pennycook, Yamamoto and Ikuhara66 and in ferroelectrics, the combination of the two images is especially powerful. Cation displacements can be quantitatively determined from the Z-contrast image, while octahedral tilts are quantified from the phase contrast image.Reference Borisevich, Chang, Huijben, Oxley, Okamoto, Niranjan, Burton, Tsymbal, Chu, Yu, Ramesh, Kalinin and Pennycook67
These correctors cancelled the (third order) spherical aberration, the major aberration limiting electron microscope resolution from its invention,Reference Scherzer68 but the resolution then became limited by higher order aberrations.Reference Krivanek, Nellist, Dellby, Murfitt and Szilagyi69, Reference Haider, Uhlemann and Zach70 New corrector designs were developed to compensate to higher orders, with another large gain in resolution. The record is now below 0.5 ÅReference Erni, Rossell, Kisielowski and Dahmen71, Reference Sawada, Tanishiro, Ohashi, Tomita, Hosokawa, Kaneyama, Kondo and Takayanagi72 and is held by the STEM, which is of course in accord with the physics of incoherent imaging (Figure 1).
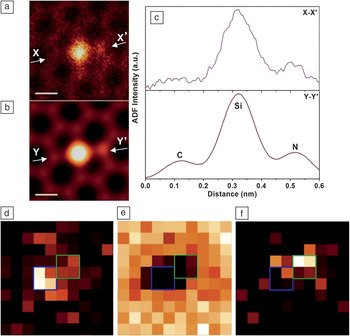
An equally important benefit of the latest generation of aberration correctors is that is we can achieve atomic resolution of 1.2 Å or so at accelerating voltages of only 60 kV, a five-fold decrease compared to the 300 kV necessary before correction.Reference Krivanek, Chisholm, Nicolosi, Pennycook, Corbin, Dellby, Murfitt, Own, Szilagyi, Oxley, Pantelides and Pennycook73 This has become known as “gentle-STEM,”Reference Krivanek, Dellby, Murfitt, Chisholm, Pennycook, Suenaga and Nicolosi74 because it is below the threshold for knock-on damage in many interesting materials, for example, monolayer BN and graphene. C and O impurities have been identified in monolayer BN directly from their Z-contrast intensities,Reference Suenaga and Koshino75 and single atom EELS is also possible.Reference Zhou, Lee, Nanda, Pantelides, Pennycook and Idrobo76Figure 10 shows how Si point defect configurations in graphene can be determined directly from the image, and the atom identities confirmed spectroscopically.Reference Lee, Zhou, Idrobo, Pennycook and Pantelides77 A localized optical response from such impurity atoms has been seen using EELS, suggesting lines of impurities could act as plasmonic waveguides. Antisite defects in the battery material LiFePO4 have been shown to have an unexpected valence state as a consequence of trapping mobile Li vacancies,Reference Chung, Choi, Yamamoto and Ikuhara78 explaining their unexpected clustering in particular channels.Reference Pennycook, Pennycook and Nellist79
Atomic structure of a point defect complex in monolayer graphene. (a) Annular dark field (ADF) image showing the presence of two dopant atoms, identified as Si and N from the simulated image (b). (c) Corresponding intensity profiles along X-X’ and Y-Y’ in the experimental and simulated images, respectively. Experimental images have been low-pass filtered. (d–f) Spectroscopic confirmation of the dopant identities. Si-L-, C-K-, and N-K- edge maps, with blue and green squares indicating the positions of the substitutional Si and N atoms, respectively. Scale bars are 0.2 nm. Reproduced with permission from Reference 75.

Seeing into materials with new eyes
An aberration corrected microscope is like having new eyes—the ability to interpret incoherent Z-contrast images largely intuitively and to collect simultaneous EELS has led to many new insights into materials research, in fields both old and new. There are a number of reviews in a recent book.Reference Pennycook, Pennycook and Nellist79 For example, in complex oxides, the combination of Z-contrast imaging and EELS is a highly effective way to determine the interface stacking sequence and any associated changes in transition metal orbital occupation, which is at the heart of their exciting properties (see the recent MRS Bulletin article by Maria VarelaReference Varela, Gazquez and Pennycook80).
Even dynamics can be followed in STEM with reduced scan times now accessible, and movies of atomic motion are simple to record on the second time scale.Reference Bals, Van Aert, Romero, Lauwaet, Van Bael, Schoeters, Partoens, Yücelen, Lievens and Van Tendeloo81, Reference Warner, Margine, Mukai, Robertson, Giustino and Kirkland82 Z-contrast images of a fluxional state induced by the electron beam in sub-2-nm CdSe nanoclusters, accompanied by quantum molecular dynamics calculations of bandgap, revealed the origin of the mysterious white light emission from single nanoclusters.Reference Pennycook, McBride, Rosenthal, Pennycook and Pantelides83 In the future, we are likely to see further development of atomic resolution imaging at low voltages, coupled with the detection of other signals to relate structure and impurity content to functionality. For example, detecting light emission (cathodoluminescence) as the beam scans the sample would enable the efficiency of light-emitting materials to be related to local defect structure and impurity content.Reference Pennycook84, Reference Zagonel, Mazzucco, Tencé, March, Bernard, Laslier, Jacopin, Tchernycheva, Rigutti and Julien85In situ imaging in liquid and gas atmospheres is also becoming possible with atomic resolution.Reference Parent, Robinson, Woehl, Ristenpart, Evans, Browning and Arslan86, Reference De Jonge and Ross87 New ways to probe magnetic properties using vortex beams (carrying angular momentum) are looking very promising.Reference Verbeeck, Tian and Béché88 New monochromator designs are also looking very exciting, offering energy resolutions of a few tens of meV, which should allow the mapping of bandgaps and plasmonic characteristics with unprecedented resolution in space and energy.Reference Krivanek, Ursin, Bacon, Corbin, Dellby, Hrncirik, Murfitt, Own and Szilagyi89
The increasing popularity of STEM in recent years is undoubtedly due to the success of aberration correction, which has finally realized the inherent advantages of the incoherent mode of imaging: the ability to see the atoms more clearly, to identify them through EELS, and from fine structure, to determine their valence state and even the nature of their chemical bonds. It is surely a historic time when the human race has achieved the ability to see atoms clearly, not only for electron microscopy, but for materials research as a whole. Seeing the atoms, their sites, their defect configurations, and their bonding is an enormous step toward understanding materials functionality and how to engineer/synthesize new functionalities. Forevermore we will be able to see atoms clearly.
Acknowledgments
The author would like to thank the US Department of Energy for its many decades of support of electron microscopy, particularly the development of STEM by Albert Crewe and colleagues, and the author’s own support for the past 30 years. I would like to acknowledge fruitful interactions with all my colleagues over the years, in particular L.M. Brown, A. Howie, D.E. Jesson, N.D. Browning, M.F. Chisholm, P.D. Nellist, A.R. Lupini, M. Varela, A.Y. Borisevich, O.L. Krivanek, M.P. Oxley, S.T. Pantelides, and J.-C. Idrobo. This article was written with support from the US Department of Energy, Office of Basic Energy Sciences, Materials Sciences and Engineering Division.

Stephen J. Pennycook is a corporate fellow in the Materials Science and Technology Division at Oak Ridge National Laboratory (ORNL) and leader of the Scanning Transmission Electron Microscopy Group. He also is a professor in the Department of Materials Science and Engineering at the University of Tennessee and an adjoint professor in the Department of Physics and Astronomy at Vanderbilt University. He received his PhD degree in physics from the Cavendish Laboratory at the University of Cambridge in 1978, moving to ORNL in 1982. Pennycook’s research interests focus on the development of Z-contrast scanning transmission electron microscopy and electron energy-loss spectroscopy with sub-Ångstrom resolution and applications to materials science. He has authored 38 books and book chapters, over 400 publications in refereed journals, and has given more than 200 invited presentations on atomic resolution Z-contrast microscopy and electron energy-loss spectroscopy. For the development and application of Z-contrast scanning transmission electron microscopy, Pennycook received a Research and Development 100 Award in 1990, the Microbeam Analysis Society Heinrich Award in 1992, the Materials Research Society Medal in 1992, and the Institute of Physics Thomas J. Young Medal and Award in 2001. Pennycook also is a fellow of the American Physical Society, American Association for the Advancement of Science, Microscopy Society of America, Institute of Physics, and Materials Research Society. Pennycook can be reached by email at pennycooksj@ornl.gov.