Primary cardiac tumour is rare, with an incidence of around 0.17% in children. Prenatal diagnosis is established in about 1/3 of the patients. Rhabdomyoma is the most common tumour in children (61%), followed by fibroma (15.4%) and myxomas (5.8%). Reference Elderkin and Radford1–Reference Padalino, Vida and Boccuzzo4 Von Recklinghausen reported the first case of congenital rhabdomyoma in 1862. Subsequently, multiple post mortem cases were reported that explored the histopathology of this congenital tumour. Reference Beaird, Mowry and Cunningham5–Reference Rae7 In the last 2 decades, the incidence of congenital rhabdomyoma has increased with medical imaging and prenatal diagnosis advancement. This tumour usually regresses with time; however, it may cause inflow or outflow obstruction in various heart chambers that need urgent surgical intervention. Reference Elderkin and Radford1,Reference Padalino, Reffo and Cerutti2 Rhabdomyoma is known to be associated with tuberous sclerosis complex (50–80%). Reference Harding and Pagon8 Tuberous sclerosis complex is an autosomal dominant neuro-cutaneous disorder characterised by developing multiple tumours in various organs such as the brain, heart, skin, and kidney. This disease is caused by mutations in TSC-1 or TSC-2 that result in increased activation of mammalian target of rapamycin pathway, which is an intracellular signaling pathway that regulates cell proliferation, metabolism, ribosome biogenesis, and autophagy. Reference Crino, Nathanson and Henske9,Reference Manning10 The mechanism of spontaneous tumour regression is not well defined. Kotulska et al found high expression of pro-apoptotic proteins in cardiac rhabdomyoma tumours associated with tuberous sclerosis complex. Reference Kotulska, Larysz-Brysz and Grajkowska11 Several reports also highlight the use of mammalian target of rapamycin inhibitors to accelerate the regression of large cardiac rhabdomyoma Reference Aw, Goyer, Raboisson, Boutin, Major and Dahdah12 ; however, the factors involved in response to treatment are unknown and require further elucidation.
Here we describe the clinical features and the genetic analysis of patients with tuberous sclerosis complex presenting with large rhabdomyoma tumours. Also, we investigate the potential role of autophagy and apoptosis signalling in the pathogenesis of this tumour.
Methods
This is a retrospective analysis of the medical records of all the patients with cardiac rhabdomyoma referred to Aswan Heart Centre from the year 2010 to 2018. Five patients were identified and underwent complete clinical and diagnostic examinations. Four patients underwent surgical intervention, and one patient was asymptomatic and was followed up clinically. The demographic data, clinical presentation, genetic analysis, histological, and molecular studies are outlined. This study was approved by the ethical committee of the Aswan Heart centre [Research Ethics Committee Code (20201020MYFAHC_CRTS], and consent was taken from the patients’ parents enrolled in the study.
Genetic analysis
According to the standard protocols, genetic DNA was extracted from peripheral whole blood samples (The Wizard® Genomic DNA Purification Kit, Promega, USA). The purity and concentration of the extracted DNA were evaluated with Nanodrop™ Spectrophotometer and Invitrogen™ Qubit™ 4 Fluorometer. The DNA quality was assessed using agarose gel electrophoresis.
The coding exons and the flanking intronic regions of TSC1 (exons 3–23) and TSC2 (exons 1–41) were PCR-amplified, then purified, and subjected to bidirectional sequencing using automated v3.1 Bigdye terminator cycle–capillary electrophoresis (ABI 3500 Applied Biosystems, Foster City, CA, USA), Primers sequences are obtained from Avgeris et al Reference Avgeris, Fostira and Vagena13 polymerase chain reaction conditions are cited in Tables S2 and S3 in the supplementary materials. The resulting sequences were then aligned against the reference sequence of TSC1 and TSC2 (Accession Numbers NG_012386.1 and NG_005895.1, respectively). In Silico Analysis of variants using licensed online Alamut-2.11 Biosoftware (http://www.interactive-biosoftware.com). Variants calling and interpretation were assessed in the most recent guidelines of the American College of Medical Genetics. Reference Rosset, Vairo and Bandeira14
Histological studies
Rhabdomyoma specimens were collected from four patients during surgery and fixed in 10% neutral buffered formalin (Sigma). Fixed tissues were processed using an auto-processor machine (Leica) via dehydration with increasing ethanol concentrations, followed by clearing with xylene then embedded in pure paraffin wax (sigma).The 5 μm sections were cut from formalin fixed, paraffin wax embedded tissue sections which were deparaffinised in xylene (Sigma) for 10 minutes, hydrated in decreasing concentrations of alcohol (Merk), and then immersed in tap water. For collagen I and III staining, slides were incubated in picrosirus red stain (Abcam) for 1 hour and then washed in 0.5% acetic acid for differentiation. For periodic acid Schiff staining, sections were immersed in periodic acid solution for 15 minutes, washed with water, followed by staining in Schiff’s Solution for 15 minutes, washed again with water, and counterstained with haematoxylin. Stained sections were dehydrated with incremental concentrations of ethanol, cleared with two changes of xylene (Sigma) and then mounted with dibutylphthalate polystyrene xylene (sigma). Mounted sections were scanned with slide scanner (Zeiss) and analysed using Zeiss blue software.
Immunohistochemistry
Antigen retrieval was performed on 5 μm formalin fixed, paraffin wax embedded human tissue sections using 1 mM ethylenediaminetetraacetic acid (Sigma) buffer (pH 8) under high pressure. All other incubations were performed at radiotherapy in a humidity chamber. Sections were blocked with pre-diluted 2.5 % goat serum for 20 minutes then incubated with primary antibody for 2 hours. All antibodies were diluted to their final concentrations using blocking solution (caspase3 1:50 (Abcam), caspase7 1:50 (Abcam), P62 1:200 (Abcam), and LC3b 1:100 (Abcam). Washed tissue sections were incubated for 30 minute with goat polyclonal anti-rabbit/anti-mouse (horseradish peroxidase labelled) secondary antibody (Dako) before staining with 3,3'-diaminobenzine + Chromogen for 2 minute. Stained tissue sections were counterstained with haematoxylin (Dako), dehydrated through increasing ethanol concentrations then xylene before mounting with coverslips using the dibutylphthalate polystyrene xylene mounting medium (Sigma). Microscopic examination was performed using 40x objectives. Scoring system was used with a number assigned, on a scale of 0–3 based on the staining intensity and considering any field-to-field variation. Zero was given for negative staining and 3 for the strongest.
Protein isolation and western blotting
The 0.05 gm of frozen two rhabdomyoma and two control left ventricular tissues were available and used to study some apoptotic and autophagy proteins’ expression. The tissues were homogenised in cold radioimmunoprecipitation assay buffer (25 mM TRIS pH 8, 150 mM NaCl, 1% NP-40, 1% sodium deoxycholate, 0.1% sodium dodecylsulphate, and protease inhibitor (Roche)). Tissue lysates were centrifuged at 4°C for 20 minute at 25,000 g to separate the fraction of extracted proteins (supernatant) from cell debris (pellet). Protein lysates were quantified using bicinchoninic acid™ protein assay kit as per the manufacturer’s instructions (Thermo Scientific). The 10 μg of denatured protein per sample was electrophoresed through 10% tris gel (Biorad) in the presence of 1x NuPage MOPS SDS running buffer (Thermo). Proteins were transferred from the gel to Whatman® Protran® Nitrocellulose Transfer Membrane (0.2 μm) (Sigma) using a Biorad transfer module, protein transfer buffer (1x NuPage transfer buffer, 10% methanol in dH2O). The blot was incubated for 30 minute at radiotherapy in 5% Marvel Original dried skimmed milk blocking solution (5% Marvel Original dried skimmed milk in 1 × PBS Tween-20 wash buffer). Blot was then incubated for 2 hours at radiotherapy with primary antibody (glyceraldehyde-3-phosphate dehydrogenase (cell signalling) at 1:1000, caspase3 at 1:500, caspase7 at 1:1000, P62 at 1:1000, and LC3b at 1:1000), washed thrice with washing buffer for 15 minute, incubated for 1 hour at radiotherapy with horseradish peroxidase-labelled secondary antibody (Life technologies), and finally washed thrice for 15 minute. All the above incubations and washes were performed using oscillating shakers.
Signal development was carried out using chemiluminescence-based reaction, using the Amersham ECL Western blotting detection reagents (life technologies) and analysis system as per manufacturer’s instructions, and the signal was detected using an Amersham Imager 600. The signal intensity of bands was quantified using ImageJ software (NIH), and each marker’s signal was normalised to the signal of glyceraldehyde-3-phosphate dehydrogenase (housekeeping protein). Three measures were taken for each sample, and Mann–Whitney test was performed for statistical analysis.
Clinical and demographic data.

Results
Patient characteristics and clinical information (Table 1)
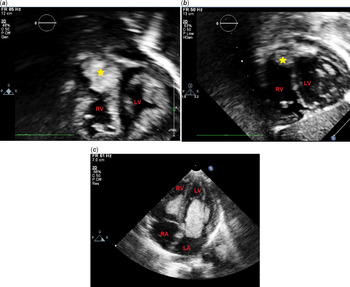
There were four males and one female in this series. All the patients were diagnosed clinically to have tuberous sclerosis complex based on skin and brain lesions (Figure 1) in addition to the presence of cardiac rhabdomyoma. Patient (1) presented with seizures and hydrocephalus with increased intracranial pressure requiring ventriculoperitoneal shunt (V-P shunt). The patient had an echocardiogram that showed a large tumour occupying the left ventricular cavity, which was successfully resected. Patient (2) was asymptomatic and diagnosed incidentally to have rhabdomyoma tumour in the right atrium and right ventricle, causing right ventricular outflow tract obstruction with a gradient of 90 mmHg. The tumour regressed spontaneously without surgical intervention, and the gradient on the follow-up echocardiogram decreased to 30 mmHg (Figure 2a and b). Patient (3) was diagnosed with cardiac rhabdomyoma during fetal echocardiogram and became symptomatic at age 17 days after the closure of the patent ductus arteriosus. The tumour was large and obstructing the right ventricular outflow tract and the patient had an urgent surgical resection to relieve this obstruction. Patient (4) presented with heart failure and was found to have multiple tumours in the right ventricle and left ventricle. There was a significant right ventricular outflow tract obstruction with a gradient of 90 mmHg. The patient underwent surgical debulking of the right ventriclar tumour to relieve the right ventriclar obstruction. Patient (5) presented with cyanosis, syncope, and low cardiac output. An echocardiogram showed a large tumour in the left ventricular cavity and obstructing the mitral valve inflow (Figure 2c). The patient underwent urgent surgical intervention to relieve the left ventricular inflow and outflow obstruction. Intra-operatively, the tumour was found to be infiltrating and adherent to the mitral valve annulus that made debulking extremely difficult and was not amenable for surgical excision. Weaning the patient from cardiopulmonary bypass was not successful because of severe mitral regurgitation, and the patient died intra-operatively.
(a and b) illustrate the hypomelanotic macules (ash-leaf spots) (arrow), which are the common skin manifestation in tuberous sclerosis complex. Brain magnetic resonance imaging (c) T2 (d) T1 showing multiple nodules (arrow) in the periventricular location consistent with subependymal nodules.

(a) Echocardiogram (subcostal view) of patient 2 at presentation with a large tumour in the right ventricular outflow tract (b) follow-up echocardiogram of patient 2 showed spontaneous regression of the tumour (c) Four chamber apical echocardiographic view for patient 5 showing two large tumour masses in the right ventricle and left ventricle. The rhabdomyoma tumour in the left ventricle is obstructing the mitral valve and attached to its annulus.

Genetics analysis
Sanger sequencing was performed for coding exons and the flanking intronic regions of both TSC1 and TSC2 genes of five probands clinically defined tuberous sclerosis complex patients. Patient (1) and (4), who did not report relatedness, harbored the same mutation in TSC2: p. Arg1459* (Figure 3a). Patient (3) had a truncated variant in TSC2; p. Arg505* (Figure 3b). According to the American College of Medical Genetics, these mutations are classified as pathogenic, most recent guidelines. Reference Rosset, Vairo and Bandeira14 No disease-associated mutations were identified in the remaining two patients. We also detected variants that were not previously reported. Furthermore, detected variants were classified as benign, likely benign, or as variants of unknown significance. Detected pathogenic mutations were summarised in Table 2.
(a) The mutational spectrum of TSC2 in tuberous sclerosis complex patient samples. The red symbol represents the patients from the current cohort with pathogenic variants. (b) A four-color chromatogram showing the results of the sequencing run of patients 1 and 4. Sequence analysis of exon-intron boundaries for TSC1 and TSC2 resulting in pathogenic mutations: c.4375C>T mutation exon 34 in TSC2 (Full chromatogram in figure S1). (c) A four-color chromatogram showing the results of the sequencing run of patient 3 showing the pathogenic mutation: c.1513C>T in exon 15 in TSC2 (Full chromatogram in figure S2).

Detected pathogenic mutations in TSC2 (exons 1 to 41) gene.

It is worth mentioning that three further variants were detected in patient (3). Variant (Ala357Val) was reported as a benign variant of unknown significance according to American College of Medical Genetics Guidelines. Reference Richards, Aziz and Bale15,Reference Nykamp, Anderson and Powers16 The intronic mutation c.976-16C>T was reported in the 1000 Genomes dataset but not in ClinVar and may affect the splice site. It is a novel intronic variant in the TSC2 gene (c.4569+10G>A), in which a nucleotide from position c.4569+10 changed into A.
In patient (5), the same intronic variant (c.4569+10G>A) identified in patient (3) was detected. In addition, two more intronic hits were identified: a novel hit at c.1119+64A>G and another one at c.1119+23G>A, which was reported in ClinVar without a provided classification. For TSC1, no disease-causing mutations were detected. All detected TSC1 and TSC2 mutations are summarised in Table S1.
Histological examination
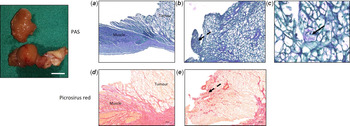
General histological analysis of tumour tissue sections showed tumour cells with variable vacuolation of cytoplasm and spider-shaped appearance. Glycogen was present in the cytoplasm of the tumour cells. There was an increase in the interstitial fibrosis in the regions with less vacuolated tumour cells than areas with more vacuolated cells (Figure 4). Tissue adjacent to tumour (safety margin) was histologically assessed via haematoxylin-esosin staining (data not shown) and picrosirius red, which exhibited normal cardiac muscle morphology.
(a and d) Periodic acid Shiff and picrosirius red staining for rhabdomyoma tumour tissue sections showing the general structure of rhabdomyoma tumour in contrast to right ventricular wall muscle from which the tissue was excised. (b and e) show tumour cells with a low level of vacuolation (dashed arrows) than others. (c) shows a magnified view of the rhabdomyoma spider-shaped distinguished cell morphology.

Autophagy and apoptosis in rhabdomyoma
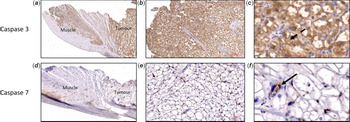
The expression of two autophagic markers, P62 and LC3b, and two apoptotic markers, caspase3 and caspase7, were increased in the tumour cells compared to the adjacent normal right ventriclar wall tissue. Caspase3 expression was localised within the tumour cells either at the periphery of the cells close to the cell membrane or occupying the whole cytoplasm of the less vacuolated cells, with no evident expression observed in the stromal cells. Caspase7 showed a stromal expression pattern and was completely absent in the tumour cells (Figure 5). P62 and LC3b expression was exclusively localised inside the cytoplasm of tumour cells, and not in the stromal cells (Figure 6).
(a, b, c , and d) Immunohistochemical analysis of caspase3 and caspase7, showing an increased expression of both markers in the tumour region in contrast to the right ventricular wall. The expression of caspase3 was exclusively localised in the cytoplasm of the tumour cells (c, dashed arrow) in contrast to caspase7, where its expression was localised only to the stroma cells surrounding the tumour (f, arrow).

(a, b, c , and d) Immunohistochemical analysis of P62 and LC3b, showing an increased expression of both markers in the tumour region in contrast to the right ventricular wall tissue. The expression of P62 and LC3b was exclusively localised in the cytoplasm of the rhabdomyoma cells and not in the stromal cells (c, dashed arrow and f, arrow).

Western blotting was performed on two rhabdomyoma tissues compared to two control left ventricular tissues, and signal intensity quantification confirmed the increased expression of all the markers in rhabdomyoma tissue lysates in contrast to the control left ventricular tissue lysates; P62 (3 folds, p = 0.002), Beclin-1 (2 folds, p = 0.002), Caspase3 (4 folds, p = 0.002), Caspase7 (3 folds, p = 0.002), and LC3b (1.5 fold, p = 0.5) (Figure 7 and Supplementary Figure).
(a) Western blotting analysis of P62, caspase3, caspase7, and LC3b relative to glyceraldehyde 3-phosphate dehydrogenase expression in protein extracts from rhabdomyoma tissue extracts in contrast to control (left ventricle) tissues, with their corresponding molecular weight. (b) Bar blot shows the increased expression level of each marker in rhabdomyoma tissues compared to controls. Quantification is normalised to glyceraldehyde 3-phosphate dehydrogenase expression.

Discussion
In the current study, we found that all the patients who had cardiac rhabdomyoma were diagnosed with tuberous sclerosis complex based on their clinical manifestations and genetic analysis. Three out of four patients, who had large obstructive tumours necessitating urgent surgical intervention, had pathogenic mutations in the TSC2 gene that might signify a strong genotype–phenotype association. Here, we report, for the first time, the high expression of autophagic proteins (P62 and LC3b) and apoptotic proteins (caspase3 and 7) in rhabdomyoma tumour tissues. These findings highlight the potential role of autophagy and apoptosis in the tumourigensis and regression of this tumour.
Tuberous sclerosis complex is an autosomal dominant disorder characterised by the development of distinctive benign tumours in multiple organ systems, including skin, brain, heart, lungs, kidney, and liver. Tuberous sclerosis complex is highly variable in severity. Some patients may present with benign dermatologic features, while others may develop more serious neurologic or systemic manifestations that contribute to increased early mortality. Tuberous sclerosis complex involves mutations of two genes: TSC1 located on chromosome 9q34 and TSC2 located on chromosome 16p13.3. Hamartin (coded by TSC1) and tuberin (coded by TSC2) play a fundamental role in the regulation of phosphoinositide 3-kinase signaling pathway, inhibiting the mammalian target of rapamycin through activation of the GTPase activity of Rheb. These mutations will result in up-regulation of the mammalian target of rapamycin complex leading to abnormal cellular growth, inducing tumour growth in various organs in the body. Reference Saxton and Sabatini17 Mutations in TSC2 are found in sporadic cases as opposed to TSC1, which are found more in familial cases. Reference Dabora, Jozwiak and Franz18 It is known that mutations in TSC2 are associated with a more severe phenotype, while patients with undefined mutations have milder phenotype. Reference Dabora, Jozwiak and Franz18,Reference Rosset, Netto and Ashton-Prolla19 In the current study, we report pathogenic mutations in the TSC2 gene in three patients who underwent rhabdomyoma excision. Two patients had the same nonsense mutation c.4375C>T; nucleotide from position C.4375 changed into T, which results in the formation of a truncated Tuberin protein Rheb-Gap domain. It was reported that this mutation negatively regulates Rheb and activates the mammalian target of rapamycin machinery. Reference Castro, Rebhun, Clark and Quilliam20 Furthermore, several novel intronic mutations in TSC2 have been identified that may play a role in the splicing process or gene regulation, causing a reduction of the normal mRNA transcript. These mutations are candidates for further studies to establish their classification.
Cardiac rhabdomyoma has unique behavior and distinct from other manifestations of tuberous sclerosis complex. They tend to grow prenatally and regress with time via mechanisms that are not fully established. Reference Aw, Goyer, Raboisson, Boutin, Major and Dahdah12,Reference Milano, Prioli and Vassanelli21 In this study, we found for the first time the high expression of autophagy proteins (P62 and LC3b) in rhabdomyoma tumour cells. The link between autophagy and the mammalian target of rapamycin pathway is well established. However, its role in tumourigenesis related to tuberous sclerosis complex syndrome is not fully understood. Autophagy can impact tumour growth and tumour death depending on the cellular context, and this is critical for designing targeted therapy. In tuberous sclerosis complex, loss of function of TSC1 or TSC2 causes hyperactive mammalian target of rapamycin complex 1 activity; hence mammalian target of rapamycin inhibitors were used to treat various manifestations of the disease, including subependymal giant-cell astrocytomas, renal angiomyolipoma, skin manifestations, epilepsy, and cardiac rhabdomyoma.
Moreover, the hyperactivity of the mammalian target of rapamycin complex 1 pathway results in downregulation of the basal autophagy in dividing cells. However, autophagy impairment is not observed in all TSC2-deficient cells. For instance, neurons lacking TSC2 exhibit autophagic organelle accumulation and demonstrate autophagic activity. Reference Dunlop and Tee22 Low autophagy levels lead to accumulation of the autophagy substrate P62/SQSTM1, which promotes tumourigenesis via activation of NF-κB and Nrf2. This may explain our finding of high level of P62 observed in the spider cells of cardiac rhabdomyoma compared to the nearby normal myocardium. Parkhitko et al Reference Parkhitko, Myachina and Morrison23 demonstrate that genetic and pharmacologic autophagy inhibition blocks tumourigenesis in xenograft and spontaneous models of tuberous sclerosis complex. This may suggest that patients with pathogenic mutations in TSC2 may have increased level of autophagy substrates, and that dual inhibition of both mammalian target of rapamycin and autophagy substrates is essential in these patients.
Caspases are a family of protease enzymes playing essential roles in programmed cell death and inflammation. These are divided into three groups: initiator caspases (caspase 2, 8, 9, and 10), executioner caspases (caspase 3, 6, and 7), and inflammatory caspases (caspase 1, 4, 5, 11 and 12). In the current study, we found a differential expression of apoptotic proteins by having a high expression of caspase3 in tumour cells and caspase7 in tumour stroma. Several studies reported the distinct role of the executioner caspases 3, 6, and 7 in different phases of apoptosis. In addition, caspases play a critical role in directing autophagy-apoptosis cross-talk. Caspase7 was found to have an anti-autophagic response; however, activated caspase3 promotes the extracellular export of autophagic vacuoles toward the cell membrane. Reference Wu, Che and Zheng24 Marcelli et al have shown that caspase7, but not caspase3, in the stromal cell line of benign prostatic hypertrophy induced more apoptotic activity, which might suggest a stromal-based mechanism for apoptosis when caspase7 is overexpressed. Reference Marcelli, Shao and Li25 Further studies are needed to explore the cross talk between autophagy and apoptosis pathways and their role in cardiac rhabdomyoma tumour regression.
In most of the rhabdomyoma cases, the tumour arises from the ventricular myocardium. The tumour is usually nodular and pinkish-grey in color. Microscopic examination showed tumour cells with various degree of vacuolization enclosed with a thin fibrous capsule. They are (periodic acid Schiff-positive), which revealed glycogen in cytoplasmic vacuoles, and these cells showed a centrally placed nucleus with cytoplasm arranged in fine radiating acidophilic fibrils extending toward the periphery (spider cells). Reference Beaird, Mowry and Cunningham5,Reference Rae7 Our study demonstrated high intracellular immunoreactivity of P62, LC3b, and caspase3 in less vacuolated tumour cells than large vacuolated mature cells. We also found higher interstitial fibrosis in the tumour regions with less vacuolation. Wu et al Reference Wu, Collins and De Chadarevian26 demonstrated high ubiquitin immunoreactivity in the spider cells of rhabdomyoma.
Interestingly, spider cells with dense acidophilic cytofilaments and less vacuolation consistently showed high ubiquitin immunoreactivity than mature cells with low cytofilaments and an increased pool of glycogen vacuoles similar to the pattern observed in our study with P62, LC3b, and caspase3. The ubiquitin–proteasome system and autophagy are the two major degradation pathways of proteins in the eukaryotic cells that are tightly controlled and coordinated during a cell’s life. The relative contribution of each degradation pathway is different between cell types. Furthermore, there are adaptor molecules such as P62 that link ubiquitinated proteins to the autophagic machinery and provide cross-talk between the two pathways. Reference Lilienbaum27
The limitation of our study is the small number of cases that were investigated. This could be explained by the fact that surgical intervention for cardiac rhabdomyoma is rare, and it is reserved for obstructing tumours causing clinical symptoms, low cardiac output, or arrhythmia. In addition, we did not have the genetic analysis of all family members who are not affected by the disease. Further studies using animal modes, cell culture, and gene expression experiments are needed to investigate further the role of identified mutations in TSC2 and their link to autophagy and apoptosis signaling pathways.
In conclusion, our data demonstrate the potential role of autophagy and apoptosis in the pathogenesis of cardiac rhabdomyoma in patients with tuberous sclerosis complex. In this study, we found the high expression of apoptotic and autophagic proteins in rhabdomyoma tumour tissues from patients who presented with large obstructing tumours. The cross-talk between apoptosis and autophagic machinery in rhabdomyomas might have a potential role in tumourigenesis and tumour regression and need to be further evaluated. Studying the molecular profile of cardiac rhabdomyoma and the determination of genotype–phenotype correlations may contribute to establishing successful personalised treatment for tuberous sclerosis complex.
Acknowledgments
We would like to thank Colors medical laboratories (Egypt) for their valuable help in Sanger sequencing. This work is part of an ongoing research program funded by the Egyptian Science and Technology Development (STDF).
Supplementary material
To view supplementary material for this article, please visit https://doi.org/10.1017/S1047951121000172.