Much as I would love to have the time and space to comment more fully on this fascinating and comprehensive book – for example, the issues of embodied cognition in general, and embodied representations in particular, are topics near and dear to my heart – I will conform to the BBS mold and comment on only the one aspect of the book that is most relevant to my most recent work: the framework of Interactive Specialization (IS). In what follows I will offer: (1) a method for investigating this framework, and (2) some data that may or may not be consistent with it (depending on what is meant by “specialization”).
In contrast to localization-based approaches, which at the extreme tend to expect a 1:1 correspondence between cognitive functions and brain areas, the IS framework in Neuroconstructivism, Vol. 1: How the Brain Constructs Cognition (Mareschal et al. Reference Mareschal, Johnson, Sirois, Spratling, Thomas and Westermann2007a), treats cognitive functions as the “emergent product of interactions between different brain regions” (p. 60). For IS, the targets of functional brain mapping should be collections of cooperating neural circuits, not individual brain areas; and the focus of developmental neuroscience should be on changes in interregional connectivity, rather than on the maturation of individual regions.
I wholeheartedly applaud this shift in focus. Networks of cooperating brain regions are prima facie far more plausible targets of (high-level) functional attributions than are individual areas, so much so that I find it something of a puzzle that there hasn't been far more effort along these lines (which is not to imply that there has been none). I think one reason is that the techniques typically used in cooperation-focused investigations are complex, they are hard to master, and they produce results that can be difficult to interpret. Thus I would like to take a moment to outline a very simple analytical technique we have been using in my lab (Anderson et al., in press).
The technique involves the simple expedient of choosing a spatial segmentation of the cortex (current analyses use Brodmann areas, but any consistent segmentation scheme will work) and analyzing large numbers of fMRI studies in some specific cognitive or behavioral domain to identify statistically significant instances of coactivation. We recently compiled a database of fMRI studies containing 530 experiments in 18 cognitive domains, with the results of each experiment coded primarily in terms of which Brodmann areas contained post-subtraction activation(s). The baseline chance of activation for each area is determined by dividing the number of experiments in which it was activated by the total number of experiments in the database. Then, for each pair of Brodmann areas, we use a chi-square measure to see if their observed degree of coactivation (in a given domain) was significantly different from what would be predicted by chance. With these coactivated pairs, we also perform a binomial analysis to obtain directional information. (It is sometimes the case that, while area A and area B are coactive more (or less) often than would be predicted by chance, the effect is asymmetric, such that area B is more active when area A is active, but not the reverse.)
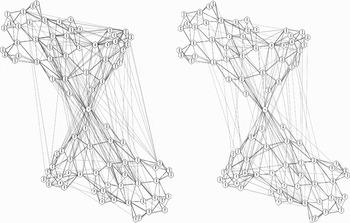
The results of such analyses are conveniently represented as a graph, where the nodes are Brodmann areas, and edges between the nodes indicate significant coactivation. Figure 1 shows the graphs from one such analysis, for a set of action and attention tasks. We hypothesize that the network of coactivated areas revealed by such analysis represent those areas of the cortex that cooperate to perform the cognitive tasks in the given domain.
Cortex represented as adjacency+co-activation graphs. Here the Brodmann areas are nodes, with black lines between adjacent areas and gray lines between areas showing significant coactivation. The graph on the left shows coactivations from 56 action tasks, and the graph on the right shows coactivations from 77 attention tasks. Graphs rendered with aiSee v. 2.2.

With the data in this format, it becomes possible to formulate some very simple questions, and use some well-understood methods to answer them. For instance, in graph theory a clique is a set of fully interconnected nodes that are sparsely connected to the rest of the graph (Alba Reference Alba1973). Neural cliques, which in this context represent small networks of coactive areas operating independently of other parts of the graph, seem likely to correspond to the neural components that support a set of closely related cognitive functions or subfunctions. One can also look at other features of the graphs, such as local topography, to help make plausible inferences about underlying function. For example, a hub-and-spoke pattern of coactivation may indicate broadcast or information consolidation functions; in contrast long strings of connected nodes might indicate serial processing. Since one can also look at the emergence of such structures over time, this seems an ideal tool for investigating the IS framework. The basic data for such investigations will become increasingly available as results from more longitudinal fMRI studies are released. More generally, I think that graph theory is an underutilized tool in cognitive neuroscience, and coactivation graphs in particular offer the promise of making cooperation-sensitive investigations into neural function more broadly intelligible.
This brings me to some promised data. We generated coactivation graphs in eight cognitive domains (action; attention; emotion; language; memory; mental imagery; reasoning; visual perception) from 472 experiments in our database and evaluated how much edge overlap and how much node overlap there was among the various domains. In this context, node overlaps indicate Brodmann areas that support tasks in both domains, whereas edge overlaps indicate similar patterns of cooperation. Given the focus on the developmental emergence of networks of brain areas to generate cognitive functions, the IS framework would seem to predict little edge overlap, as differences in function would presumably result from differences in interregional cooperation. This is just what we found; using Dice's coefficient as our measure (D=2(o1,2)/(n1+n2), where o is the number of overlapping elements, and n is the total number of elements in each set) we found very little edge overlap between the domains (Mean(D)=0.15, SD 0.04). However, we found a great deal of node overlap (Mean(D)=0.81, SD 0.04). It is not clear if the IS framework is compatible with this latter finding, because Mareschal et al. do not distinguish between increasing computational specialization in development (whereby a given region comes to have an increasingly well-defined subfunctional role in the networks in which it participates) and domain specialization (whereby increasing specialization of functional networks also implies increasing dedication of participating regions to a narrow and domain-restricted range of cognitive functions). The result reported is just one among a number of findings that suggests that brain regions are not domain specialized entities, but in fact typically support functions across many different cognitive domains (Anderson Reference Anderson2007a; Reference Anderson2007b; Reference Anderson2007c). I would welcome the authors' comments and clarifications on this issue.