


1 Introduction
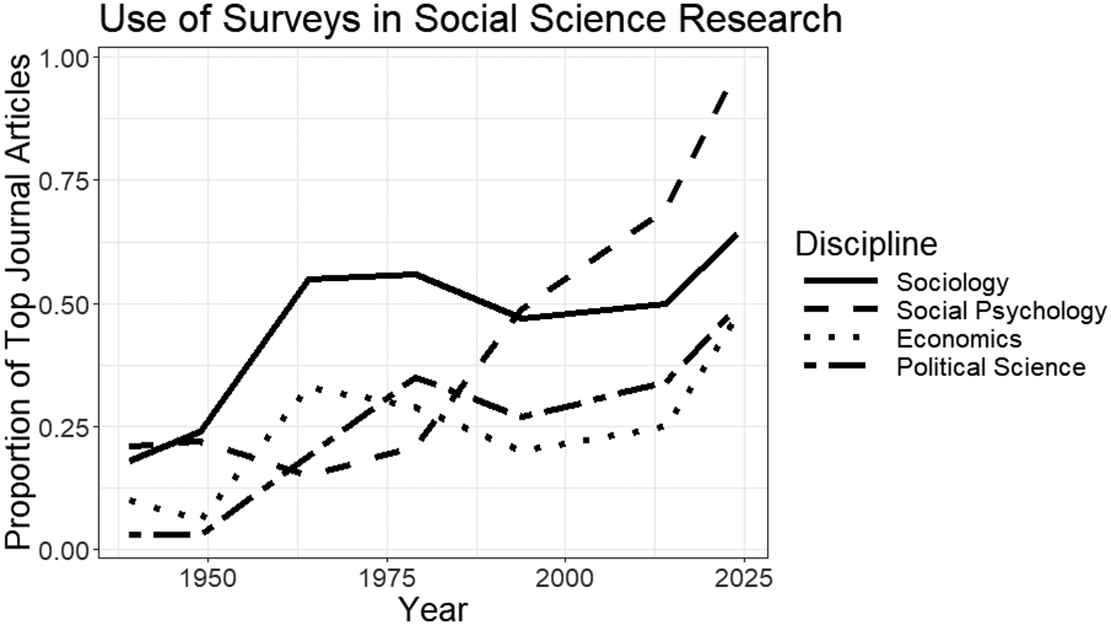
Surveys are a cornerstone of social science research, and self-reports are at the core of surveys. Figure 1 shows that, over the past 80 years, publications in top social science journals have come to heavily rely on evidence collected from paper and pencil questionnaires, interviews and recently, online surveys.Footnote 1 Self-reports have several advantages: they make it possible to study large, representative samples of people spread across large geographic areas, resulting in high statistical power, and such data can be collected more quickly and inexpensively than direct observation of individuals.
Proportion of top journal articles in social sciences using surveys over time.

Figure 1. Long description
The X axis represents Year from 1950 to 2025. The Y axis represents the Proportion of Top Journal Articles from 0.00 to 1.00. A legend to the right identifies four disciplines by line style.
* Social Psychology (long dashed line) starts at approximately 0.20 in 1950, remains relatively flat until 1975, then shows a sharp exponential increase, reaching nearly 1.00 by 2025.
* Sociology (solid line) begins at 0.25, rises sharply to a plateau of 0.55 between 1960 and 1980, dips slightly around 2000, and then climbs to approximately 0.65 by 2025.
* Political Science (dash-dot line) starts near 0.00, fluctuates with a gradual upward trend to 0.35 by 2015, and ends with a sharp rise toward 0.50.
* Economics (dotted line) starts at 0.10, peaks at 0.35 around 1965, declines to 0.20 by 2000, and then rises to approximately 0.45 by 2025.
This research, implicitly or explicitly, assumes that self-reports are accurate—that is, that survey measures capture constructs of interest in unbiased ways. However, some remain doubtful of self-reports’ accuracy. Methodologists across the social sciences have devoted substantial attention to uncovering, explaining and mitigating bias in self-reports (e.g., Belli et al. Reference Belli, Traugott, Young and McGonagle1999; Brenner and DeLamater Reference Brenner and DeLamater2016), and to devising measurement methods that avoid relying on them (e.g., Gawronski, De Houwer, and Sherman Reference Gawronski, De Houwer and Sherman2020; Greenwald, McGhee, and Schwartz Reference Greenwald, McGhee and Schwartz1998; Stephens-Davidowitz Reference Stephens-Davidowitz2014). Political scientists studying elections are plagued by the inaccuracy of self-reported voter turnout (Clausen Reference Clausen1968) and the growing attention to gaps between self-reported vote choice and election outcomes (Kennedy et al. Reference Kennedy2018). And researchers of increasingly relevant topics like technology usage, digital media exposure and mental health have revived concerns about reliance on self-reports (Cardenal et al. Reference Cardenal, Terren, Hopmann, Majó-Vázquez, Van Aelst and Zoizner2026; Kohrt et al. Reference Kohrt2025; Parry et al. Reference Parry, Davidson, Sewall, Fisher, Mieczkowski and Quintana2021).
While investigating errors in self-reports is undoubtedly useful, the sheer volume of critical work can leave consumers of research skeptical of the value of analyses relying on self-report measures (Chan Reference Chan2010). In light of the extensive reliance on self-reports, then, it is of value to understand how accurate these measurements are—that is, to provide a baseline estimate of the accuracy of self-reports in published research, allowing readers to move beyond a default skepticism of their validity. While plentiful evidence measuring accuracy is available, this work has not been gathered in a review that aggregates evidence across disciplines.
In this article, we describe the results of a meta-analysis of the relationship between self-reported and non-self-reported measures of the same constructs. More than 10,000 comparisons of self-report measures to objective (i.e., non-self-report) measures of the same phenomena from nearly 600 publications were assembled—a large, if necessarily incomplete, accumulation of evidence—based on their use of keywords related to self-report accuracy. Evidence from these publications was combined using meta-analytic methods to estimate the accuracy of self-reports across the full body of work, as well as within particular types and topics of questions.
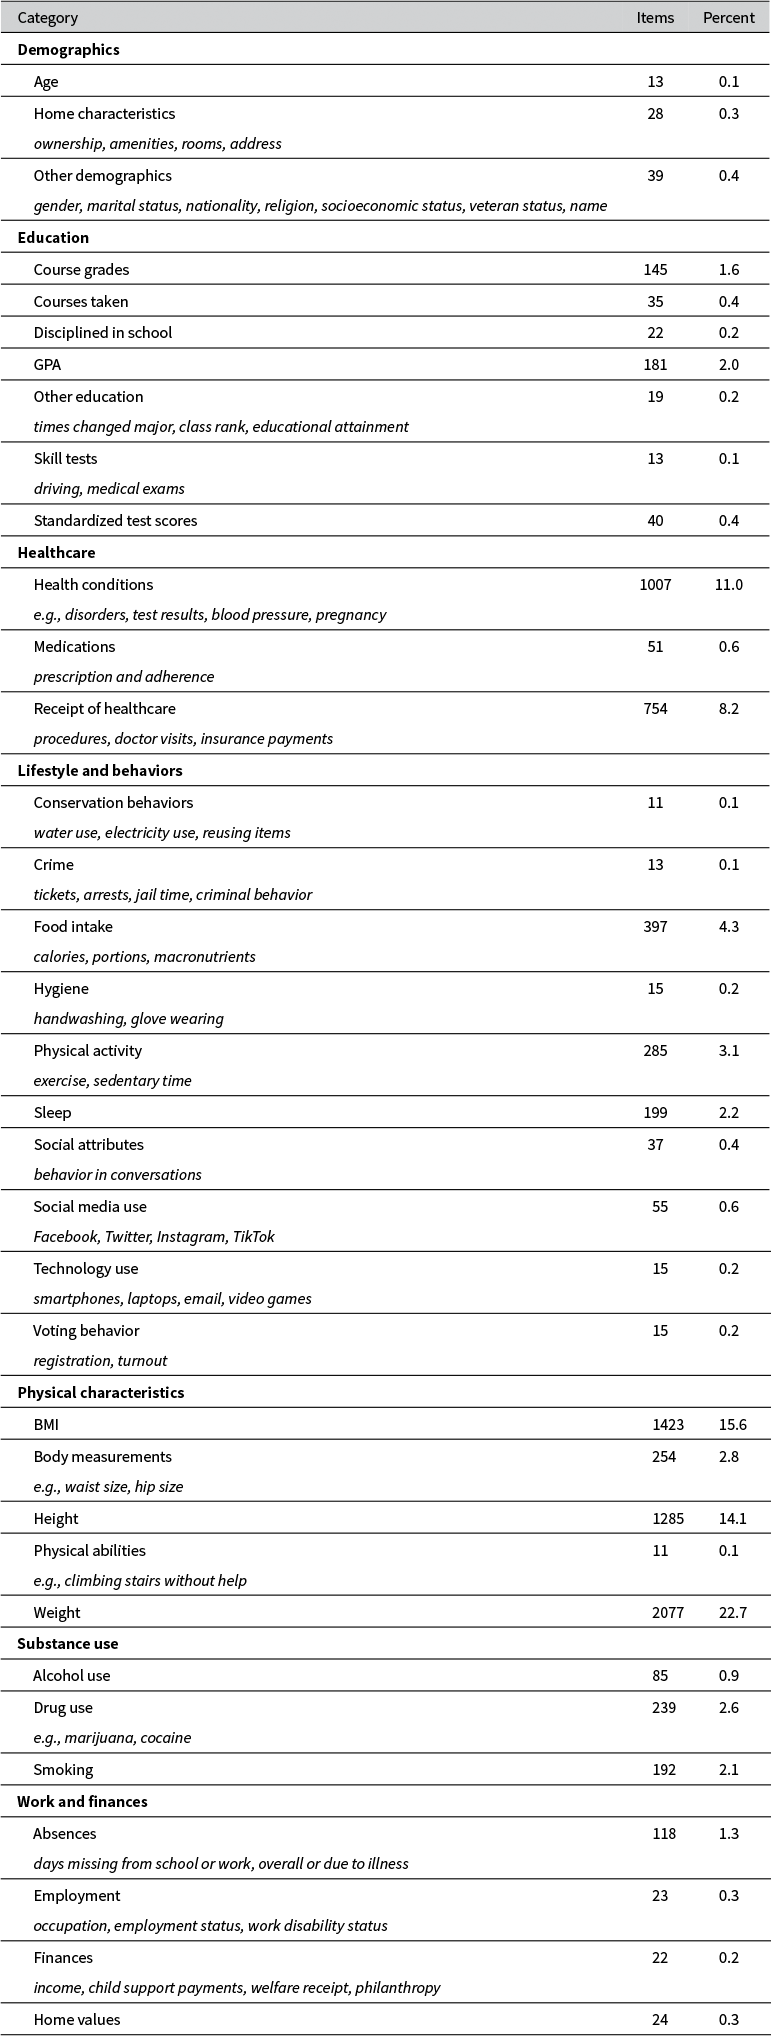
Evidence came from diverse fields: three-quarters of collected measures concerned health and medicine (physical characteristics and healthcare), about one-sixth concerned lifestyle behaviors and substance use, and the remainder concerned education, work and finances, and demographics (see Table 1 for the full distribution across topics). Because similar sources of inaccuracy in self-reports arise across substantive domains—social desirability bias, for example, arises in self-reports of weight just as it does in self-reports of test scores or technology use—evidence from many fields can inform social scientists’ beliefs about the general accuracy of self-reports. In fact, while focused reviews of the accuracy of self-reports in specific domains like voter turnout or mental health are useful to scholars of those subjects, aggregating evidence across diverse domains makes the distinctive contribution of informing researchers’ general expectation of self-reports’ accuracy in new, little-tested or unfamiliar topics.
Distribution of topics.

Table 1. Long description
The table consists of three columns: Category, Items, and Percent. It is divided into six major bolded sections:
1. Demographics: Includes Age (13 items, 0.1 percent), Home characteristics such as ownership and amenities (28 items, 0.3 percent), and Other demographics like gender and religion (39 items, 0.4 percent).
2. Education: Includes Course grades (145 items, 1.6 percent), Courses taken (35 items, 0.4 percent), Disciplined in school (22 items, 0.2 percent), G P A (181 items, 2.0 percent), Other education (19 items, 0.2 percent), Skill tests (13 items, 0.1 percent), and Standardized test scores (40 items, 0.4 percent).
3. Healthcare: Includes Health conditions (1007 items, 11.0 percent), Medications (51 items, 0.6 percent), and Receipt of healthcare (754 items, 8.2 percent).
4. Lifestyle and behaviors: Includes Conservation behaviors (11 items, 0.1 percent), Crime (13 items, 0.1 percent), Food intake (397 items, 4.3 percent), Hygiene (15 items, 0.2 percent), Physical activity (285 items, 3.1 percent), Sleep (199 items, 2.2 percent), Social attributes (37 items, 0.4 percent), Social media use (55 items, 0.6 percent), Technology use (15 items, 0.2 percent), and Voting behavior (15 items, 0.2 percent).
5. Physical characteristics: Includes B M I (1423 items, 15.6 percent), Body measurements (254 items, 2.8 percent), Height (1285 items, 14.1 percent), Physical abilities (11 items, 0.1 percent), and Weight (2077 items, 22.7 percent).
6. Substance use: Includes Alcohol use (85 items, 0.9 percent), Drug use (239 items, 2.6 percent), and Smoking (192 items, 2.1 percent).
7. Work and finances: Includes Absences (118 items, 1.3 percent), Employment (23 items, 0.3 percent), Finances (22 items, 0.2 percent), and Home values (24 items, 0.3 percent).
Note: Each observation is a survey item (i.e., one statistic measuring survey accuracy for a given item and sample). This table omits items not eligible for inclusion in meta-analysis, including those using correlation metrics other than Pearson’s r.
It is useful to think explicitly about the relation between individual-level accuracy and the accuracy of aggregate statistics based on those individual-level reports. Classical true score theory describes an individual measurement with the following equation:

where y is a single measurement (such as a self-report of one’s height),
$\tau$
 is the true characteristic and
$\varepsilon$
 is random measurement error (Lord and Novick Reference Lord and Novick1968). If individual reports differ randomly from objective measures—if one person overreports their height, and another underreports theirs, for example—each individual y can differ from the true value
$\tau .$
 Yet if this measurement error is random (i.e., the expected value of
$\varepsilon$
 is 0), the aggregation of these flawed individual responses can produce an aggregated statistic that is unbiased (see Page and Shapiro Reference Page and Shapiro1992 for an application of this idea to public opinion).
The studies reviewed below reported correspondence between self-reports and objective measures in three ways. Some determined how many respondents’ reports of an attribute exactly matched objective measures of the same attribute. Others reported the difference between a sample’s self-reported and objective means. A final set reported correlations between self-report and objective measures, which capture the degree to which the two measures yield the same ordering and spacing of respondents.
Using each of these methods, meta-analysis finds most self-reports closely matched objective benchmarks. However, accuracy varied greatly across different studies, especially by the topic of the question—though not in easily interpretable ways. The direction of error in self-reports was sometimes in a direction consistent with social desirability bias but could also be explained by other forms of self-report error and error in objective records.
Past research has demonstrated that errors occur not just in self-reports, but also in objective measurements and in matching individuals to objective records. Therefore, what follows is a summary of the extent to which the literature documents matching between self-reports and objective assessments, rather than strictly the accuracy of self-reports. The “accuracy” rates reported here are best thought of as lower-bound estimates of self-report accuracy. In general, this evidence justifies confidence in self-report measurements and identifies directions for future research.
We begin below by providing a conceptual overview of sources of error in survey measurements. We then describe the methods employed to gather and aggregate the data in meta-analysis. Finally, we report the results of that analysis and discuss its implications.
2 Sources of disagreement between surveys and objective measures
Prior work outlines potential explanations for why self-reports can differ from objective measures (see Biemer Reference Biemer2010 for an overview). One form of measurement error in self-reports is social desirability bias, in which respondents present themselves in a more admirable light than is accurate. These errors may be intentional lies (Goffman Reference Goffman1959; Schlenker and Weigold Reference Schlenker and Weigold1989); alternatively, people’s unconscious minds may deceive their conscious minds to avoid acknowledging socially undesirable opinions or behaviors (Krumpal Reference Krumpal2013). For example, people who feel social pressure to vote in elections are especially likely to overstate their turnout in surveys (Bernstein, Chadha, and Montjoy Reference Bernstein, Chadha and Montjoy2001; see also Ansolabehere and Hersh Reference Ansolabehere and Hersh2012).
Measurement error can also be caused by inattentive responding. When accurate reports require cognitive effort, respondents may lack the motivation or ability to answer questions optimally. Respondents may resort to strategies that reduce effort. Satisficing, for example, occurs when respondents take mental shortcuts instead of carefully interpreting questions, retrieving information from memory, integrating information into summary judgments and reporting those judgments (Krosnick Reference Krosnick1991, Reference Krosnick1999). Examples of satisficing are selecting the first or last response option offered, or selecting the same response repeatedly across items. These responses are unlikely to be accurate, creating a gap between self-reports and objective records.
Reporting errors may also be caused by memory issues unconnected to satisficing. Studies assessing self-report accuracy often ask respondents to describe events that occurred in the past. Such self-reports cannot be accurate if a respondent never (correctly) encoded the event in long-term memory at the time it occurred (Richardson Reference Richardson1998; Tversky Reference Tversky1973).
Social desirability bias, satisficing and memory errors all cause self-reports to depart from the truth. But self-reports can also depart from objective measures because of flaws in the objective measure. Objective measures may be insufficiently sensitive to detect behavior that appears in self-reports: for instance, a breath test for tobacco use can fail to detect smoking if a respondent did not smoke heavily or recently (e.g., Petitti, Friedman, and Kahn Reference Petitti, Friedman and Kahn1981). Hospital patient records can suffer from filing errors or clinicians’ lapses, leading to differences from patient reports (e.g., Bergmann et al. Reference Bergmann, Calle, Mervis, Miracle-Mcmahill, Thun and Heath1998; Schmitz, Russell, and Cutrona Reference Schmitz, Russell and Cutrona2002).
Even accurate self-reports and objective records can diverge if the attributes they measure change over time (Jansen et al. Reference Jansen, van de Looij-Jansen, Ferreira, de Wilde and Brug2006; Rodrigues, Goncalves-Silva, and Pereira Reference Rodrigues, Goncalves-Silva and Pereira2013). For example, many people make up their minds about how to vote in elections shortly before the election takes place, so if self-reports of intended vote are collected days or weeks before an election, differences between polls and election results may be due to real changes in candidate support (see Kennedy et al. Reference Kennedy2018).
Incomplete or incorrectly matched records can also introduce error. One example of this involves voter turnout (see Appendix 2 of the Supplementary Material for an extended discussion of this issue). Matching self-reports to administrative records of turnout is of great use in understanding voting behavior (Enamorado, Fifield, and Imai Reference Enamorado, Fifield and Imai2019). But this matching process is imperfect: Berent, Krosnick, and Lupia (Reference Berent, Krosnick and Lupia2016) concluded that matching errors introduced much of the observed difference between self-reported and recorded turnout (but see Ansolabehere and Hersh Reference Ansolabehere and Hersh2012).
Finally, sampling and recruitment may introduce discrepancies between aggregations of self-reports and aggregations of objective measures (Coppock and McClellan Reference Coppock and McClellan2019). For example, discrepancies between self-reports and administrative records of both candidate support and voter turnout arise because of differences in response rates between voters and nonvoters, or supporters of different candidates (e.g., Burden Reference Burden2000; Clinton, Lapinski, and Trussler Reference Clinton, Lapinski and Trussler2022). What’s more, self-reports collected from small samples can differ from population values simply because of sampling error (Lin Reference Lin2018), creating the appearance of inaccuracy when none exists. If self-report and objective measures are collected from different samples of people, these differences can be misdiagnosed as evidence of reporting inaccuracy.
The work described below assesses self-report accuracy through publications that compared self-reports to objective measures of the same construct. While differences could be the result of self-report errors like social desirability bias, satisficing or memory problems, differences could also result from errors in objective measures, changes in the underlying construct, matching problems, or sample differences. This is why the results that follow, which characterize mismatches as errors in self-reports, are best thought of as lower-bound estimates of accuracy.
3 Methodology
A literature search using the search terms “self-report(ed) accuracy,” “survey accuracy,” “self-report error” and “self-report validity” in Google Scholar identified a total of 4,034 publications as of August 2024. From this set, we eliminated articles that did not validate self-reports of events, behaviors and attributes using non-self-report measures of the same construct.Footnote 2 Based on these criteria, a total of 596 publications remained in the final collection.
Some of these publications focused on the assessment of self-report accuracy; others offered statistics on self-report accuracy incidentally. The publications addressed a wide array of topics, including medical conditions, demographics and education. Table 1 shows the distribution of the subject matter.
To allow for the aggregation of information across studies, articles were eligible for inclusion if they used one of three methods of reporting accuracy:
-
1. Method 1 matched each respondent’s self-report with an objective record of the same attribute for that same individual, considering a response “accurate” if the self-report and objective measure matched exactly.Footnote 3 For example, this category includes the percentage of self-reported hospital stays that match hospital records of stays by those patients.
-
2. Method 2 matched means of self-reports with means of objective measures from the same set of individuals. This category includes, for example, comparisons between average self-reported alcohol consumption and average alcohol use measured via lab tests.
Because researchers reported means in various units, all statistics are expressed in terms of the standardized difference (i.e., subtracting the objective mean from the self-report mean and dividing by the standard deviation of the difference).Footnote 4 We present results for both the raw standardized difference in means and the absolute standardized difference; the former, which allows over- and under-reports to cancel to zero, and the latter, which does not, are both of interest.
-
3. Method 3 examines correlations between self-reports and objective measures from the same individuals. In this category are correlations between, for example, students’ reported grades and those from instructor records.
Studies employed a variety of measures of association: Yule’s coefficient of association (Yule’s Y), Cohen’s kappa coefficient (weighted and non-weighted), intraclass correlation coefficient (ICC), Pearson’s correlation coefficient (Pearson’s r), Lin’s concordance coefficient and Spearman’s rank correlation coefficient (Spearman’s ρ). Accuracy is presented separately for each statistic. Each of these measures ranges between −1 and +1, with 0 indicating no association. The stronger the positive association, the greater the match between self-report items and objective benchmarks.
Publications were coded for reported accuracy by a team of trained coders and checked by an independent coder.Footnote 5 The unit of analysis used here is the “survey item,” which is a measure of accuracy for a single item within a single study for a single group. For example, a single article could report accuracy separately for five subgroups; each observation in this analysis would be a single group’s statistic. Coders also recorded the uncertainty around reported accuracy estimates when available (e.g., standard errors or confidence intervals) and survey items’ sample sizes.
To produce aggregate estimates of accuracy across all survey items, we conducted meta-analyses using the metafor package in R (Viechtbauer Reference Viechtbauer2010). Articles are modeled as random effects, with random effects for individual survey items nested within them; items with lower variance receive greater weight. Formally, we estimate μ—the average true rate of self-report accuracy—using the random effects model:

where θ ij is the true rate of accuracy in a survey item i within article j, vj represents article-specific heterogeneity in accuracy in article j, and uij represents survey item-specific heterogeneity in accuracy in survey item i in article j, with both random effects assumed to be normally distributed with mean 0 and variances σv 2 and σu 2 respectively (Viechtbauer Reference Viechtbauer2010). Standard errors of meta-analytic estimates are clustered at the level of the article to account for dependence between measures in the same article. In our investigation of predictors of accuracy, potential moderators are modeled as fixed effects. We also present simple means of accuracy estimates across all survey items, including those which cannot be included in the meta-analytic estimates because their sample size and/or variance are not available.
4 Results
Figure 2 summarizes the results. The figure shows the full distribution of accuracy for each of the three reporting methods, with quartiles marked in solid lines. The distributions of item accuracy are skewed, with most items being fairly accurate and a long tail of items very inaccurate. Meta-analytic estimates of accuracy for Methods 1 and 2 are shown with bold dashed lines: we estimate that 77% of self-reports agreed exactly with their objective records, and self-report means differed from objective record means by 20% of a standard deviation. Correlations between self-reports and objective records differed considerably by statistic.
Distributions of Methods 1, 2 and 3 accuracy. Violins represent the distribution of accuracy, with 25th, 50th and 75th percentiles marked. For Method 1 and Method 2, the meta-analytic estimate of accuracy is marked with a dashed line. Method 2’s scale is reversed so higher vertical estimates are more accurate; the y-axis is truncated at 1 (omitting 188 items) for visibility.

Figure 2. Long description
The figure consists of three panels under the title Distribution of Accuracy.
Top-left panel: Method 1: Proportion Match. The y-axis ranges from 0.00 to 1.00. A single wide violin plot is centered over the x-axis label Current Attributes. The distribution is heavily skewed toward the top, with the 75th percentile near 0.9, the 50th percentile median near 0.8, and the 25th percentile near 0.6. A horizontal dashed line representing the meta-analytic estimate sits at approximately 0.77.
Top-right panel: Method 2: Abs. St. Mean Difference. The y-axis is reversed, ranging from 0.00 at the top to 1.00 at the bottom. The distribution is concentrated at the top near 0.00. The 75th percentile is near 0.05, the median is near 0.1, and the 25th percentile is near 0.28. A horizontal dashed line for the meta-analytic estimate is positioned at 0.20.
Bottom panel: Method 3: Correlation. The y-axis ranges from 0.00 to 1.00. Seven violin plots are arranged horizontally, corresponding to different statistical measures:
* Cohen's Kappa: Median near 0.65, wide distribution.
* I C C: Median near 0.55, elongated tail toward 0.1.
* Kappa (weighted): Median near 0.85, concentrated at the top.
* Lin's Concordance: Median near 0.8, wide upper body.
* Pearson's R: Median near 0.5, very long tail reaching toward 0.0.
* Spearman's rho: Median near 0.4, bimodal appearance.
* Yule's Y: Median near 0.75, truncated distribution between 0.5 and 1.0.
4.1 Method 1: Percentage agreement
A total of 2,075 survey items from 260 articles reported the proportion of respondents whose self-report matched their objective record exactly. The simple average of reported accuracy among these items is 74%—that is, an average of 74% of respondents reported their attribute with perfect accuracy—while the median was 81%. Of these items, 1,874 were reported with a sample size, allowing them to be included in the meta-analysis. The meta-analytic estimate of Method 1 accuracy is 77% (SE = 0.013); that is, about one-quarter of self-reports failed to match their objective records.
4.2 Method 2: Aggregate comparisons
A total of 6,109 survey items from 326 articles reported the difference between the average self-report and the average objective measure. For the 5,321 items reporting sufficient information to calculate the standardized difference,Footnote 6 the raw mean standardized difference is 0.065, while the median is 0. The meta-analytic estimate of the difference is 0.03 (SE = 0.016): self-report and objective means differed by about 3% of a standard deviation.
While the raw difference averages across over- and under-reports, an alternative metric of interest is the absolute value of this difference, which characterizes the difference between the self-reported and objective values regardless of direction. The mean absolute standardized difference is 0.26, the median is 0.08 and the meta-analytic estimate is 0.20 (SE = 0.016); that is, self-reported and objectively measured means differed by about a fifth of a standard deviation.
4.3 Method 3: Measures of association
A total of 2,622 survey items from 256 studies reported correlations between self-reported and objectively measured attributes, through a range of correlation types. Figure 2 shows that the distribution of accuracy varies widely between types of correlations: median accuracy measured by Cohen’s weighted Kappa, ICC, Lin’s coefficient, Pearson’s r and Yule’s Y was near or above 0.75, while accuracy measured by Cohen’s Kappa and especially Spearman’s rho was noticeably lower. Because these correlations capture different kinds of relationships (e.g., linear relationships in Pearson’s r vs. consistent ordering in Spearman’s rho) between different types of data (e.g., continuous in Pearson’s r vs. categorical for Cohen’s kappa), comparisons between measures are of limited use.
For meta-analysis, we focus on the 957 items from 117 studies that reported Pearson’s r coefficient.Footnote 7 Among these items, the mean r value is 0.73, and the median is 0.85. The meta-analytic estimate of the correlation between self-reported and objectively measured values is 0.77 (SE = 0.02), a strong correlation by typical standards (Schober, Boer, and Schwarte Reference Schober, Boer and Schwarte2018).
5 Variation in match rates
As Figure 2 illustrates, the studies reviewed here varied in their accuracy. This section explores this variation in two ways. First, we conduct meta-regressions to determine which attributes of survey items are associated with greater accuracy. Second, we identify substantive domains in which self-reports were more or less accurate than the typical item and draw on the reviewed studies to offer possible explanations.
First, to systematically test whether features of survey items can explain their accuracy, we conduct meta-regressions predicting accuracy using four attributes: the sample size on which the accuracy estimate was based, the year of the article’s publication, the time elapsed between the self-report and the attribute being objectively measured (past vs. present),Footnote 8 and the substantive domain of the question (explored in greater detail below).Footnote 9
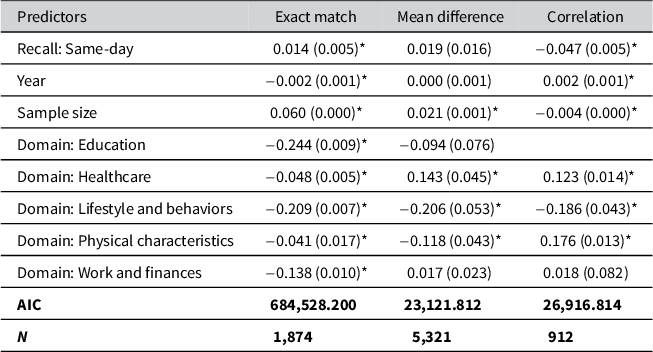
Table 2 summarizes predictors of accuracy across the three methods. Self-reports were not consistently more accurate when they concerned present, rather than past, attributes, nor did they differ consistently by year of publication. For both Method 1 and Method 2, survey items based on larger samples displayed more accuracy, though the reverse was true of Method 3. Survey items concerning lifestyle and behaviors were consistently less accurate, while accuracy varied for other domains.
Predictors of accurate responses by accuracy measure.

Table 2. Long description
The table consists of four columns: Predictors, Exact match, Mean difference, and Correlation.
* Recall: Same-day: Exact match 0.014 0.005 asterisk; Mean difference 0.019 0.016; Correlation minus 0.047 0.005 asterisk.
* Year: Exact match minus 0.002 0.001 asterisk; Mean difference 0.000 0.001; Correlation 0.002 0.001 asterisk.
* Sample size: Exact match 0.060 0.000 asterisk; Mean difference 0.021 0.001 asterisk; Correlation minus 0.004 0.000 asterisk.
* Domain: Education: Exact match minus 0.244 0.009 asterisk; Mean difference minus 0.094 0.076; Correlation is blank.
* Domain: Healthcare: Exact match minus 0.048 0.005 asterisk; Mean difference 0.143 0.045 asterisk; Correlation 0.123 0.014 asterisk.
* Domain: Lifestyle and behaviors: Exact match minus 0.209 0.007 asterisk; Mean difference minus 0.206 0.053 asterisk; Correlation minus 0.186 0.043 asterisk.
* Domain: Physical characteristics: Exact match minus 0.041 0.017 asterisk; Mean difference minus 0.118 0.043 asterisk; Correlation 0.176 0.013 asterisk.
* Domain: Work and finances: Exact match minus 0.138 0.010 asterisk; Mean difference 0.017 0.023; Correlation 0.018 0.082.
* A I C: Exact match 684,528.200; Mean difference 23,121.812; Correlation 26,916.814.
* N: Exact match 1,874; Mean difference 5,321; Correlation 912.
Note: Numbers in parentheses are robust standard errors. Asterisks indicate p less than 0.05.
Note: Numbers represent the coefficient on each predictor in a metaregression of accuracy (at the survey item level) on the predictor, with robust standard errors clustered at the study level in parentheses. Method 2 (mean absolute difference) coefficients are multiplied by −1 so positive values mean more accuracy, for consistency with other methods. Omitted categories are: for recall, 1 day or more; for domain, demographics.
*p < 0.05.
That self-reports were more accurate in studies with larger sample sizes (in Methods 1 and 2) is suggestive evidence that our estimates of accuracy are not inflated by publication bias. Common tests of publication bias rely on the notion that pressure to publish statistically significant results will produce a correlation between a study’s precision and its effect size: if studies must reach a threshold of a particular effect size to be published, studies with less precise estimates will have larger effect sizes than those with more precise estimates (Egger et al. Reference Egger, Smith, Schneider and Minder1997). Here, on the contrary, studies with more precise estimates of survey accuracy have smaller gaps between self-reported and objective measures.Footnote 10 That is, if anything, the publication process is selecting studies that estimate lower accuracy.
A deeper exploration of some common domains can help illustrate when and why survey items are more or less accurate. Figure 3 presents the accuracy of question types across each method. First, to identify domains that were more and less accurate overall, the top row of Figure 3 shows Method 1, Method 2 (absolute difference) and Method 3 accuracy; the figure highlights questions that are more (blue) and less (red) accurate than the method’s average. Second, to identify domains with systematic bias in a particular direction (over- or under-reporting the quantity of interest), the bottom row shows Method 2 mean differences, or bias.
Estimates of self-report accuracy by question domain. Row 1 shows the Method 1, Method 2 (absolute difference) and Method 3 accuracy, with items 2 standard deviations more (less) accurate than the overall estimate in blue (red). The overall accuracy estimate is marked with a dashed line, while perfect accuracy is marked with a solid line. Row 2 shows the Method 2 (mean difference) accuracy by question domain, such that higher numbers represent overreporting of the attribute and lower numbers represent underreporting. Note that the scores/grades estimate exceeds 1 for percent match because a single study containing both scores/grades and absences data ties those estimates together; excluding that study gives an estimate of 0.56 for scores/grades.

Figure 3. Long description
The top row contains three panels sharing a common y-axis labeled Question Type. The y-axis lists 14 domains including Substance Use, Home Value, Received Medical Care, Took Medication, School/Work Absences, Weight, Scores/Grades, Body Measurements, Medical Condition, B M I, Height, Exercise Amount, Sedentary Time, Sleep, and Food Intake.
* The first panel, Percent Match, has an x-axis from 0.4 to 1.2. Most items cluster around a dashed line at 0.78. Took Medication is a red outlier at 0.6. Scores/Grades and Medical Condition are blue outliers above 1.0.
* The second panel, Absolute Difference, has an x-axis from 0.0 to 1.2. Substance Use, Home Value, Received Medical Care, Took Medication, and School/Work Absences are blue outliers near 0.1. Exercise Amount, Sedentary Time, and Food Intake are red outliers between 0.5 and 0.8.
* The third panel, Correlation, has an x-axis from 0.2 to 1.0. Weight, B M I, and Height are blue outliers near 0.9. Scores/Grades, Exercise Amount, and Food Intake are red outliers below 0.8.
The bottom row is a single large panel titled Mean Difference. The x-axis represents the Difference between Self-Report and Objective, ranging from -0.5 to 0.5. A dashed line marks the overall mean near 0.0. Exercise Amount and Received Medical Care show positive mean differences (overreporting), while Food Intake and Sleep show significant negative mean differences (underreporting) with wide error bars.
5.1 Physical attributes: Height, weight and BMI
Patterns across methods in the accuracy of self-reports of physical attributes (height, weight and BMI) are a useful illustration of what each method captures. In Method 1 and Method 2 (absolute), the accuracy of self-reported height, weight and BMI was similar to the overall estimate. The bottom panel, Method 2 (bias), shows that respondents tend to overreport their height, while underreporting their body measurements, weight and BMI. These tendencies are consistent—for example, of 1,060 Method 2 survey items measuring weight with some bias, 795 showed underreporting—though not large: in substantive terms, respondents overreported their height by 0.035 to 2 cm in items with accuracy near these questions’ meta-analytic estimates.
Finally, in Method 3, the correlations between self-reported and objective measures are high (0.87 to 0.93) compared to other domains and methods—perhaps because a strong linear relationship between self-reports and objective measures could emerge even with frequent misreporting if those misreports were biased in consistent ways across respondents.Footnote 11
One explanation for overreporting height while underreporting weight, BMI and measurements is social desirability bias: people may report being taller and slimmer than they are because these traits are socially valued. Past work suggests many respondents round or shift their reports in a socially desirable direction, especially if they are sensitive to social judgment (Burke and Carman Reference Burke and Carman2017; Larson Reference Larson2000; Taylor et al. Reference Taylor2006).
Another possibility is that people are not aware of their up-to-date weight or height (see Brestoff, Perry, and Van den Broeck Reference Brestoff, Perry and Van den Broeck2011). Respondents typically reported their size on a survey, then had their size measured; self-reports could only be based on a memory of one’s size measured at an earlier date. As people tend to lose height and gain weight as they age, a memory of an earlier measurement could lead to inaccurate self-reports resembling social desirability bias (Burke and Carman Reference Burke and Carman2017; Taylor et al. Reference Taylor2006).
5.2 Lifestyle behaviors: Fitness, food, sleep and substance use
Questions about respondents’ health-related behaviors often showed noticeable bias: self-reports of sleep, food intake, sedentary time and physical activity were among the least accurate items, though only food intake departed from the objective records by as much as half a standard deviation on average. On average, subjects overreported their exercise, while underreporting their sedentary time, sleep and food intake. Though it is possible social desirability bias again plays a role here, encoding issues and problems with objective records are likely contributors to inaccuracy.
Self-reports of physical activity are often based on memory; respondents are asked to report how long they spent sitting or exercising over the past day, week or month. As in many measures of time use, people can fail to encode this kind of information in memory at the time these activities occur, so attempts at recalling them can be inaccurate (Foley et al. Reference Foley, Maddison, Olds and Ridley2012). That these reports tend in the direction of more physical fitness, rather than simply random error, suggests a recall and reporting process biased toward self-enhancement. Similar concerns apply to food intake, which is typically measured by asking how frequently the respondent consumed various foods in recent weeks.
Physical activity is also an area with significant problems in the objective records to which self-reports were compared. Accelerometers, often used to measure sleep, sedentary time and exercise, can undercount certain kinds of movements (Slootmaker et al. Reference Slootmaker, Schuit, Chinapaw, Seidell and van Mechelen2009) and are especially inaccurate in capturing sedentary time. This means “overreports” of physical activity may reflect undercounted activity by objective measurement tools.
Substance use questions showed typical accuracy—about average in Method 1, higher in Method 2 and marginally lower in Method 3. A plurality of Method 3 survey items showed no bias. A reader concerned about social desirability may have expected respondents to underreport substance use, a stigmatized set of behaviors. However, several of the studies included here mentioned a measurement bias pointing in the opposite direction: objective measures (like urine or blood tests) of substance use can be insufficiently sensitive, failing to detect substance use among some users (e.g., Williams and Nowatzki Reference Williams and Nowatzki2005). The overall lack of bias could reflect a balance between these two tendencies.
5.3 Health conditions
Reports of health conditions showed high levels of accuracy: if someone reported having a health condition, an objective record confirmed that diagnosis much of the time. Discrepancies were most often due to self-reports missing a health condition an exam or medical records diagnosed.
The studies reviewed suggest possible lack of knowledge as the most important reason for underreporting health conditions. For example, a blood pressure test could show a patient has hypertension without the patient being aware of their condition (Goncalves et al. Reference Gonçalves, Andrade, Carvalho, Silva, Pereira and Galvao2018). They may have developed hypertension since their last test, or their doctor may not have communicated this diagnosis to the patient. On the other hand, some medical conditions were overreported compared to objective records. Errors in the objective validation method are a potential culprit here: medical records can fail to reflect all health conditions, for example, if a person changes providers or the diagnosis in question is recent or dated (Zhu et al. Reference Zhu, Mcknight, Stergachis, Daling and Levine1999).
5.4 Patterns across domains
The survey items for which self-reports were most inaccurate included questions about sleep, food intake and physical activity. Reports of physical attributes showed small but consistent biases. Medical outcomes had middling levels of accuracy. Self-enhancing biases, including social desirability bias, may play a role, as may memory errors. But the size of these biases varies greatly, from the understatement of one’s weight by one-tenth of a standard deviation to the understatement of one’s food intake by 50% of a standard deviation. Further, researchers should not discount the possibility that some inaccuracy is due to errors in objective records or the matching of records to participants; insensitive tests or incomplete records can explain differences that may appear at first glance to be due to self-report error. Finally, even in the domains with the lowest accuracy, correlations between self-reports and objective records were moderate, and self-report means were biased by no more than 50% of a standard deviation.
6 Conclusion
By studying more than 10,000 statistics on survey accuracy from nearly 600 publications, this article provided a thorough review of the validity of self-reports across a variety of fields. The evidence reviewed here shows that a negative image of self-report measures is unfounded: the vast majority of survey measures of objective phenomena were found to match well with objective records. This challenges the assumptions of editors and peer reviewers who, when they encounter work relying entirely on self-reports, are “biased against the study and believe that it contributes very little”—a bias “many people share” (Campbell Reference Campbell1982; see also Chan Reference Chan2010).
Self-report and non-self-report measures often coincided across all three assessment methods. Close matches were observed between self-reports and objective records for the same individual, with an estimated 77% of records matching exactly, as well as between aggregated self-reports and aggregated objective measures, with a mean difference of only 3% of a standard deviation and an absolute difference of 20% of a standard deviation. And strong correlations—an estimated Pearson’s r of 0.77—were found between self-reports and objective measures of the same individuals. Surveys with larger sample sizes yielded more accurate measures on average, but there were no clear differences in accuracy by length of the recall period.
For some measures, self-reports were skewed in directions consistent with social desirability response bias. However, these discrepancies were often small, and the precise role of social desirability (versus other factors, such as memory and errors in objective records) is unclear. More work is needed to understand why certain types of self-reports are subject to certain types of systematic bias. Future work should move beyond descriptive assessments of accuracy to experimentally evaluate its potential causes: researchers could hold all item attributes constant and vary only, for example, the social desirability of the attribute being assessed (or see Bullock et al.’s (Reference Bullock, Gerber, Hill and Huber2015) experiment with incentives).
One potential concern with the present findings is that evidence of accurate self-reports is more likely to be published than evidence of inaccurate reports. If such publication bias has occurred, it would lead this review to characterize self-reports as being more accurate than a full set of evidence would. However, our analysis of sample size suggests that, if anything, better-powered studies found higher levels of accuracy. It additionally seems unlikely that the investigators responsible for the evidence reviewed here were incentivized to report accurate self-reports. All the studies reviewed here, by definition, involved the collection of objective measures of their phenomena of interest; the investigators were at least open to the possibility that the self-reports were inaccurate, and they did not need to rely only on self-reports.
As noted above, it is best to view these findings as lower-bound estimates of self-report accuracy: errors in objective measures or in the processes of matching respondents to their objective records can introduce error as well, including errors in billing records, insensitive medical tests and more.
It is important to acknowledge that the number of survey items on which conclusions were based varied across statistics and domains. For instance, fewer survey items were available for questions about home values than questions about height and weight. Findings based on few observations may not be reliable. Further, some important topics did not arise frequently enough in this data to allow for estimation of their accuracy—including, notably, voter turnout. Topic-specific reviews of evidence (e.g., DeBell et al. Reference DeBell, Krosnick, Gera, Yeager and McDonald2020) are better-suited to understanding accuracy of self-reports in domains that arose infrequently in this generalized search.
The approach we take here can only assess the validity of self-reports on questions for which an objective verification method is available. This approach cannot speak to the accuracy of self-reports on attributes that have no direct objective equivalent, like attitudes on sensitive topics. Our approach is also limited to research that collected self-reported and objective measures from the same respondents, which eliminates many articles of interest in political science that compare aggregate estimates from surveys of, for example, vote choice to estimates drawn from administrative records.
More broadly, though our search procedure was field-agnostic, a large share of the evidence that arose concerned reports of medical outcomes or lifestyle behaviors. Political scientists may note with particular interest the findings on domains that we more often use directly in our work—demographic measures, for example. The typical levels of accuracy observed in reports of home values and test scores may also be informative about other financial or skill-related self-reports. But the accuracy of items in less familiar domains remains informative about the general validity of the self-report as a method—especially so because levels of accuracy do not consistently differ across domains (with the exception of lower accuracy in measures of lifestyle and behaviors).
In sum, this article contributes to the literature on self-reports by providing a comprehensive summary of the available evidence on matches between self-reports and objective records across a wide array of topics and methods of assessment. Although match rates varied across substantive topics, this article supports the conclusion that lower-bound estimates of accuracy are impressively high.
Acknowledgments
The authors thank Diana Jordan, Kelly Kim, Kyra Whitelaw, Larissa Bersh, Lucas Simoes, Matthew Jacquez, Montana Riggs, Olivia Manes, Sierra Burgon, Stacie Carlton, Ashley Wright, Monica Dashen, Utku Akbay, Aaron Fernandes, Abigail Chee, Jinie Chon, Lavanya Sundar, Jordan Stock and Joshua Koch for building the datafile. Jon Krosnick is a University Fellow at Resources for the Future. The authors thank all the investigators whose studies are analyzed here and apologize to all authors whose work should have been included but was not picked up in our searching. We hope the latter authors will send us their articles, so we can include them in an update of this article.
Data availability statement
Replication code for this article has been published in the Political Analysis Harvard Dataverse at https://doi.org/10.7910/DVN/QJOMLG (Elder et al. Reference Elder2026).
Supplementary material
To view supplementary material for this article, please visit http://doi.org/10.1017/pan.2026.10054.



 Open access

