1. Introduction
More than a century ago, Osborne Reynolds investigated the transition to turbulence in a glass pipe into which he injected a filament of dye at the inlet (Reynolds Reference Reynolds1883). Reynolds noticed that the characteristics of the dye filament and hence the entire flow field depended on the dimensionless flow rate, or the Reynolds number,
 $\mathit{Re}=UD/{\it\nu}$
(here,
 $U$
is the mean flow velocity,
 $D$
is the pipe diameter, and
 ${\it\nu}$
is the fluid kinematic viscosity). When
 $\mathit{Re}$
was below a critical value,
 $\mathit{Re}\ll \mathit{Re}_{cr}$
, the dye propagated downstream as a thin filament without breaking up, indicating a laminar flow in the pipe. At
 $\mathit{Re}\geqslant \mathit{Re}_{cr}$
, this pattern changed dramatically: waves appeared in the vicinity of the inlet, sometimes leading to substantial flow randomization downstream. With increasing
 $\mathit{Re}$
, the fraction of the tube length occupied by these waves increased, and at
 $\mathit{Re}\gg \mathit{Re}_{cr}$
, the entire flow became turbulent.
Reynolds, however, was unable to determine a unique value for
 $\mathit{Re}_{cr}$
. He noticed that the value of
 $\mathit{Re}_{cr}$
was sensitive to various imperfections, most notably the geometry of the inlet. If the inlet was sharp, inlet perturbations appeared in the form of shed vortices that caused transition to turbulence at large Reynolds numbers. These perturbations, however, rapidly decayed downstream, if the Reynolds number was not too large. By carefully eliminating these, Reynolds was able to delay the transition up to
 $\mathit{Re}\approx 12\,800$
(Reynolds Reference Reynolds1883). Others following Reynolds were able to sustain laminar flows in pipes even for Reynolds numbers as high as 100 000 (Pfenninger Reference Pfenninger and Lachman1961). Relatively recently, the effects of initial (inlet) perturbations on
 $\mathit{Re}_{cr}$
were quantified by introducing well-controlled disturbances (jets) injected through holes in the vicinity of the inlet (Darbyshire & Mullin Reference Darbyshire and Mullin1995). Consistent with Reynolds’ observations, the flow became turbulent at smaller and smaller Reynolds numbers as the ratio of the disturbance velocity to the mean flow velocity was increased (for a comprehensive review, see Yaglom Reference Yaglom and Frisch2012).
The above-described ‘decay or amplification’ of waves (or perturbations) forms the basis of Landau’s phenomenological theory of transition (Landau & Lifshitz Reference Landau and Lifshitz1987). It must be stressed that, based on his general approach which revolutionized the theory of critical phenomena, Landau was not interested in the notoriously difficult and non-universal problem of deriving the value of the critical (transitional) Reynolds number
 $\mathit{Re}_{cr}$
. Instead, he assumed the existence of a transitional (marginal) velocity distribution
 $\bar{\boldsymbol{u}}$
at
 $\mathit{Re}=\mathit{Re}_{cr}$
, and attempted an investigation of the general and universal flow properties in the vicinity of
 $\mathit{Re}_{cr}$
in terms of a small perturbation velocity
 $\boldsymbol{v}$
. Then, under the small (infinitesimal) perturbation, the total velocity becomes
 $\boldsymbol{u}=\bar{\boldsymbol{u}}+\boldsymbol{v}$
, and the total pressure becomes
 $p=p_{0}+p_{1}$
with
 $p_{0}$
being the transitional pressure distribution and
 $p_{1}$
being the perturbation. In general, the field
 $\bar{\boldsymbol{u}}$
can be time-dependent but, following Landau, we assume the transitional pattern to be steady. The Navier–Stokes equations can then be written as
 $$\begin{eqnarray}\displaystyle \bar{\boldsymbol{u}}\boldsymbol{\cdot }\boldsymbol{{\rm\nabla}}\bar{\boldsymbol{u}}=-\frac{\boldsymbol{{\rm\nabla}}p_{0}}{{\it\rho}}+{\it\nu}{\rm\nabla}^{2}\bar{\boldsymbol{u}},\quad \boldsymbol{{\rm\nabla}}\boldsymbol{\cdot }\bar{\boldsymbol{u}}=0;\end{eqnarray}$$
 $$\begin{eqnarray}\displaystyle \frac{\partial \boldsymbol{v}}{\partial t}+\bar{\boldsymbol{u}}\boldsymbol{\cdot }\boldsymbol{{\rm\nabla}}\boldsymbol{v}+\boldsymbol{v}\boldsymbol{\cdot }\boldsymbol{{\rm\nabla}}\bar{\boldsymbol{u}}+\boldsymbol{v}\boldsymbol{\cdot }\boldsymbol{{\rm\nabla}}\boldsymbol{v}=-\frac{\boldsymbol{{\rm\nabla}}p_{1}}{{\it\rho}}+{\it\nu}{\rm\nabla}^{2}\boldsymbol{v},\quad \boldsymbol{{\rm\nabla}}\boldsymbol{\cdot }\boldsymbol{v}=0.\end{eqnarray}$$
Both
 $\bar{\boldsymbol{u}}$
and
 $\boldsymbol{v}$
vanish on solid walls. Neglect of the
 $\mathit{O}(v^{2})$
contribution to (1.2a,b
) results in linearized Navier–Stokes equations to be used for investigating instabilities in fluid flows. Now, the task is to find a solution to (1.1) and (1.2) describing the time evolution of an initially (
 $t=0$
) infinitesimally small perturbation
 $\boldsymbol{v}$
. In this case, the
 $\mathit{O}(v^{2})$
contribution to (1.2a
) is neglected. For the perturbation, Landau assumed the form
 $\boldsymbol{v}(\boldsymbol{r},t)=A(t)\boldsymbol{f}(\boldsymbol{r})$
, where
 $A(t)=\text{constant}\times \text{e}^{-\text{i}{\it\Omega}t}$
is the slowly varying amplitude with a complex eigenfrequency,
 ${\it\Omega}={\it\omega}+\text{i}{\it\gamma}$
, and
 $\boldsymbol{f}(\boldsymbol{r})$
describes the spatial dependence. If the near-wall effects are not too important, one can write the differential equation (in the frame of reference moving with the mean flow)
 $$\begin{eqnarray}\frac{\text{d}|A|^{2}}{\text{d}t}=2{\it\gamma}_{1}|A|^{2}-{\it\alpha}|A|^{4},\end{eqnarray}$$
which is to be solved subject to an initial perturbation
 $A(0)=A_{0}$
. The solution to this equation is
 $$\begin{eqnarray}\frac{|A(t)|^{2}}{|A_{0}|^{2}}=\frac{\text{e}^{2{\it\gamma}_{1}t}}{1+|A_{0}|^{2}\displaystyle \frac{{\it\alpha}}{2{\it\gamma}_{1}}(\text{e}^{2{\it\gamma}_{1}t}-1)}.\end{eqnarray}$$
Indeed, setting
 ${\it\gamma}=c(\mathit{Re}-\mathit{Re}_{cr})$
, one can reproduce the observed ‘decay or amplification’ of perturbations. When
 $\mathit{Re}-\mathit{Re}_{cr}<0$
,
 $A(t)\rightarrow 0$
in the limit
 $t\rightarrow \infty ~(t\gg 1/{\it\gamma})$
; otherwise, the amplitude grows, saturating at
 $|A(\infty )|\propto \sqrt{\mathit{Re }-\mathit{ Re }_{cr}}$
. The theory suggests that information about the initial conditions disappears on a time scale
 ${\it\tau}=(1/(2|{\it\gamma}_{1}|))\propto (1/(|\mathit{Re}-\mathit{Re}_{cr}|))$
. This behaviour is similar to the ‘critical slowing down’ in the proximity of a critical point in phase transitions. In pipe flows, it has important and interesting consequences. A perturbation occurring at position
 $l$
and being advected by a mean flow of velocity
 $U$
stays in the pipe for a time interval
 $t_{0}\approx (L-l)/U$
, where
 $L$
is the pipe length. Therefore, to observe the decay of a perturbation generated in the bulk or its growth towards a final turbulent state, one needs
 $t_{0}\gg {\it\tau}$
, requiring unreasonably long pipes around
 $\mathit{Re}_{cr}$
. The divergent relaxation time
 ${\it\tau}\propto |\mathit{Re}-R_{cr}|^{-{\it\zeta}}$
, with
 ${\it\zeta}\approx 0.56$
, was also recently obtained in numerical simulations of transition in force-driven Navier–Stokes equations by McComb et al. (Reference McComb, Linkmann, Berera, Yoffe and Jankauskas2014).
Landau’s theory of transition, although insightful, is better applicable to wakes in flows past bluff bodies (Sreenivasan, Strykowski & Olinger Reference Sreenivasan, Strykowski, Olinger and Ghia1987) and in convection, i.e. in situations where wall effects and viscosity do not dominate. It is well justified in pipe flows when the characteristic size of a perturbation is
 $\mathit{O}(D)$
and wall effects are unimportant. Efforts to describe transition in pipes using the Landau theory, most notably by Stuart and others (Stuart Reference Stuart1971), focused on obtaining the magnitudes of the coefficients
 ${\it\gamma}_{1}$
and
 ${\it\alpha}$
and testing their possible universality. This universality remains elusive, suggesting that wall effects must be important in transition. Numerical simulations and experimental data show that, at least in the range
 $2300\leqslant \mathit{Re}\leqslant 10^{5}$
, powerful bursts generated by unstable boundary layers are mainly responsible for turbulence production in the bulk.
The majority of workers studying the transition to turbulence in pipes have been interested in the flow response to perturbations in otherwise perfect pipes (Yaglom Reference Yaglom and Frisch2012). This interest can partially be explained by the mathematical well-posedness of the problem and by the emergence of numerical methods combined with powerful computers. Conversely, the ‘fuzzy’ problem involving inlet disturbances, pipe imperfections and pipe roughness has not attracted as much attention (Pausch & Eckhardt Reference Pausch and Eckhardt2015). In this article, we investigate both experimentally and theoretically the transition to turbulence in imperfect channels. In other words, we are not interested in reducing the roughness or removing wall and inlet imperfections. Specifically, we strive to quantify growing perturbations near the wall by their spectra and statistical properties, including probability densities and low- and high-order moments. Remarkably, we observe that, while low-order moments are relatively independent of the experimental details, high-order moments are extremely sensitive to these details and may differ by orders of magnitudes. To describe our experimental observations, we propose a modified Landau theory in which all imperfection-induced flow disturbances are treated as added high-frequency noise. This theory agrees well with our experimental observations. An important consequence of this theory is that the noise regularizes the Landau singularity of the relaxation time. It must be emphasized that, in this regime (i.e. in imperfect channels), turbulence is constantly driven by noise, which makes the problem very different from the initial-value problem considered by Hof et al. (Reference Hof, Westerweel, Schneider and Eckhardt2006).
2. Experiments
2.1. Experimental set-up
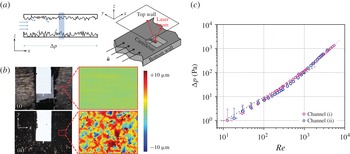
We performed our experiments in two nominally identical rectangular channels with linear dimensions
 $L_{x}\times L_{y}\times L_{z}=35\times 8\times 0.9~\text{mm}^{3}$
and with hydraulic diameters
 $D\approx 1.6~\text{mm}$
. A pressurized air source is used to establish air flow in each channel. The flow rate is monitored using a rotameter, and the pressure drop
 ${\rm\Delta}p$
between the inlet and the outlet is measured using a differential gauge. The near-wall flow in each channel is probed by a rectangular microcantilever with linear dimensions
 $l_{x}\times l_{y}\times l_{z}=27.5\times 225\times 3~{\rm\mu}\text{m}^{3}$
(figure 1
a,b). In the first channel (henceforth channel (i)), the chip carrying the microcantilever is embedded in the bottom wall of the microchannel by a surrounding aluminium structure that is cut from an
 ${\sim}300~{\rm\mu}\text{m}$
-thick smooth sheet (matching the height of the chip) and glued to the bottom wall (figure 1
b). The root-mean-square (r.m.s.) roughness on the wall is
 ${\sim}300~\text{nm}$
. In the second channel (henceforth channel (ii)), a groove, which matches the size of the cantilever chip closely, is machined on the bottom channel wall (figure 1
b). The r.m.s. roughness on this wall is significantly larger,
 ${\sim}3~{\rm\mu}\text{m}$
. In both channels, the test section is approximately 17 mm (
 ${\approx}11D$
) from the inlet. Because turbulence is driven and sustained by noise due to imperfections in our channels, the distance of the test section from the inlet is sufficient for the observation of the transition (Zagarola & Smits Reference Zagarola and Smits1998). Both channels have smooth and transparent top walls, and the motion of the tips of the microcantilevers is read out using the optical beam deflection technique (Meyer & Amer Reference Meyer and Amer1988). We confirm that our optical transducer remains linear in the explored parameter space.
(a) Rectangular channel with linear dimensions
 $L_{x}\times L_{y}\times L_{z}=35\times 8\times 0.9~\text{mm}^{3}$
. The test section is highlighted. The microcantilever chip is integrated into the middle of the bottom wall. (b) Optical microscope (left) and scanning white light interferometry (right) images of the bottom walls of the two channels. The optical images are
 $6.2\times 4.6~\text{mm}^{2}$
, and the interferometry images are
 $0.7\times 0.5~\text{mm}^{2}$
. The colour scale bar is the same for both images. (c) Double logarithmic plot of pressure drop
 ${\rm\Delta}p$
as a function of Reynolds number in the channels. The lines are fits to laminar (dashed) and Blasius (dotted) flow models with the transition around
 $\mathit{Re}\sim 2\times 10^{3}$
. Error bars are shown only when larger than symbols.

We emphasize that the two channels, while nearly identical in all macroscopic aspects (e.g. linear dimensions, inlet pipes), possess different sets of microscopic imperfections on their walls and test sections, as seen in figure 1(b). Here, we are not concerned with the particulars of these imperfections, which may include but are not limited to surface roughness, wall asperities, bumps, edges, and so on. As we show below, even though these imperfections may lead to different random flows, the lowest-order statistics remain qualitatively similar.
2.2. Pressure drop
The pressure drops
 ${\rm\Delta}p$
between the inlets and outlets of both channels are shown in figure 1(c) as a function of the Reynolds number. In the low-Reynolds-number range
 $0\leqslant \mathit{Re}\lesssim 10^{3}$
,
 ${\rm\Delta}p$
can be fitted to that in a Poiseuille flow using the nominal channel parameters with no free parameters. This is the dashed asymptote in figure 1(c). In the high-
 $\mathit{Re}$
regime, the data appear to converge to another asymptote (dotted line). This is the pressure drop calculated from the Colebrook equation in a rectangular duct (Jones Reference Jones1976), using only experimentally available parameters. The pressure drops in both channels match closely.
2.3. Spectral properties
We first turn to the spectral properties of near-wall fluctuations. Flow forces act on the microcantilever and give rise to mechanical fluctuations. The microcantilever has a sharply peaked resonance at 100 kHz with a linewidth of 500 Hz. Its linear response function is frequency-independent in the frequency range
 $f<80~\text{kHz}$
and can be approximated as
 $|G(f)|\approx 1/{\it\kappa}$
, with
 ${\it\kappa}$
being the cantilever spring constant and
 ${\it\kappa}\approx 3~\text{N}~\text{m}^{-1}$
. Thus, the linear relation,
 $S_{z}(f)\approx S_{F}(f)/{\it\kappa}^{2}$
, between the spectral densities of the force
 $S_{F}(f)$
and the cantilever displacement
 $S_{z}(f)$
remains valid below
 $f<80~\text{kHz}$
. At very low flow rates (
 $\mathit{Re}\lesssim 800$
),
 $S_{z}(f)$
becomes obscured by measurement noise because the flow cannot generate detectable cantilever motion.
The spectral densities of the cantilever fluctuations
 $S_{z}(f)$
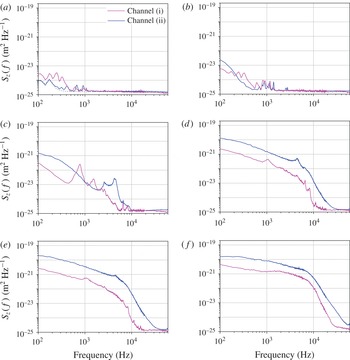
obtained for the two channels are shown at different Reynolds numbers in figure 2. For
 $\mathit{Re}\lesssim 1000$
(figure 2
a,b), the spectra for both cases are barely above the noise floor (dotted black line) and appear similar for the most part. For
 $\mathit{Re}\geqslant 1600$
(figure 2
c–f), small differences between the two cases can be noticed. First, the fluctuations in channel (ii) with the rougher wall are larger than those in channel (i) by an order of magnitude; second, the spectrum in channel (ii) extends to slightly higher frequencies. As the Reynolds number is increased, both data traces increase monotonically and smoothly. Interestingly,
 $S_{z}(f)\propto 1/f$
for both channels in the low-frequency range.
Power spectral density
 $S_{z}(f)$
of cantilever displacements for different Reynolds numbers for channels (i) and (ii): (a) 820, (b) 1030, (c) 1650, (d) 2100, (e) 2330, (f) 3000. The dotted line in (a) shows the noise floor of the measurement; the noise floor and the spectra are indistinguishable at
 $\mathit{Re}\approx 820$
for the frequency range
 $f\geqslant 300~\text{Hz}$
.

2.4. Statistical properties
Next, we turn to the statistical properties of the near-wall fluctuations. We collect long-time traces of the cantilever amplitudes filtered in the frequency range
 $100~\text{Hz}<f<30~\text{kHz}$
to remove the high-frequency resonant oscillations. We then sample the time data every
 $3~{\rm\mu}\text{s}$
, obtaining
 ${\sim}10^{6}$
data points. Because we are interested in single-point probability density functions (PDFs), we do not worry about oversampling in comparison to other relaxation times in the measurement, e.g. the ring-down time of the cantilever.
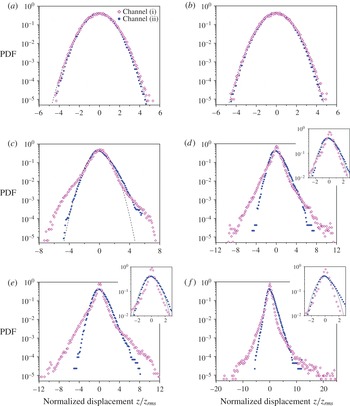
The PDFs for different Reynolds numbers are plotted in figure 3. For
 $\mathit{Re}\lesssim 1000$
, our measurements are dominated by technical noise, and the PDFs in both channels (i) and (ii) are perfectly Gaussian (figure 3
a,b). In the range
 $\mathit{Re}\geqslant 1600$
, both PDFs go through dramatic changes, as seen in figure 3(c–f). First, one notices a substantial broadening of the tails of the PDF in channel (i), indicating the presence of strong wall velocity/pressure bursts, which may reach the bulk (Yakhot, Bailey & Smits Reference Yakhot, Bailey and Smits2010). The PDFs observed in channel (ii) for
 $\mathit{Re}\geqslant 1600$
suggest that the flow here is somewhat more homogeneous (figure 3
c–f) compared with that in channel (i), but wall bursts make the PDFs more asymmetric and intermittent (figure 3
e). This trend continues with increasing Reynolds number (figure 3
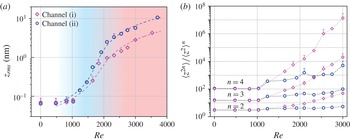
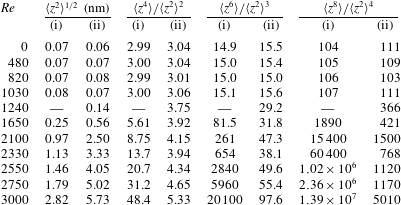
f). The dotted lines in the insets show that the PDFs in channel (i) cannot be fitted to Gaussians, even at very small displacements; an exponential decay seems perhaps more appropriate. The differences between the two flows can also be clearly seen in the moments of the PDFs listed in table 1. The moments are also plotted in figure 4, with
 $z_{rms}=\langle z^{2}\rangle ^{1/2}$
(brackets indicate averaging) in figure 4(a) and normalized high-order moments in figure 4(b). The high-order moments obtained in the two channels differ by orders of magnitude. These observations can be summarized as follows. The random flow in channel (i) is more intermittent compared with that in channel (ii); however, the intensity of the fluctuations in channel (ii) is larger. Based upon these observations, it may not be incorrect to conclude that these are two very different random flows. While the exact source of the differences in these two flows is impossible to identify, it must be due to the different sets of imperfections in the two channels.
Probability density functions at different Reynolds numbers for channels (i) and (ii): (a) 820, (b) 1030, (c) 1650, (d) 2100, (e) 2330, (f) 3000. The
 $x$
-axes are in units of
 $z_{rms}$
, which are different for each data set (see table 1). The dotted lines are Gaussians.

(a) Cantilever r.m.s. displacements,
 $z_{rms}$
, versus
 $\mathit{Re}$
for channels (i) and (ii). The dashed lines are fits to the results of the noisy Landau equation, (3.5), with parameters given in table 2. (b) Normalized high-order moments. The error bars are estimated from convergence tests performed by computing the moments for a subset of the data (e.g. half). When not shown, the error bars are smaller than the symbol size.

Moments.

We return to the r.m.s displacement of the cantilever,
 $z_{rms}=\langle z^{2}\rangle ^{1/2}$
, as a function of the Reynolds number, shown in figure 4(a). The dashed lines are fits to our proposed equation, discussed below. We note that the
 $z_{rms}$
values obtained by integrating the spectra and from the time domain measurements agree closely. There are three regions in the plot marked with different shadings. The first region,
 $Re\lesssim 800$
, is dominated by technical noise and does not provide any insight. In the second region (blue), where
 $1000\lesssim \mathit{Re}\lesssim 1600$
, the magnitudes of the cantilever fluctuations are of the same order for both channels (i) and (ii),
 $z_{rms}\sim 1~\text{nm}$
. In the third region (pink), the observed r.m.s. amplitude of near-wall fluctuations in the rough channel (ii) is larger than that of those in the smooth channel (i). The slope changes for both data traces around
 $\mathit{Re}\approx 2000$
, suggesting the onset of more sustained perturbations. The data traces appear to increase parallel to each other for
 $\mathit{Re}\gtrsim 2000$
.
3. Theory
The similarities in the two data traces in figure 4(a) suggest that there may be common underlying physics to both cases. In order to describe both flows by a single equation, we return to the Landau theory discussed above. We incorporate the non-idealities into the Landau theory by considering a general additive noise term
 ${\it\phi}(t)$
. We assume that a high-frequency random Gaussian force
 ${\it\phi}(t)$
defined by the correlation function
 $\overline{{\it\phi}(t){\it\phi}(t^{\prime })}=2\overline{{\it\phi}^{2}}{\it\delta}(t-t^{\prime })$
stirs the fluid. Then, (1.2a
) is modified as
 $$\begin{eqnarray}\frac{\partial \boldsymbol{v}}{\partial t}+\bar{\boldsymbol{u}}\boldsymbol{\cdot }\boldsymbol{{\rm\nabla}}\boldsymbol{v}+\boldsymbol{v}\boldsymbol{\cdot }\boldsymbol{{\rm\nabla}}\bar{\boldsymbol{u}}+\boldsymbol{v}\boldsymbol{\cdot }\boldsymbol{{\rm\nabla}}\boldsymbol{v}=-\frac{\boldsymbol{{\rm\nabla}}p_{1}}{{\it\rho}}+{\it\nu}{\rm\nabla}^{2}\boldsymbol{v}+{\it\phi}(t).\end{eqnarray}$$
Repeating Landau’s arguments leading to (1.3), we write
 $$\begin{eqnarray}\frac{\partial A}{\partial t}={\it\gamma}_{1}A-\frac{{\it\alpha}}{2}A^{3}+{\it\phi}(t).\end{eqnarray}$$
Averaging over high-frequency fluctuations gives a modified Landau equation for the slow mode
 $$\begin{eqnarray}\frac{\text{d}|A|^{2}}{\text{d}t}=2{\it\gamma}_{1}|A|^{2}-{\it\alpha}|A|^{4}+\overline{{\it\phi}^{2}}.\end{eqnarray}$$
In a force-driven flow with initial condition
 $A_{0}=0$
, the solution to (3.3) is
 $$\begin{eqnarray}|A(t)|^{2}=\frac{{\it\gamma}_{1}}{{\it\alpha}}+\frac{{\it\beta}_{-}-{\it\beta}_{+}\text{e}^{-(t/{\it\tau})}}{{\it\beta}_{-}+{\it\beta}_{+}\text{e}^{-(t/{\it\tau})}}\left({\it\beta}_{+}-\frac{{\it\gamma}_{1}}{{\it\alpha}}\right),\end{eqnarray}$$
where
 ${\it\beta}_{\pm }=\pm ({\it\gamma}_{1}/{\it\alpha})+\sqrt{({{\it\gamma}_{1}}^{2}/{\it\alpha}^{2})+(\overline{{\it\phi}^{2}}/{\it\alpha})}>0$
with
 ${\it\tau}=(1/(2\sqrt{{\it\gamma}_{1}^{2}+\overline{{\it\phi}^{2}}{\it\alpha}}))$
. This gives in the long-time limit
 $$\begin{eqnarray}|A(\infty )|^{2}={\it\beta}_{+}=\frac{{\it\gamma}_{1}}{{\it\alpha}}+\sqrt{\frac{{{\it\gamma}_{1}}^{2}}{{\it\alpha}^{2}}+\frac{\overline{{\it\phi}^{2}}}{{\it\alpha}}}.\end{eqnarray}$$
Remembering that in Landau theory
 ${\it\gamma}_{1}=c(\mathit{Re}-\mathit{Re}_{cr})$
, we notice an important consequence of noise: the relaxation time
 ${\it\tau}$
remains finite in the limit
 $\mathit{Re}\rightarrow \mathit{Re}_{cr}$
, in contrast to the ‘critical slowing down’ discussed above. Thus, the external noise source regularizes the dynamics around the transition point. In addition, (3.2) indicates that, when
 $A$
is small in the low-
 $\mathit{Re}$
limit so that the
 $\mathit{O}(A^{3})$
contributions can be neglected,
 $A$
obeys Gaussian statistics.
The obtained results can be used to quantitatively explain the experimental data of figure 4(a). The time-dependent force acting on the cantilever is
 $$\begin{eqnarray}\boldsymbol{F}=F\hat{\boldsymbol{z}}=-\int _{S}p_{1}\boldsymbol{\cdot }\boldsymbol{n}\,\text{d}S\approx \frac{\partial p_{1}}{\partial z}V\hat{\boldsymbol{z}},\end{eqnarray}$$
where
 $\hat{\boldsymbol{z}}$
is the unit vector and
 $V$
is the volume of the cantilever. We simplify the problem by approximating our channel as a long and wide rectangular (planar) duct, and, neglecting noise, write the perturbation equation in the
 $z$
direction from (3.1) as
 $$\begin{eqnarray}\frac{1}{{\it\rho}}\frac{\partial p_{1}}{\partial z}=-\frac{\partial v_{z}}{\partial t}-\frac{3}{2}U\left(1-\frac{4z^{2}}{H^{2}}\right)\frac{\partial v_{z}}{\partial x}+{\it\nu}{\rm\nabla}^{2}v_{z}+\mathit{O}\left(\frac{\partial v^{2}}{\partial z}\right).\end{eqnarray}$$
In close proximity to the wall,
 $z\approx H/2$
, and the second term on the right-hand side of (3.7) is small. Numerical simulations (Lee, Yeo & Choi Reference Lee, Yeo and Choi2004), where the statistics of acceleration in close proximity to a wall was studied, suggest that bursts are dominated by the
 $z$
-component of the velocity (
 $v^{2}=\mathit{O}({v_{z}}^{2})$
) and the viscous term is unimportant. Therefore,
 $$\begin{eqnarray}\frac{1}{{\it\rho}}\frac{\partial p_{1}}{\partial z}\approx -\frac{\partial v_{z}}{\partial t}+\mathit{O}\left(\frac{\partial {v_{z}}^{2}}{\partial z}\right).\end{eqnarray}$$
Here,
 $\partial _{t}v_{z}=\mathit{O}(v_{z}U/H)$
. To find an order of magnitude estimate for
 $\partial _{z}({v_{z}}^{2})$
, we extrapolate the results of Yakhot et al. (Reference Yakhot, Bailey and Smits2010), which shows that, for
 $\mathit{Re}<10^{5}$
, the velocity of wall bursts is
 $v_{z}=\mathit{O}(U/10)$
. This means that the magnitudes of the two terms on the right-hand side of (3.8) are comparable, and
 $\mathit{O}({v_{z}}^{2})$
must be accounted for. Thus, we deduce
 $\partial _{z}p_{1}=\mathit{O}({v_{z}}^{2}/H)$
and write
 $$\begin{eqnarray}z_{rms}\sim {\it\rho}V{v_{z}}^{2}/{\it\kappa}H\propto |A(\infty )|^{2}.\end{eqnarray}$$
This exercise provides the fits (dashed lines) shown in figure 4(a) with the parameters in table 2. The ultimate justification for the above arguments comes from the agreement between experiment and theory in figure 4(a). The following simple order of magnitude estimate further bolsters our confidence. Assuming
 ${v_{z}}^{2}/U^{2}\approx 0.008$
around
 $\mathit{Re}_{cr}$
(Yakhot et al.
Reference Yakhot, Bailey and Smits2010) and using the experimentally available parameters (
 $V\approx 2\times 10^{-14}~\text{m}^{3}$
,
 $H\approx 10^{-3}~\text{m}$
,
 ${\it\kappa}\approx 3~\text{N}~\text{m}^{-1}$
), we find
 $z_{rms}\approx 10^{-10}~\text{m}$
, close to the experimental values.
The fit parameters used (see (3.5)).

4. Summary and outlook
In transitional flows in imperfect channels, the high-order moments of the near-wall fluctuations appear to be extremely sensitive to the specifics of the imperfections in the channels. In the two nominally identical channels with different sets of imperfections presented here, the high-order moments of the near-wall fluctuations differ by orders of magnitude. On the other hand, the low-order moments remain relatively independent of the details of the imperfections. In our experiments, the
 $z_{rms}$
values seem to depend directly on the wall roughness. Additionally,
 $z_{rms}$
in these flows can be accurately described by the noisy Landau equation presented. The applicability of the noisy Landau equation to these different flows is probably due to the fact that the noise term is taken to be at high frequencies as compared with the slow mode in question. In other words, the stirring of the fluid occurs at high frequencies. This assumption is eminently reasonable because the microscopic surface asperities giving rise to roughness are at high spatial frequency compared with any length scales of the flow. Our preliminary results suggest that inlet disturbances may also be accounted for by the noisy Landau equation. Along the same lines, we believe that even thermal fluctuations in the fluid would probably result in a similar regularization of the Landau equation. Finally, the phenomena observed here may have important consequences for heat and mass transfer in wall-bounded flows; this will be discussed in detail in future work.
Acknowledgements
We acknowledge support from the US NSF through grant nos. CMMI-0970071 and DGE-1247312. We are grateful to T. Kouh for initial measurements, and K. R. Sreenivasan and J. Schumacher for valuable comments.