


Insulin resistance (IR) is a pathophysiological state characterized by diminished sensitivity of target tissues (e.g., liver, muscle, and adipose tissue) to insulin, necessitating compensatory hypersecretion of insulin to preserve glucose homeostasis (M. Li et al., Reference Li, Chan, Guan, Peng, Wu, Lu, Zhou, Hui, Lee, Satti, Tsang, Wu, Chen, Tse and Liu2022). IR serves as the common pathological cornerstone of a series of major chronic diseases such as type 2 diabetes and atherosclerotic cardiovascular disease (De Rosa et al., Reference De Rosa, Arcidiacono, Chiefari, Brunetti, Indolfi and Foti2018; Mone et al., Reference Mone, De Gennaro, Moriello, Frullone, D’Amelio, Ferrante, Marro and Santulli2023; Tian et al., Reference Tian, Yang, Li, Huang, Yang and Xue2025). Accurate assessment of IR is crucial for disease prevention and control, but the complexity and invasiveness of its gold standard, the high insulin-normoglycemic clamp, limit its large-scale application; even the widely used homeostatic model assessment for insulin resistance (HOMA-IR) test presents practical challenges in certain settings (Matsuda, Reference Matsuda2010).
In this context, the triglyceride-glucose (TyG) index, derived from fasting triglycerides (TG) and fasting plasma glucose (FPG), has become an important epidemiological and clinical surrogate marker of IR due to its easy calculation (Guerrero-Romero et al., Reference Guerrero-Romero, Simental-Mendía, González-Ortiz, Martínez-Abundis, Ramos-Zavala, Hernández-González, Jacques-Camarena and Rodríguez-Morán2010). Quantitative validation studies have demonstrated its strong correlation with the gold standard. For instance, Luo et al. (Reference Luo, Cao, Li, Li, Song, Fu, Zhou, Yi, Zhu and Zhu2022) reported the AUC of the TyG index (0.785, 0.691–0.879) was higher than that of HOMA-IR (0.730, 0.588–0.873) for predicting IR. Furthermore, a systematic review by Sanchez‑Garcia et al. (Reference Sánchez-García, Rodríguez-Gutiérrez, Mancillas-Adame, González-Nava, Díaz González-Colmenero, Solis, Álvarez-Villalobos and González-González2020) summarized the diagnostic performance of TyG index against HOMA‑IR and the clamp technique, reporting high sensitivity and specificity in certain populations, consistent with earlier validation (Vasques et al., Reference Vasques, Novaes, de Oliveira Mda, Souza, Yamanaka, Pareja, Tambascia, Saad and Geloneze2011). More importantly, prospective cohort studies have shown that elevated TyG index is significantly associated with the risk of various metabolic diseases, such as type 2 diabetes (Zou et al., Reference Zou, Yang, Shen, Wei, Gong, Pan, Lv and Xu2021), heart failure (X. Li et al., Reference Li, Chan, Guan, Peng, Wu, Lu, Zhou, Hui, Lee, Satti, Tsang, Wu, Chen, Tse and Liu2022), and stroke (Jiang et al., Reference Jiang, Shen, Chen, Cai, Zhao, Liang, Cai, Cheng and Zhang2024), showing its potential value as an early warning and predictive indicator of multiple diseases.
However, the TyG index varies greatly among individuals. Although the role of environmental factors (such as diet and exercise; He et al., Reference He, Li, Zhang, Guo, Zhang, Guo, Cheng, Guo and Zhang2025; Jia et al., Reference Jia, He, Liu, Li, Liang, Huang, Chen, Cao, Li, Shen, Yu, Liu, Hu, Huang, Zhao, Liu, Lu, Gu and Chen2024; Zhang et al., Reference Zhang, Yang, Zheng, Bai, Yang, Zhang, Zhao, Luo and Yu2025) has been widely recognized, the genetic basis of the TyG index as a complex quantitative trait remains largely unelucidated. To date, only a limited number of studies have investigated the genetic underpinnings of the TyG index. A growing number of studies have conducted genomewide association analyses using large-scale public databases (An et al., Reference An, Cao, Zheng, Liu, Yang, Chen, Zhao, Zhang and Xia2025; Jiang et al., Reference Jiang, Shen, Chen, Cai, Zhao, Liang, Cai, Cheng and Zhang2024), identifying numerous single nucleotide polymorphism (SNP) loci significantly associated with the TyG index and constructing polygenic risk scores (PRS) based on these loci. However, PRS scores reflect the cumulative effect of known significant SNPs and do not directly quantify the overall contribution of genetic factors to phenotypic variation. A prior investigation in the Chinese Taiwan population (Lin et al., Reference Lin, Yan, Chen, Yang, Kuo and Tsai2025) estimated TyG’s SNP-based heritability (
 $h_{SNP}^2$
) at 15.5%. However, SNP-based heritability captures only the additive effects of common SNPs and may therefore underestimate the true genetic contribution. Moreover, its estimation is contingent upon the coverage of SNP arrays and population-specific characteristics.
Based on this, the present study adopted structural equation modeling for the first time to estimate the heritability of the TyG index in a Qingdao twin population, aiming to decompose the proportion of genetic and environmental factors. The answer to this question is key to understanding its biological nature and assessing its value as a stable phenotype. The twin study design can accurately estimate the heritability of the TyG index and assess the contribution of genetic factors to phenotypic variation by comparing monozygotic (MZ) and dizygotic (DZ) twins with different genetic similarities.
Methods
Participants
The twin samples were obtained from the Qingdao Twin Registry, which enrolls Han Chinese twins born in the Qingdao area (Duan et al., Reference Duan, Ning, Zhang, Wang, Zhang, Tan, Tian and Pang2013). This system is designed to investigate the roles of genetic and environmental factors in the development of chronic noncommunicable diseases. Between 2012 and 2013, a total of 384 twin pairs, including one set of triplets, were recruited. The Medical Ethics Committee of Qingdao Center for Disease Control and Prevention approved the Qingdao twin study. All subjects provided written informed consent, and the study was conducted in accordance with the Declaration of Helsinki.
Inclusion criteria: Adult twins of Han nationality aged 18 years and above; both parties had complete questionnaires, phenotypic measurements, and laboratory test results; voluntarily signed informed consent; and both twins were followed up.
Exclusion criteria: Without triglyceride and plasma glucose measurement; without key information or unable to cooperate due to poor condition; if either twin was lost to follow-up; subjects were pregnant or lactating; and those who use lipid-regulating drugs and insulin. A total of 381 pairs of twins were included in the study.
Triglyceride-Glucose (TyG) Index Definition
The TyG index is a composite index combining serum triglyceride (TG) and fasting plasma glucose (FPG). FPG and TG concentrations of the participants were assessed using biological samples collected at baseline. The TyG index was computed as Ln (fasting TG [mg/dL] × FPG[mg/dL]/2).
Twin Zygosity
The twins’ gender, ABO blood group, and microsatellite DNA gene scanning and typing technology were used to determine the zygosity (Yang et al., Reference Yang, Tzeng, Tseng and Huang2006).
Statistical Analysis
Epidata 3.1 software was used to establish the database of twins. All data were double-entered independently by two researchers to ensure accuracy and reliability. SPSS 26.0 was used for data processing and descriptive analysis. Quantitative variables were described as median (Mdn) and interquartile range (IQR), while categorical variables were described as counts and percentages. For variables that clearly did not conform to the normal distribution, Blom transformation was performed.
To assess the statistical power of the current sample for estimating the heritability of the TyG index, power analysis was conducted using the umx package in R software, with the significance level set at α = .05.
Structural Equation Modeling
Structural equation modeling (SEM) was employed to examine the genetic and environmental contributions to phenotypic variation in twins, utilizing Mx software (Version 1.70a; Neale (Reference Neale2015). Grounded in the classical twin design, the total phenotypic variance was decomposed into four components: additive genetic (A), dominant genetic (D), common/shared environmental (C), and unique environmental (E) effects. Given that all twin pairs were reared together, the parameters C and D cannot be estimated concurrently within the same model due to parameter confounding (Rijsdijk & Sham, Reference Rijsdijk and Sham2002). Accordingly, model selection was guided by the intraclass correlation coefficients (ICC) for TyG observed in MZ and DZ twins; p < .05 was considered to indicate statistical significance. Specifically, the ADE model was fitted when r MZ>2r DZ; otherwise, the ACE model was applied. Following the selection of the full model, nested submodels (AE, CE, or DE) were generated through sequential parameter removal. The fit of these submodels was evaluated against the saturated model using likelihood ratio chi-square tests. A no-significant p value (>.05) indicated no significant deterioration in model fit, supporting the adoption of the more parsimonious model. The final model was selected based on the lowest Akaike information criterion (AIC) value, balancing explanatory power with model simplicity. The proportion of variance attributable to the additive genetic component (A) in the best-fitting model was interpreted as the heritability (h2) of the trait, with adjusting for the effect of age, gender and body mass index (BMI).
Sex-Limitation Model Analysis
Intraclass correlation coefficients were calculated for the TyG index in five twin subgroups — MZ males, MZ females, DZ males, DZ females, and DZ opposite-sex pairs — to examine potential sex differences in phenotypic variation. Subsequently, sex‑limitation structural equation models (Neale & Cardon, Reference Neale and Cardon1992) were fitted to the same five twin groups to formally test for sex differences in the genetic architecture of the TyG index. Models incorporated additive (A), dominant (D), and unique environmental (E) components, as well as a female‑specific additive genetic effect (F), with age and BMI included as adjusted variables. Nested models were compared using likelihood‑ratio tests, AIC, and BIC. Analyses were performed in Mx (version 1.70a).
Results
Study Sample and Participants’ Characteristics
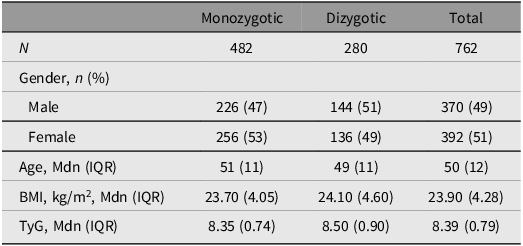
A total of 762 (381 pairs) adult twins were included in this study, of which 241 pairs (63.25%) were MZ. Sample characteristics are presented in Table 1.
Participants’ characteristics

Table 1. Long description
A table comparing characteristics of monozygotic and dizygotic twins. The table has 6 rows and 4 columns. Column headers are Monozygotic, Dizygotic, and Total. Row labels are N, Gender, Age, BMI, and TyG. Row 1: Monozygotic, 482; Dizygotic, 280; Total, 762. Row 2: Gender, n (percent). Row 3: Male, Monozygotic, 226 (47); Dizygotic, 144 (51); Total, 370 (49). Row 4: Female, Monozygotic, 256 (53); Dizygotic, 136 (49); Total, 392 (51). Row 5: Age, Median (IQR), Monozygotic, 51 (11); Dizygotic, 49 (11); Total, 50 (12). Row 6: BMI, kg/m^2, Median (IQR), Monozygotic, 23.70 (4.05); Dizygotic, 24.10 (4.60); Total, 23.90 (4.28). Row 7: TyG, Median (IQR), Monozygotic, 8.35 (0.74); Dizygotic, 8.50 (0.90); Total, 8.39 (0.79).
Note: Mdn, median; IQR, interquartile range; BMI, body mass index; TyG, triglyceride-glucose index.
The median age of all participants was 50 years with an IQR of 12 years, and 49% were male. The Mdn (IQRs) of BMI and TyG were 23.90 (4.28) kg/m2 and 8.39 (0.79) respectively. The distribution of Blom‑transformed TyG index by sex is shown in Figure 1.
Blom-transformed TyG index distribution by sex.

Both sexes showed approximately normal distributions with similar means, but males exhibited a wider spread (greater variance) compared to females.
Heritability Estimation
Table 2 presents the ICCs for TyG in MZ and DZ twins. The results showed that the correlation coefficient for MZ twins (r MZ = 0.597, 95% CI [0.509, 0.672]) was substantially higher than that for DZ twins (r DZ = 0.278, 95% CI [0.118, 0.425]). The non-overlapping confidence intervals further support a significant genetic contribution to TyG. Notably, since r MZ > 2r DZ, this pattern suggests the presence of nonadditive genetic effects. Consequently, the ADE model was selected as the full model for subsequent structural equation modeling, along with its nested submodels AE and DE.
The intraclass correlation coefficients in monozygotic (MZ) and dizygotic (DZ) twins

Table 2. Long description
A table with two rows and three columns. The columns are labeled Phenotype, rMZ (95% CI), and rDZ (95% CI). The row labels are TyG. The values in the table are as follows: Row 1: TyG, rMZ (95% CI) 0.597 (0.509, 0.672), rDZ (95% CI) 0.278 (0.118, 0.425). The table compares the intraclass correlation coefficients for TyG in monozygotic and dizygotic twins, showing higher correlation in monozygotic twins.
Note: TyG, triglyceride-glucose index.
As shown in Table 3, the results showed no statistically significant deterioration in fit when the dominant genetic component (D) was dropped from the full ADE model (Δχ 2 = 3.20, Δdf = 1, p = .074), indicating that the more parsimonious AE model was adequate.
Fitting results of ADE and nested AE and DE models

Table 3. Long description
A table comparing fitting results of ADE and nested AE and DE models. The table has 3 rows and 9 columns. Column headers are Model, A, D, E, 2LL, AIC, BIC, df, Δχ2, and p. Row 1: Model, ADE; A, 40.74 (20.30, 63.40); D, 19.24 (0, 37.47); E, 40.02 (33.04, 48.36); 2LL, 1934.23; AIC, 424.23; BIC, -1276.29; df, 755; Δχ2, ; p, . Row 2: Model, AE; A, 60.48 (52.46, 67.24); D, ; E, 39.52 (32.76, 47.54); 2LL, 1937.43; AIC, 425.43; BIC, -1277.66; df, 756; Δχ2, 3.20; p, 0.074. Row 3: Model, DE; A, ; D, 48.82 (40.76, 56.12); E, 51.18 (43.88, 59.24); 2LL, 1950.86; AIC, 438.86; BIC, -1270.95; df, 756; Δχ2, 16.64; p, 0.000.
Note: Models were adjusted by age, gender, and BMI. −2LL, −2 times log−likelihood of data; df, degrees of freedom; AIC, Akaike’s information criterion; BIC, Bayesian information criterion; A, additive genetic influence; D, dominance genetic effect; E, nonshared environment and measurement error.
Among the three models, the AE model yielded the lowest Bayesian information criterion (BIC = –1277.66), and its AIC (AIC = 425.43) was only marginally higher than that of the ADE model (AIC = 424.23). Given the principle of parsimony and the nonsignificant chi‑square difference test, the AE model was selected as the best‑fitting model. In the AE model, the proportion of total variance attributed to additive genetic factors (A) — that is, the heritability of TyG — was estimated to be 60.48%. Power analysis indicated that, with a sample size of 381 twin pairs, the study had 98% statistical power to detect a heritability of TyG at a significance level of α = .05.
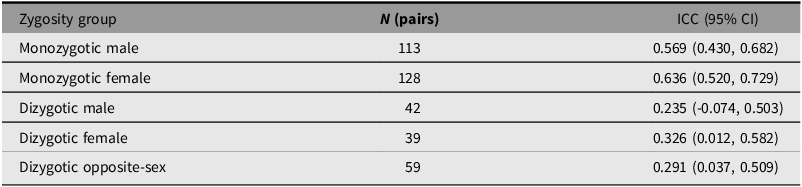
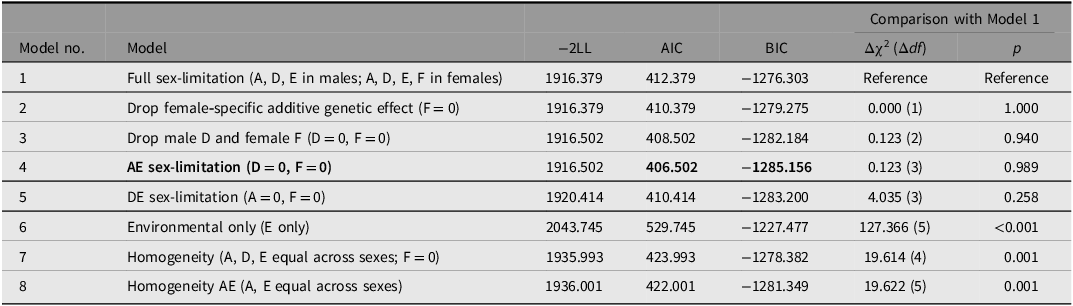
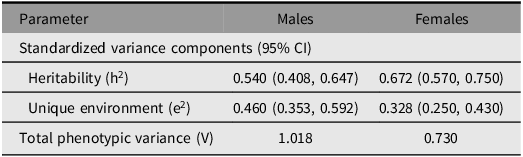
Intrapair correlations for TyG are presented for all five twin groups (Table 4). Further sex‑limitation modeling supports sex differences in the genetic structure of the TyG index. Model parameters, variances, and goodness‑of‑fit are presented in Table 5, and heritability estimates are shown in Table 6.
Intrapair correlations for TyG by zygosity and sex

Table 4. Long description
A table comparing intrapair correlations for TyG by zygosity and sex. The table has five rows and four columns. Column headers are Zygosity group, N (pairs), and ICC (95% CI). Row labels are Monozygotic male, Monozygotic female, Dizygotic male, Dizygotic female, and Dizygotic opposite-sex. Row 1: Monozygotic male, 113 pairs, ICC 0.569 (0.430, 0.682). Row 2: Monozygotic female, 128 pairs, ICC 0.636 (0.520, 0.729). Row 3: Dizygotic male, 42 pairs, ICC 0.235 (-0.074, 0.503). Row 4: Dizygotic female, 39 pairs, ICC 0.326 (0.012, 0.582). Row 5: Dizygotic opposite-sex, 59 pairs, ICC 0.291 (0.037, 0.509).
Note: ICC, intraclass correlation coefficients; TyG, triglyceride-glucose index.
Model-fitting results for sex-limitation models of TyG index

Table 5. Long description
A table comparing different models of sex-limitation for the TyG index, including their parameters, variances, and goodness-of-fit. The table has 8 rows and 7 columns. Column headers are Model no., Model, -2LL, AIC, BIC, Comparison with Model 1, and Δχ2 (Δdf) p. Row 1: Model no. 1, Model Full sex-limitation (A, D, E in males; A, D, E, F in females), -2LL 1916.379, AIC 412.379, BIC -1276.303, Comparison with Model 1 Reference, Δχ2 (Δdf) p Reference. Row 2: Model no. 2, Model Drop female-specific additive genetic effect (F = 0), -2LL 1916.379, AIC 410.379, BIC -1279.275, Comparison with Model 1 0.000 (1), Δχ2 (Δdf) p 1.000. Row 3: Model no. 3, Model Drop male D and female F (D = 0, F = 0), -2LL 1916.502, AIC 408.502, BIC -1282.184, Comparison with Model 1 0.123 (2), Δχ2 (Δdf) p 0.940. Row 4: Model no. 4, Model AE sex-limitation (D = 0, F = 0), -2LL 1916.502, AIC 406.502, BIC -1285.156, Comparison with Model 1 0.123 (3), Δχ2 (Δdf) p 0.989. Row 5: Model no. 5, Model DE sex-limitation (A = 0, F = 0), -2LL 1920.414, AIC 410.414, BIC -1283.200, Comparison with Model 1 4.035 (3), Δχ2 (Δdf) p 0.258. Row 6: Model no. 6, Model Environmental only (E only), -2LL 2043.745, AIC 529.745, BIC -1227.477, Comparison with Model 1 127.366 (5), Δχ2 (Δdf) p <0.001. Row 7: Model no. 7, Model Homogeneity (A, D, E equal across sexes; F = 0), -2LL 1935.993, AIC 423.993, BIC -1278.382, Comparison with Model 1 19.614 (4), Δχ2 (Δdf) p 0.001. Row 8: Model no. 8, Model Homogeneity AE (A, E equal across sexes), -2LL 1936.001, AIC 422.001, BIC -1281.349, Comparison with Model 1 19.622 (5), Δχ2 (Δdf) p 0.001.
Note: A, additive genetic effect; D, dominant genetic effect; E, unique environmental effect; F, female‑specific additive genetic effect. −2LL = −2 × log‑likelihood; df = degrees of freedom; AIC, Akaike’s information criterion; BIC, Bayesian information criterion. Likelihood‑ratio tests compare each nested model with Model 1. Bold indicates the best‑fitting model (lowest AIC and BIC, and nonsignificant difference from Model 1).
Heritability from the best-fitting AE sex-limitation model

Table 6. Long description
A table comparing heritability and environmental factors between males and females. The table has three columns: Parameter, Males, and Females. It includes three rows of data: Heritability (h2) with values 0.540 (0.408, 0.647) for males and 0.672 (0.570, 0.750) for females, Unique environment (e2) with values 0.460 (0.353, 0.592) for males and 0.328 (0.250, 0.430) for females, and Total phenotypic variance (V) with values 1.018 for males and 0.730 for females.
Note: 95% confidence intervals are given in parentheses. Heritability (h2) = A2/V; unique environment (e2) = E2/V.
As shown in Table 5, dominant genetic effects (D) and female‑specific additive genetic effects (F) were close to zero and not statistically significant in all models. After adjusting for age and BMI, the AE sex‑limitation model (Model 4) provided the best fit. The formal test for sex difference (homogeneity models constraining parameters equal across sexes) showed significantly worse fit (p < .01). More complex models (including D or F) did not differ significantly from Model 4 (p > .05). In Table 6, the total phenotypic variance was 1.018 in males and 0.730 in females. Heritability estimates from the best‑fitting model were 54.0% (95% CI [40.8, 64.7]) for males and 67.2% (95% CI [57.0, 75.0]) for females, with a point estimated male‑female difference of 13.2%. The contribution of unique environment varied by sex: higher in males (0.460, 95% CI [0.353, 0.592]) than in females (0.328, 95% CI [0.250, 0.430]).
Discussion
The present study quantified the heritability of the TyG index using a classical twin design in 381 twin pairs from Northern China. After adjusting for age, gender, and BMI, additive genetic effects explained 60.48% of the total variance under the AE model, indicating moderate-to-high heritability. And subsequent sex-limitation model analyses revealed that heritability was higher in females (67.2%) than in males (54.0%), while the proportion of nonshared environmental was higher in males than females.
Accumulating evidence from genetic association studies has suggested that variation in the TyG index may be partly influenced by genetic factors involved in metabolic regulation (Crocco et al., Reference Crocco, La Grotta, De Rango, Passarino, Dato and Rose2025; Teng et al., Reference Teng, Wu, Er, Hsu, Chou and Ko2018; Wei et al., Reference Wei, He, Zhang, Li, Zhong, Xiao, Shen, Lu, Shu, Quan and Huang2026). Several loci related to glucose and lipid metabolism, including GCKR and APOA5 (Lin et al., Reference Lin, Yan, Chen, Yang, Kuo and Tsai2025), have been reported to be potentially associated with TyG levels or with its individual components. These findings provide preliminary support for a genetic basis underlying inter-individual differences in TyG.
Nevertheless, existing studies have primarily focused on identifying specific genetic variants, while the overall magnitude of genetic influence on TyG at the population level has not been established. In particular, no study has evaluated the heritability of the TyG index in a northern Chinese twin population, which is essential for understanding its genetic architecture and potential utility in risk stratification. Motivated by this genetic background, the heritability of TyG was further quantified to be 60.48% in 381 twin pairs from northern China. This finding provides population-based quantitative evidence supporting the genetic regulation of TyG and extends prior locus-specific observations to the level of overall genetic contribution.
Previous studies have primarily focused on single biomarkers related to IR, establishing their associations with IR and underlying genetic contributions. As reported previously, the heritability of fasting glucose and fasting insulin in twin populations was estimated to be approximately 50% to 70% (Mayer et al., Reference Mayer, Newman, Austin, Zhang, Quesenberry, Edwards and Selby1996; Schousboe et al., Reference Schousboe, Visscher, Henriksen, Hopper, Sørensen and Kyvik2003; Wang et al., Reference Wang, Zhang, Liu, Xu, Duan, Tian and Zhang2020), whereas triglyceride heritability exhibited considerable variability across populations (0%-69%; Fenger et al., Reference Fenger, Benyamin, Schousboe, Sørensen and Kyvik2007; Gharipour et al., Reference Gharipour, Dianatkhah, Jahanfar, Rodrigues, Eftekhari, Mohammadifard, Sarrafzadegan, Oliveira and Silveira2024; Ji et al., Reference Ji, Ning, Duan, Kaprio, Zhang, Zhang, Wang, Qiao, Sun, Liang, Pang and Silventoinen2014; Lan et al., Reference Lan, Pang, Wang, Zhang, Duan, Zhang, Tan and Zhang2010). However, the pathophysiology of IR is fundamentally characterized by an imbalance between glucose and lipid metabolism (Roden & Shulman, Reference Roden and Shulman2019), and a single indicator often fails to comprehensively reflect this complex state. Accordingly, composite IR indices, including the quantitative insulin sensitivity check index (QUICKI) and HOMA-IR, have demonstrated heritability estimates of approximately 55% to 65% (Huang et al., Reference Huang, Beaty, Li, Liu, Zhao and Wang2017; Williams, Reference Williams2022). Our estimated heritability for the TyG index (60.48%) is comparable to these composite measures, supporting that TyG may integrate genetic signals from both glycemic and lipid pathways, thereby capturing their shared genetic architecture. Notably, a prior SNP-based study in a Chinese Taiwanese population reported a substantially lower TyG heritability (∼15.5%; Lin et al., Reference Lin, Yan, Chen, Yang, Kuo and Tsai2025). This may be attributable to the fact that SNP methods can only capture common variations and cannot reflect rare variations and nonadditive genetic effects, resulting in an underestimated heritability; moreover, population factors (such as geographical origin, age distribution, diet, and lifestyle) may also have certain impacts on the estimation of heritability.
Our finding of sex-specific heritability adds a novel dimension to the literature, suggesting that heritability estimates differ by sex. Notably, model comparisons suggest that larger nonshared environmental variance in males contributes to this sex difference. This is consistent with prior evidence of sexual dimorphism in IR-related traits (Faerch et al., Reference Faerch, Borch-Johnsen, Vaag, Jorgensen and Witte2010; Horikoshi & Mӓgi, Reference Horikoshi and Mӓgi2015). For instance, Lagou et al. (Reference Lagou, Magi and Hottenga2021) reported sex-differential genetic effects of fasting insulin at IRS1 and ZNF12 loci (with higher ZNF12 expression in females) and stronger genetic correlations with waist-to-hip ratio and anorexia nervosa in females, collectively providing a robust basis for our findings. But given the relatively small sample sizes in the DZ male group (n = 42) and DZ female group (n = 39), future studies with larger samples are needed to explore potential sex differences in the TyG gene structure.
This study has several notable strengths. First, the use of twin design effectively decomposed trait variation into genetic, shared environmental, and unique environmental contributions. Second, all participants were from the same regional twin registry, which helped reduce variability due to regional or cultural heterogeneity. Third, the statistical power for the genetic effects (A path) in the AE model is 0.98 (α = 0.05), indicating that the current sample size is adequate for ensuring accurate and reliable results.
Nevertheless, several limitations should be considered. The heritability estimate was derived from a specific regional population, which may limit its generalizability to other ethnic or sociocultural groups. In addition, our analysis relied on the equal environment assumption and random mating, deviations from these assumptions may have introduced bias into the heritability estimates.
Conclusion
In summary, this twin study demonstrates that the TyG index shows moderate-to-high heritability in a Northern Chinese population, indicating that genetic factors play an important role in the metabolic characteristics associated with IR. It is worth noting that the heritability of the TyG index in females was significantly higher than that in males. However, our model comparisons further revealed that nonshared environmental variance was larger in males, contributing to this heritability difference. In the future, integrating GWAS findings with multi-omics approaches may advance understanding of TyG-related metabolic pathways and ultimately facilitate precision prevention strategies for insulin resistance in diverse populations.
Data availability statement
The raw/processed data required to reproduce these findings cannot be shared at this time as the data also forms part of an ongoing study.
Acknowledgments
This study utilized data from the Qingdao Twin Registry (QTR). We would like to thank twins who participated in this study. And we acknowledge the staff at the Qingdao Center for Disease Control and Prevention (Qingdao CDC).
Author contributions
JF, XH, and DZ conceived and designed the study. XT prepared the data. XH and JF analyzed the data. XH drafted the manuscript. WK, WW, YP, RT, YZ, and KZ helped to organize the information and review the data. JF and XH helped with the interpretation of the results. JF contributed to the critical revision of the manuscript for important intellectual content and approved the final version of the manuscript. All authors reviewed and approved the final manuscript. JF and DZ are the guarantors.
Funding
This work was supported by Natural Science Foundation of Shandong Province (ZR2023QH188), National Natural Science Foundation of China (82304226), China Postdoctoral Science Foundation (2023M731839), Mount Taishan Scholar Youth Program (No. tsqn202306179), Qingdao Postdoctoral Innovation Project (QDBSH20230102012), Qingdao University Scientific Research Startup Fund (DC2200002531). The funders had no role in the study design, data collection, data analysis and interpretation, writing of the report, or the decision to submit the article for publication.
Conflict of interest
None.
Ethical statement
All participants provided written informed consent for participating in the study which was approved by the local ethics committee at Qingdao CDC, Qingdao, China.