



1. Introduction
The area of option pricing has achieved great development ever since Black and Scholes [Reference Black and Scholes3] innovatively proposed to use a geometric Brownian motion [Reference Uhlenbeck and Ornstein46] for the modelling of the underlying price, so that European options could be evaluated efficiently with a closed-form solution. Although this well-known model is still widely used in today’s finance practice, mainly due to its analytical simplicity and tractability, it actually suffers from mis-pricing problems caused by some simplified assumptions. For example, the phenomenon of “volatility smile” [Reference Dumas, Fleming and Whaley12] observed in real markets is at odds with the assumption made under the Black–Scholes (B-S) model that the volatility is constant, and volatility should be assumed to randomly change [Reference Ma and Tanizaki38]. Thus, stochastic volatility has already been incorporated into the B-S model in pricing options [Reference He and Lin19, Reference He and Lin21, Reference Heston24, Reference Stein and Stein44].
Another strong assumption under the B-S model, that is, the constant interest rate, is also not appropriate, since interest rates normally display a term structure [Reference Feng and Qian16] and option pricing models employing stochastic interest rate are shown to perform better [Reference Abudy and Izhakian1, Reference Rindell42]. In particular, Merton [Reference Merton39] is believed to be the first one to make the interest rate another stochastic source, assuming the interest rate is governed by the Gauss–Wiener process, and European options can still be analytically determined by the Merton model. Later on, Vasicek [Reference Vasicek47] proposed to use an Ornstein–Uhlenbeck (OU) process for the stochastic interest rate. A similar model with a time-dependent long-run interest rate was used by Hull and White [Reference Hull and White26] when pricing interest rate derivatives (the so-called Hull–White model), and the analytical solution to European option price under this particular model was presented by Rabinovitch [Reference Rabinovitch41]. Other stochastic interest rate models include the Cox–Ingersoll–Ross (CIR) model [Reference Cox, Ingersoll and Ross11, Reference Kim and Kunitomo32] and the Heath–Jarrow–Morton (HJM) model [Reference Heath, Jarrow and Morton23] among many others, and all of these models are also known as single-factor term structure models.
However, note that there will be a perfect correlation among the instantaneous bond returns across all maturities when single-factor models are adopted, which is not consistent with market observations, prompting to establish multi-factor stochastic interest rate models. For example, the term structure of the interest rate was captured by a two-factor general equilibrium model as shown by Longstaff and Schwartz [Reference Longstaff and Schwartz37], while Hull and White [Reference Hull and White27] proposed to make the long-term mean of the Hull–White interest rate be stochastic, forming a two-factor Hull–White model. Moreover, Chen [Reference Chen7] introduced a three-factor model with both the volatility and long-run level of the the CIR rate assumed to follow different CIR processes. Recently, stochastic interest rate models have also been combined with various factors, typical examples of which are the combination of stochastic interest rate and regime switching [Reference Elliott and Siu13–Reference Fan, Shen, Siu and Wang15], the combination of stochastic interest rate and stochastic volatility [Reference Grzelak and Oosterlee17, Reference He and Lin20, Reference Liang and Xu34], and the combination of stochastic interest rate and transaction costs [Reference Cao, Roslan and Zhang5, Reference Cao, Wang and Zhang6].
In this article, we assume that the long-term mean of the Vasicek model (single-factor) follows another OU process to formulate a new stochastic interest rate model. To demonstrate the advantages of the new model, it is used to formulate a new option pricing model through the combination with the B-S model. Fortunately, the analytical tractability associated with pricing European options is maintained, with a closed-form representation being presented after successfully deriving the characteristic function using numéraire change. We numerically implement the new formula so that its correctness can first be verified, and the influence of introducing the stochastic long-run interest rate level is also shown. To further justify the introduction of the stochastic long-term mean, we have also empirically compared the performance of the BSV model, which is the combination of the Black–Scholes and Vasicek model with S&P 500 index options. We also demonstrate the necessity to include the mean-reversion property for the long-term mean of the Vasicek model, by constructing another two-factor Vasicek model in the empirical comparison, which uses a normal distribution to describe the stochastic long-term mean.
We organize the remaining part of this article as follows. In Section 2, our newly proposed stochastic interest rate model is introduced first, with which we perform a measure transformation so that a closed-form formula used for European option pricing is obtained. We show the numerical implementation of the formula and the corresponding empirical analysis in Sections 3 and 4, respectively. The last section concludes the paper.
2. European option pricing
First, we propose a new stochastic interest rate model with stochastic long-term mean in this section, and then the pricing of European options is discussed under measure transform, after deriving T-maturity (maturity time T) zero coupon bond prices. The presented option pricing formula involves the unknown characteristic function defined as the Fourier transform of the underlying density, which is finally analytically derived after finding out the T-forward measure (the forward time is T) and the relevant model dynamics.
2.1. A new stochastic interest rate model
We now introduce the newly proposed stochastic interest rate model dynamics, which is formulated by making the long-run interest rate level of the Vasicek model another random variable following another OU process. Before that, the Vasicek interest rate model will be presented first, since our model can be viewed as one of its modified versions, and its risk-neutral dynamics under measure Q are given by
 $$ \begin{align*} \frac{dS_t}{S_t}&=r_t\,dt+\sigma \,dW_{t}^{S}, \\ dr_t&=\alpha(\beta-r_t)\,dt+\eta \,dW_{t}^{r}, \end{align*} $$
where
 $S_t$
and
 $r_t$
are used to denote the underlying price and interest rate, respectively;
 $\sigma $
and
 $\eta $
are the constant volatility of the underlying and that of the interest rate, respectively; while
 $\alpha $
and
 $\beta $
are the so-called speed of mean-reversion and long-run interest rate level, respectively. Note that
 $W_{t}^{S}$
and
 $W_{t}^{r}$
, being two Wiener processes [Reference Wilmott48], are correlated with each other such that
 $dW_{t}^{S}dW_{t}^{r}=\rho \, dt$
with
 $\rho $
being the correlation coefficient. As mentioned earlier, we propose to incorporate a stochastic long-run interest level into the Vasicek model so that
 $\beta $
becomes
 $\beta _t$
instead of being a constant, and the dynamics of the new model are
 $$ \begin{align*} \frac{dS_t}{S_t}&=r_t\,dt+\sigma \,dW_{t}^{S}, \\ dr_t&=\alpha(\beta_t-r_t)\,dt+\eta \,dW_{t}^{r},\\ d\beta_t&=k(\theta-\beta_t)\,dt+\lambda \,dW_{t}^{\beta}. \end{align*} $$
Clearly, the long-run interest level is modelled by an OU process, with its mean-reversion speed, long-run level and volatility being respectively represented by k,
 $\theta $
and
 $\lambda $
. We assume that the Wiener process
 $W_{t}^{\beta }$
does not depend on the other two. To facilitate the computation in the next subsection, the model dynamics that we have just established can be reformulated in a more systematic way as
 $$ \begin{align} \displaystyle \left[ {\begin{array}{*{20}c} \displaystyle \frac{dS_t}{S_t} \\[.2cm] \displaystyle dr_t \\ \displaystyle d\beta_t\\ \end{array}} \right] = \mu^{Q}\, dt+\Sigma\times C\times\left[ {\begin{array}{*{20}c} dW_{1,t} \\ dW_{2,t} \\ dW_{3,t}\\ \end{array}} \right]. \end{align} $$
Here, we introduce three independent Wiener processes,
 $W_{1,t}$
,
 $W_{2,t}$
and
 $W_{3,t}$
. Here,
 $\mu ^{Q}$
and
 $\Sigma $
have the form
 $$ \begin{align*} \displaystyle \mu^{Q}=\left[ {\begin{array}{*{20}c} r_t \\ \alpha(\beta-r_t) \\ k(\theta-\beta_t)\\ \end{array}} \right], ~~\Sigma=\left[ {\begin{array}{*{20}c} \sigma & 0 & 0 \\ 0 & \eta & 0 \\ 0 & 0 & \lambda\\ \end{array}} \right], \nonumber \end{align*} $$
and C can be expressed as
 $$ \begin{align*} \displaystyle C=\left[ {\begin{array}{*{20}c} 1 & 0 & 0 \\ \rho & \sqrt{1-\rho^2} & 0 \\ 0 & 0 & 1\\ \end{array}} \right] , \end{align*} $$
with which the correlation matrix can be calculated as
 $$ \begin{align*}\displaystyle CC^T=\left[ {\begin{array}{*{20}c} 1 & \rho & 0 \\ \rho & 1 & 0 \\ 0 & 0 & 1\\ \end{array}} \right]. \end{align*} $$
After establishing the new stochastic interest rate model, we are going to show how European options can be analytically evaluated under this particular model, the details of which are presented below.
2.2. A closed-form solution
We begin by expressing
 $U(S,r,\beta ,t)$
, the European option price, by taking the expected value of the option return discounted to the current time
 $$ \begin{align} U(S,r,\beta,t)=E^{Q}[e^{-\int_{t}^{T}r(s)\,ds}\max(S_T-K,0)|S_t], \end{align} $$
where K denotes the delivery price of the option. The pricing formula presented in (2.2) can be alternatively expressed as
 $$ \begin{align} U(S,r,\beta,t)=P(r,\beta,t,T)E^{Q^{T}}[\max(S_T-K,0)|S_t], \end{align} $$
if the T-forward measure,
 $\mathbb {Q}^T$
, is introduced [Reference Brigo and Mercurio4], with
 $P(r,\beta ,t,T)$
being the value of the bond expiring at time T paying no coupons under the risk-neutral measure. Clearly, in this case, apart from the expectation involved in (2.3),
 $P(r,\beta ,t,T)$
is also an unknown function that needs to be determined before the option pricing formula can be finally obtained, and its expression is presented in the following theorem.
Theorem 2.1. With the stochastic interest rate following the two-factor model as specified in (2.1), we can compute the value of the bond expiring at time T paying no coupons through
 $$ \begin{align} \displaystyle P(r,\beta,t,T)=e^{C(\tau)+D(\tau)r_t+E(\tau)\beta_t}, \end{align} $$
where
 $$ \begin{align*} \displaystyle C(\tau)&=p_1(\tau)+p_2(\tau)+p_3(\tau)+p_4(\tau)+p_5(\tau)+p_6(\tau),\\ D(\tau)&=-\frac{1}{\alpha}(1-e^{-\alpha\tau}),\\ E(\tau)&=-\frac{\alpha}{k(k-\alpha)}e^{-k\tau}+\frac{1}{k-\alpha}e^{-\alpha\tau}-\frac{1}{k},\\ p_1(\tau)&=\frac{1}{4\alpha}\bigg[\frac{\eta^2}{\alpha^2}+\frac{\lambda^2}{(k-\alpha)^2}\bigg](1-e^{-2\alpha\tau}),\quad p_2(\tau)=\frac{\alpha^2\lambda^2}{4k^3(k-\alpha)^2}(1-e^{-2k\tau}),\\ p_3(\tau)&=-\frac{\alpha\lambda^2}{k(k-\alpha)^2(k+\alpha)}[1-e^{-(k+\alpha)\tau}], \\ p_4(\tau)&=\frac{1}{\alpha}\bigg[-\frac{\eta^2}{\alpha^2}-\frac{\lambda^2}{k(k-\alpha)}+\frac{k\theta}{k-\alpha}\bigg](1-e^{-\alpha\tau}),\\ p_5(\tau)&=\frac{1}{k}\bigg[\frac{\alpha\lambda^2}{k^2(k-\alpha)}-\frac{\alpha\theta}{k-\alpha}\bigg](1-e^{-k\tau}),\quad p_6(\tau)=\bigg(\frac{\eta^2}{2\alpha^2}+\frac{\lambda^2}{2k^2}-\theta\bigg)\tau, \end{align*} $$
with
 $\tau =T-t$
.
Proof of Theorem 2.1 is provided in Appendix A.
With
 $P(r,\beta ,t,T)$
being successfully worked out, the task left is to evaluate the expectation in (2.3). Note that the target expectation is considered under
 $\mathbb {Q}^T$
, the T-forward measure, and thus the model under this particular measure needs to be figured out first, by making use of the dynamics (2.1) under the measure
 $\mathbb {Q}$
. To conduct measure transformation, it is necessary to find out the numéraires under the two measures. On one hand,
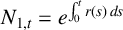 $N_{1,t}=e^{\int _{0}^{t}r(s)\,ds}$
is actually the numéraire used under
 $\mathbb {Q}$
, yielding
 $$\begin{align*}\displaystyle \displaystyle dN_{1,t}=N_{1,t}r(t)\,dt,\end{align*}$$
from which one can easily deduce that
 $\sigma ^{N_{1,t}}=(0,0,0)^T$
is the volatility of
 $N_{1,t}$
. On the other hand, the numéraire under
 $\mathbb {Q}^T$
is
 $\displaystyle N_{2,t}=P(r,\beta ,t,T)$
, which further gives
 $$ \begin{align*} dN_{2,t}&=N_{2,t}\bigg[\bigg\{\frac{dC}{dt}+ \frac{dD}{dt}r+\frac{dE}{dt}\beta+\alpha(\beta-r)D+k(\theta-\beta)E+\frac{1}{2}\eta^2D^2+\frac{1}{2}\lambda^2E^2\bigg\}\,dt \\ &\quad +\eta D\,dW_t^r+\lambda E\,dW_t^{\beta}\bigg]. \end{align*} $$
As a result, the volatility term of
 $N_{2,t}$
is
 $\sigma ^{N_{2,t}}=(0,\eta D,\lambda E)^T$
. Applying the techniques illustrated in [Reference Brigo and Mercurio4] would certainly lead to the drift term under
 $\mathbb {Q}^T$
being expressed as
 $$ \begin{align*} \mu^{Q^T}&=\mu^{Q}-\Sigma\times CC^T\times\bigg(\frac{\sigma^{N_{1,t}}}{N_{1,t}}-\frac{\sigma^{N_{2,t}}}{N_{2,t}}\bigg) \\ &=\left[ {\begin{array}{*{20}c} r_t \\ \alpha(\beta-r_t)\\ k(\theta-\beta_t) \\ \end{array}} \right]-\left[ {\begin{array}{*{20}c} \sigma & 0 & 0 \\ 0 & \eta & 0 \\ 0 & 0 & \lambda\\ \end{array}} \right]\times\left[ {\begin{array}{*{20}c} 1 & \rho & 0 \\ \rho & 1 & 0 \\ 0 & 0 & 1\\ \end{array}} \right]\times\left[ {\begin{array}{*{20}c} 0 \\ -\eta D(\tau) \\ -\lambda E(\tau)\\ \end{array}} \right] \\ &=\left[ {\begin{array}{*{20}c} r_t-\rho\sigma\eta D(\tau) \\ \alpha(\beta-r_t)+\eta^2D(\tau)\\ k(\theta-\beta_t)+\lambda^2E(\tau)\\ \end{array}} \right]. \end{align*} $$
In this case, we are able to express our model dynamics under
 $\mathbb {Q}^T$
through
 $$ \begin{align} \displaystyle \left[ {\begin{array}{*{20}c} \displaystyle \frac{dS_t}{S_t} \\ \displaystyle dv_t \\ \displaystyle dr_t\\ \end{array}} \right] =\left[ {\begin{array}{*{20}c} r_t-\rho\sigma\eta D(\tau) \\ \alpha(\beta-r_t)+\eta^2D(\tau) \\ k(\theta-\beta_t)+\lambda^2E(\tau)\\ \end{array}} \right]dt +\Sigma\times C\times\left[ {\begin{array}{*{20}c} dW_{1,t}^{Q^T} \\[.2cm] dW_{2,t}^{Q^T} \\[.2cm] dW_{3,t}^{Q^T} \\ \end{array}} \right]. \end{align} $$
With the model dynamics being presented in (2.5), the option pricing formula (2.3) can be rearranged as
 $$ \begin{align} \displaystyle U(y,r,\beta,t)=P(r,\beta,t,T)[P_1-KP_2]. \end{align} $$
Here,
 $$ \begin{align*}P_1=\int_{\ln K}^{+\infty}e^{y_T}p(y_T)\,dy_T \quad \text{and}\quad P_2=\int_{\ln K}^{+\infty}p(y_T)\, dy_T\end{align*} $$
with
 $\displaystyle y_t=\ln (S_t)$
and
 $p(y_T)$
denoting the
 $y_T$
density when the current time is t. By denoting the characteristic function as
 $f(\phi ;t,T,y,r,\beta )$
, we find that
 $$ \begin{align*}\displaystyle \frac{e^{y_T}p(y_T)}{f(-j;t,T,y,r,\beta)} \quad\text{with } j=\sqrt{-1}\end{align*} $$
is also a density function, which results in the identity
 $$\begin{align*}\displaystyle \int_{-\infty}^{+\infty}e^{y_T}p(y_T)\,dy_T=f(-j;t,T,y,r,\beta).\end{align*}$$
Therefore, we can directly formulate
 $P_1$
using the connection between the characteristic function and the density through
 $$ \begin{align} \displaystyle P_1=f(-j;t,T,y,r,\beta)\bigg\{\frac{1}{2}+\frac{1}{\pi}\int_{0}^{+\infty} \text{Real}\bigg[\frac{e^{-j\phi\ln K}f(\phi-j;t,T,y,r,\beta)}{j\phi f(-j;t,T,y,r,\beta)}\bigg]\,d\phi\bigg\}. \end{align} $$
Similarly,
 $$ \begin{align} \displaystyle P_2=\frac{1}{2}+\frac{1}{\pi}\int_{0}^{+\infty}\text{Real}\bigg[\frac{e^{-j\phi\ln K}f(\phi;t,T,y,r,\beta)}{j\phi}\bigg]\,d\phi. \end{align} $$
Obviously, European call prices under the newly proposed model can be calculated through the derived equations (2.6)–(2.8), whose solution is provided below.
Theorem 2.2. With (2.5) providing the dynamics of the underlying price process, we can compute the objective characteristic function with
 $$ \begin{align} \displaystyle f=e^{\bar{C}(\phi;\tau)+\bar{D}(\phi;\tau)r_t+\bar{E}(\phi;\tau)\beta_t+j\phi y_t}, \end{align} $$
where
 $$ \begin{align*} \displaystyle \bar{D}&=-j\phi D(\tau),\\ \bar{E}&=-j\phi E(\tau),\\ \bar{C}&=-(\phi^2+2j\phi) [p_1(\tau)+p_2(\tau)+p_3(\tau)]+p_7(\tau)+p_8(\tau)+p_9(\tau),\\ p_7(\tau)&=\frac{1}{\alpha}\bigg[(\phi^2+2j\phi)\bigg\{\frac{\eta^2}{\alpha^2}+\frac{\lambda^2}{k(k-\alpha)}\bigg\}+\frac{(\phi^2+j\phi) \rho\sigma\eta}{\alpha}-\frac{k\theta j\phi}{k-\alpha}\bigg](1-e^{-\alpha\tau}),\\ p_8(\tau)&=\frac{1}{k}\bigg[-(\phi^2+2j\phi)\frac{\alpha\lambda^2}{k^2(k-\alpha)}+\frac{\alpha\theta j\phi}{k-\alpha}\bigg](1-e^{-k\tau}),\\ p_9(\tau)&=\bigg[-(\phi^2+2j\phi)\bigg(\frac{\eta^2}{2\alpha^2}+\frac{\lambda^2}{2k^2}\bigg)-\frac{(\phi^2+j\phi)\rho\sigma\eta}{\alpha}+\theta j\phi-\frac{1}{2}\sigma^2(\phi^2+j\phi)\bigg]\tau. \end{align*} $$
We prove Theorem 2.2 in Appendix B.
Till now, one can easily find that European options under the newly constructed stochastic interest rate model can be evaluated with the presented closed-form exact solution. Before the new formula is applied in practice, it is necessary to address two important issues in advance: the first is whether the formula is correct, and the second is how the newly introduced stochastic long-run interest level influences option prices. These results are illustrated in the next section.
Our price versus Monte Carlo price.

3. Numerical implementation
In this section, we implement our formula numerically so that its validity can be shown by making sure that there was no algebraic errors during its derivation process. Then, option price properties under the newly proposed model will be investigated. We list the parameter values used to generate different plots of this section here. The mean-reverting speed of the interest rate
 $\alpha $
and that of the long-run interest level k take the values of 10 and 5, respectively, while we choose 0.2 for the long-term mean of the long-run interest level
 $\theta $
. The volatility of the interest
 $\eta $
and that of the long-run interest level
 $\lambda $
are allocated as 0.1 and 0.2, respectively. The initial levels of both the interest rate and the long-term mean,
 $r_0$
and
 $\beta _0$
, equal to 0.1, and
 $-$
0.5 is selected as the value of the correlation parameter
 $\rho $
. The default for the time to maturity
 $\tau $
is 1, and the volatility of the underlying price
 $\sigma $
is 0.15. Both the current underlying price
 $S_t$
and the strike K take the value 100.
We numerically compare option prices calculated using our formula and Monte Carlo simulation in Figure 1. It is clear from Figure 1(a) that our price agrees very well with the Monte Carlo result [Reference Lin and He35] across all moneyness point-wise, and such a kind of closeness can be further demonstrated through Figure 1(b), where their relative difference is plotted. One can of course reach the conclusion that our new formula is accurate, with the relative difference being no greater than 0.45%, and the formula is safe to be implemented in practice.
With the accuracy of the formula being ensured, the next step naturally is the investigation of its relationship with other models. Depicted in Figure 2 is the comparison of option prices under the B-S model, BSV model and our modelFootnote 1. One can easily observe that option prices of our model increase monotonically with the initial value of the long-run interest level, which can be understood from the fact that a larger initial value of the long-run interest level tends to result in a larger interest rate. One may also be interested in the phenomenon that the B-S price is higher than the BSV price when the interest rate and the long-run interest level are equal to each other, the main reason for which could be the possibility of the decrease in the stochastic interest rate of the Vasicek model.
Comparison of our model with both the BSV model and the B-S model.

Influence of different parameters on option prices.

In particular, Figure 3(a) displays how option prices are affected by the changing values of the mean-reversion speed k associated with the stochastic long-run interest level, and our price monotonically increases (decreases) with the mean-reversion speed when the initial value of the stochastic long-run interest level is smaller (greater) than its long-run mean
 $\theta $
. This is because with a larger k, the long-run mean would experience a higher speed to reach its long-run mean, leading to a higher (lower) interest rate. Note that when the long-run mean of the stochastic long-run interest level equals its initial value, our price turns out to show an opposite trend of k, a possible explanation for which is that expectation of the stochastic long-run mean is decreasing with respect to k. However, it is clear from Figure 3(b) that option prices increase when we enlarge the volatility of the stochastic long-run interest level
 $\lambda $
, irrespective of the value of
 $\theta $
. This is financially reasonable, since the enlargement of the volatility of the long-run interest level would make the interest rate more volatile, leading to a higher premium of the option contract.
From the results presented in this section, one can easily find that with the corresponding parameters under our model and the BSV model chosen to be the same, the newly introduced stochastic long-run interest level significantly impacts option prices, which demonstrates the rational of proposing this new model. Of course, what we did here is different from market practice, where model parameters need to be extracted with real data and the estimated values of the corresponding parameters in two models will probably be different. Therefore, a natural question arises, whether the newly proposed model can perform better than the BSV model in real markets, and this issue is discussed below.
4. Empirical studies
In this section, empirical studies are conducted, with the BSV model being taken as a benchmark, to justify the introduction of the stochastic long-term mean. In particular, the used market data will first be described, after which the method adopted for the estimation of model parameters will be illustrated, and the results will then be presented. Finally, the performance of the two models will be assessed through option prices computed from the determined parameters.
4.1. Data description
S&P 500 index options within the period of January–June 2018 are selected for carrying out empirical analysis. For parameter estimation purposes, it is necessary to first figure out what is the price of an option, which is actually selected as the mean of ask and bid prices, by conversion. The U.S. Treasury Bill Rate of three months that is announced every day is selected as the value of the current interest rate [Reference Shu and Zhang43]. Moreover, before the parameters are estimated, we need to apply several filters on the raw data so that market data noise can be eliminated [Reference Bakshi, Cao and Chen2].
First, only one-day data of a week are used for parameter estimation, because calibrating option pricing models can be time costly and this would enable a longer period to be studied. In particular, we choose Wednesday options data since among the five working days of each week, there is a least probability that Wednesday is a holiday and the day-of-the-week effect can be possibly eliminated. Thursday options data are also adopted, but for the purpose of assessing the model performance in the out-of-sample manner, that is, comparing the Thursday prices calculated using the parameters determined for Wednesday and those listed in real markets. Second, options far from the maturity (more than 90 days) and with less than 7 days to maturity are both discarded because the former category is not popular in real markets due to their high prices while the latter has less time value. Third, as a result of the illiquidity associated with very deep out-of-money and in-the-money options, options with more than 10% moneynessFootnote 2 and less than
 $-$
10% moneyness are all deleted. At last, due to the price instability, we remove options whose values are less than $1/8.
Having applied all the filters to the raw data set, we can now proceed to determine model parameters through the filtered data, and the related issues are discussed below.
4.2. Parameter estimation
Parameter estimation is always the first and also one of the most important steps in assessing model performance. One common approach in estimating model parameters is to determine a set of “optimal” parameters, with which the produced model prices are the “closest” to corresponding market option prices. Thus, to measure the “closeness”, we actually need an appropriate function to calculate the “distance” between market and model prices. Following [Reference Christoffersen and Jacobs10], dollar mean-squared errors are selected for such a distance, the expression of which can be written as
 $$ \begin{align} \displaystyle MSE=\frac{1}{N}\sum_{i=1}^{N}(C_{\text{Market}}-C_{\text{Model}})^2, \end{align} $$
where
 $C_{\text {Model}}$
and
 $C_{\text {Market}}$
respectively represent the option price produced by the model and that listed on the market, and N denotes the number of options used when estimating the parameters of that day.
Clearly, the parameter determination problem reduces to finding the optimal parameters that can lead to the objective function (4.1) to be minimized, solving which requires the selection of an appropriate optimization approach. In particular, local minimization algorithms are not appropriate, since the convexity of (4.1) cannot be guaranteed and the existence of different local minima is possible. To avoid ending up with a local minimum, global optimization algorithms are much more preferred.
What we choose is adaptive simulated annealing (ASA) [Reference Ingber31], an improved version of simulated annealing. The history of this algorithm dates back to 1983, when simulated annealing was initially established for highly nonlinear problems [Reference Kirkpatrick, Gelatt and Vecchi33]. It was then improved in [Reference Szu and Hartley45] by developing fast simulated annealing, an algorithm that ensures attainability of the global minimum in a finite time period. A further improvement was made in [Reference Ingber28] by proposing ASA, formerly known as “very fast simulated reannealing”, and it is able to adjust random step selection automatically based on the actual progress of the algorithm so that the speed of the algorithm can further be accelerated. In fact, ASA has already been implemented in different areas [Reference Chen, Luk and Liu8, Reference Chen and Luk9], including the application in calibrating models used to price options [Reference Ingber29, Reference Mikhailov and Nögel40]. Furthermore, the open-source code listed on Ingber’s homepage [Reference Ingber31] is updated regularly according to user feedback so that its flexibility and powerfulness are promised.
Moreover, as mentioned earlier, we also want to emphasize the mean reversion property of the stochastic long-term interest rate. Thus, we construct another two-factor Vasicek model using a normal distribution, and combine it with the Black–Scholes model (the BSVN model hereafter) as another benchmark:
 $$ \begin{align*} \frac{dS_t}{S_t}&=r_t\,dt+\sigma \,dW_{t}^{S}, \\ dr_t &=\alpha(\beta_t-r_t)\,dt+\eta \,dW_{t}^{r},\\ d\beta_t&=\bar{k}\,dt+\lambda \,dW_{t}^{\beta}. \end{align*} $$
By implementing ASA, we report the extracted parameters (averaged daily) in Table 1 Footnote 3.
Estimated parameters.

4.3. Empirical comparison
The assessment of the model performance based on the parameters estimated from real market data is now provided. If the difference between market and model prices is lower, we can regard the performance of that model better. There are mainly two categories in defining such pricing differences, yielding in-sample and out-of-sample errors. In particular, the difference between model prices produced using parameters estimated and market prices used for parameter estimation are defined as in-sample errors, to serve a guide of whether the target model can produce a good market fitness. In contrast, the difference between option prices computed with parameters determined from other sets of data and market option prices that have not been used to estimate parameters are defined as out-of-sample errors, to check whether the model can provide consistent results across different data sets so as to assess its prediction ability.
We compare in-sample as well as out-of-sample errors of the BSV model, the BSVN model and our model in Table 2. Note that the performance of the BSV model is generally worse than that of our model, in the sense that both errors are lower under our model, with a significant 20% improvement in the in-sample errors. Moreover, although the in-sample fitness of the BSVN model has been improved by the introduction of an additional normal factor, the out-of-sample performance is much worse than the other two models. This is actually strong evidence supporting the use of a mean reverting process to model the stochastic long-term interest rate. It should also be pointed out that the magnitude of out-of-sample errors are higher than that of in-sample errors under both models, which is reasonable since the optimal parameters obtained from one data set are not necessarily optimal for another set.
In- and out-of-sample errors.

We perform a t-test to see if the introduction of a two-factor stochastic interest rate and the use of a mean-reversion process in modelling the long-run equilibrium level can significantly reduce the pricing errors. The corresponding results are provided in Table 3. One can clearly see that the in- and out-of-sample errors differ significantly between our model and the BSV model at 1% and 4% significance levels, respectively, while those between our model and the BSVN model also differ significantly at 7% and 3% significance levels, respectively. This demonstrates the overall better performance of our model over both the BSV and BSVN models.
Significance tests of pricing errors.

Out-of-sample errors across different moneyness.

Implied volatility.

One may also be interested in how the three models perform differently when out-of-sample errors are classified into different moneyness. This is because a series of strike prices are available even for traded options of a day. We abbreviate “out of money”, “at the money” and “in the money” in the parentheses by (O), (A) and (I), respectively, and the results are presented in Table 4. Although the out-of-sample performance of the BSV model is slightly better than that of our model, as far as out of money options are concerned, the BSV model provides much worse performance in the other two categories compared with our model, with the greatest improvement shown by the at the money options. However, the out-of-sample performance of the BSVN model is the worst across all the three categories, which again demonstrate the importance of mean reversion in the stochastic long-term interest rate.
Considering that the accurate determination of implied volatility is a vital issue in finance practice, we display the ability of the three models in reproducing market implied volatility in Figure 4. A clear pattern in our model provides a better match to market-implied volatility, which emphasizes the significance of considering stochastic long-term interest rate as well as its mean reversion property.
5. Conclusion
In this paper, we assume that the long-run level of the Hull–While interest rate model is stochastic, following another Ornstein–Uhlenbeck process. The pricing of European options is discussed when the newly proposed two-factor interest rate model is introduced into the Black–Scholes model. Upon successfully expressing the characteristic function under a forward measure in an analytical form, a closed-form formula which is used to price European options is presented with the measure transformation. Based on this, the impact of the stochastic long-run interest level is shown to be significant on option prices through numerical experiments. To further see the meaning of introducing this stochastic long-run interest level and its mean reversion property, we have also conducted some empirical analysis, showing how the BSV model, BSVN model and our model perform differently, and the results demonstrate the effectiveness of our model over the other two models. It would be interesting to see how the term structure of interest rates implied by our model behaves. However, as the main focus of this paper is to check the performance of the proposed model when pricing equity options, we would like to leave this for future research.
Acknowledgements
This work is supported by the National Natural Science Foundation of China (No. 12301614, No. 12101554), the Fundamental Research Funds for Zhejiang Provincial Universities (No. GB202103001) and Zhejiang Provincial Soft Science Foundation of China (No. 2023C35047). The authors would like to gratefully acknowledge the anonymous referees’ constructive comments and suggestions, which greatly help to improve the correctness and readability of the manuscript.
Appendix A: Proof of Theorem 2.1
The risk-neutral pricing rule requires that
 $P(r,\beta ,t,T)$
be a solution to the following partial differential equation (PDE) system:
 $$ \begin{align} \displaystyle \left\{ \begin{array}{@{}lll} \displaystyle \frac{\partial P}{\partial t}+\frac{1}{2}\eta^2\frac{\partial^2P}{\partial r^2}+\frac{1}{2}\lambda^2\frac{\partial^2P}{\partial\beta^2}+\alpha(\beta-r)\frac{\partial P}{\partial r}+k(\theta-\beta)\frac{\partial P}{\partial\beta}-rP=0,&&\\\\[-6pt] \displaystyle P(r,\beta,t,T)|_{t=T}=1.&& \end{array} \right. \end{align} $$
By assuming the expression of
 $P(r,\beta ,t,T)$
[Reference He and Lin18, Reference He and Lin22, Reference Hu, Yang, He and Yue25, Reference Lin, Lin and He36] is the same as that of
 $$\begin{align*}\displaystyle P(r,t,T)=e^{C(\tau)+D(\tau)r_t+E(\tau)\beta_t},\end{align*}$$
we can transform PDE (A.1) into the following system of three ordinary differential equations (ODEs):
 $$ \begin{align} \left\{ \begin{aligned} \displaystyle \frac{dD}{d\tau}&=-\alpha D-1,\quad D(0)=0,\\[4pt] \displaystyle \frac{dE}{d\tau}&=-kE+\alpha D,\quad E(0)=0,\\[4pt] \displaystyle \frac{dC}{d\tau}&=\frac{1}{2}\eta^2D^2+\frac{1}{2}\lambda^2E^2+k\theta E,\quad C(0)=0,\\ \end{aligned} \right. \end{align} $$
where
 $D(\tau )$
and
 $E(\tau )$
can be directly solved as the ODEs governing them are both linear and first-order, leading to the solution to
 $C(\tau )$
obtained through the integration of its ODE on both sides. This completes the proof.
Appendix B: Proof of Theorem 2.2
According to the definition of the characteristic function,
 $$ \begin{align*} \displaystyle f(\phi;\tau,y,r,\beta)=E^{Q^T}[e^{j\phi y_T}|y_t,r_t,\beta_t], \end{align*} $$
we deduce that
 $f(\phi ;\tau ,y,r,\beta )$
is a solution to
 $$ \begin{align} \frac{\partial f}{\partial\tau}&=\frac{1}{2}\sigma^2\frac{\partial^2f}{\partial y^2}+\frac{1}{2}\eta^2\frac{\partial^2f}{\partial r^2}+\frac{1}{2}\lambda^2\frac{\partial^2f}{\partial\beta^2}+\rho\sigma\eta\frac{\partial^2f}{\partial y\partial r}+\bigg[r-\frac{1}{2}\sigma^2+\rho\sigma\eta D(\tau)\bigg]\frac{\partial f}{\partial y} \nonumber\\[4pt] & \quad + [\alpha\beta+\eta^2D(\tau)-\alpha r] \frac{\partial f}{\partial r}+ [k\theta+\lambda^2E(\tau)-k\beta ]\frac{\partial f}{\partial\beta}, \end{align} $$
where
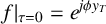 $\displaystyle f|_{\tau =0}=e^{j\phi y_T}$
. By assuming
 $$ \begin{align*} \displaystyle f=e^{\bar{C}(\phi;\tau)+\bar{D}(\phi;\tau)r_t+\bar{E}(\phi;\tau)\beta_t+j\phi y_t}, \end{align*} $$
it can be shown that the PDE (B.1) is equivalent to the following three ODEs:
 $$ \begin{align*} \frac{d\bar{D}}{d\tau}&=-\alpha\bar{D}+j\phi,\\ \frac{d\bar{E}}{d\tau}&=-k\bar{E}+\alpha\bar{D},\\ \frac{d\bar{C}}{d\tau}&=\frac{1}{2}\eta^2\bar{D}^2+\frac{1}{2}\lambda^2\bar{E}^2+\eta^2D\bar{D}+\lambda^2E \bar{E}+j\phi\rho\sigma\eta(\bar{D}+D)+k\theta\bar{E}-\frac{1}{2}\sigma^2(\phi^2+j\phi), \end{align*} $$
where
 $\bar {C}(\phi ;0)=\bar {D}(\phi ;0)=\bar {E}(\phi ;0)=0$
. All three ODEs are first-order linear ones, the solutions to which can be easily determined.



