1. Introduction
Shallow water flows often exhibit turbulent structures such as rollers of hydraulic jumps or of coastal water waves in the surf zone, or the formation of rip-currents due to the interaction of incident sea waves with a coastline. The appearance of these structures is often related to the mechanism of wave breaking. Several experimental works have investigated, in particular, the flow of hydraulic jumps or spilling water waves and studied the mechanism of vorticity or turbulence generation (Hornung, Willert & Turner Reference Hornung, Willert and Turner1995; Dabiri & Gharib Reference Dabiri and Gharib1997; Svendsen et al. Reference Svendsen, Veeramony, Bakunin and Kirby2000; Misra et al. Reference Misra, Kirby, Brocchini, Veron, Thomas and Kambhamettu2008; Mignot & Cienfuegos Reference Mignot and Cienfuegos2010, Reference Mignot and Cienfuegos2011; Chachereau & Chanson Reference Chachereau and Chanson2011). In particular, Misra et al. (Reference Misra, Kirby, Brocchini, Veron, Thomas and Kambhamettu2008) highlighted the importance of an intense shear layer which spreads downstream from the toe of the breaker below the spilling breaker, and the recirculating region of the roller where the turbulent kinetic energy is most intense.
On the other hand, the mathematical description of shallow water flows through the various existing models has considerable difficulty in predicting and taking into account these turbulent structures. Some models such as the well-known Saint-Venant model (Barré de Saint-Venant Reference Barré de Saint-Venant1871), also called ‘non-linear shallow water equations’, are hyperbolic and predict that all growing waves break, which is not the case. The solitary wave, such as the wave observed by Russell (Reference Russell1844), never breaks and it keeps its shape over very long distances with only a small attenuation. On the other hand, dispersive models such as the Green–Naghdi model (Serre Reference Serre1953; Su & Gardner Reference Su and Gardner1969; Green, Laws & Naghdi Reference Green, Laws and Naghdi1974) predict that no wave breaks, which is obviously incorrect. A common assumption of these models is that the velocity component parallel to the bottom is uniform or almost uniform over the whole depth of the fluid, which is not a good starting point to take into account turbulent structures where there are considerable fluctuations in velocity.
This problem is of considerable practical importance, for example in the case of coastal water waves. However, as no model has been built to handle the full propagation of these waves in the near-shore zone, from the shoaling zone to the surf zone, the breaking phenomenon is usually predicted empirically. Typically, Green–Naghdi equations are used before breaking and the dispersive terms are switched off just before breaking, which is equivalent to using the Saint-Venant equations (Bonneton et al. Reference Bonneton, Chazel, Lannes, Marche and Tissier2011; Tissier et al. Reference Tissier, Bonneton, Marche, Chazel and Lannes2012). Another approach is to add an ad hoc viscous term to the Green–Naghdi equations, which accounts for the energy dissipation during breaking (e.g. Cienfuegos, Barthelemy & Bonneton Reference Cienfuegos, Barthelemy and Bonneton2010).
Non-dissipative equations of shear shallow water flows were proposed in the linear case by Burns (Reference Burns1953) and in the non-linear case by Benney (Reference Benney1973) (see also a recent paper by Bridges & Needham Reference Bridges and Needham2011). A simpler model of shear flows was derived in Teshukov (Reference Teshukov2007), where approximate integral relations derived from the Euler equations were used. When augmented by dissipative terms in Richard & Gavrilyuk (Reference Richard and Gavrilyuk2012, Reference Richard and Gavrilyuk2013), the model exhibited an excellent qualitative and quantitative comparison with the experimental results in the study of roll waves and hydraulic jumps. This model is able to handle turbulence effects by taking into account a non-uniform velocity over the fluid depth through a new variable called enstrophy, which is the square of the vorticity. This model satisfactorily describes flows exhibiting turbulent structures such as hydraulic jump rollers (Richard & Gavrilyuk Reference Richard and Gavrilyuk2013) and turbulent roll waves (Richard & Gavrilyuk Reference Richard and Gavrilyuk2012). Compared to the more customary models such as those of Saint-Venant or Green–Naghdi, which are two-equation models (for the fluid depth and the velocity), this is a three-equation model (for the fluid depth, velocity and enstrophy) describing the conservation of mass, momentum and energy. Contrary to the models quoted above, it includes an equation for the turbulent energy. This model is hyperbolic, and hence produces shocks in finite time. The key point is that the enstrophy generation, which is usually related to turbulence generation and the appearance of a turbulent structure, is due to the shocks (discontinuities) through the shock relations (Rankine–Hugoniot relations) which come from the mass, momentum and energy balance equations. The dissipation of the enstrophy is governed by the right-hand side of the equations. It is natural to add dispersive terms to this model. Usually, this procedure regularizes solutions of the equations. Since the equations are no longer hyperbolic, the mechanism of vorticity creation through shocks is no longer valid. The question to be answered is how enstrophy and thus turbulence can be generated in a dispersive non-hyperbolic model. We must also emphasize that the general statement ‘dispersive means non-hyperbolic’ can be wrong (see, for example, the paper by Antuono, Liapidevskii & Brocchini Reference Antuono, Liapidevskii and Brocchini2009 on a specific hyperbolic regularization of the Boussinesq-type equations).
The study of a solitary wave of amplitude
 $a$
propagating in still water of constant depth
 $h_{\infty }$
over a horizontal bottom is particularly interesting, since below a limit value of
 $a/h_{\infty }$
the solitary wave has no turbulent structure, does not break and propagates with very little deformation over long distances, whereas above a limit value of
 $a/h_{\infty }$
a turbulent structure appears in the upper part of the wave, which loses symmetry and rapidly slows and attenuates (Boussinesq Reference Boussinesq1872). After the first observation by Russell (Reference Russell1844), a theoretical solution was established by Boussinesq (Reference Boussinesq1872) and Rayleigh (1876). The existence of solitary waves for potential flows was theoretically established by Lavrent’ev (Reference Lavrent’ev1947) and Friedrichs & Hyers (Reference Friedrichs and Hyers1954). Higher-order approximations in
 $a/h_{\infty }$
have been derived by Grimshaw (Reference Grimshaw1971), Fenton (Reference Fenton1972), Shields & Webster (Reference Shields and Webster1988) and recently by Kim et al. (Reference Kim, Bai, Ertekin and Webster2003). In particular, the method proposed by Shields & Webster (Reference Shields and Webster1988) does not assume, a priori, the flow potentiality. A solitary wave solution can be found in explicit form for a number of dispersive models of water waves (Korteweg & de Vries Reference Korteweg and de Vries1895; Su & Gardner Reference Su and Gardner1969). The limit value of
 $a/h_{\infty }$
for the existence of non-breaking solitary waves was the subject of many studies. The theoretical value of 0.78 found by McCowan (Reference McCowan1894) is a standard reference value, although experimental measures give a smaller value of 0.70 (Watanabe Reference Watanabe2007).
The aim of this work is to derive a conservative dispersive model of shear shallow water flows which is able to generate turbulence. Turbulence will be defined as the rapidly varied part of the flow, i.e. as the velocity fluctuation which varies over small-scale lengths compared to the fluid depth. In contrast, velocity fluctuation which varies on lengths of the same scale as the fluid depth will be called shearing. This approach bears some resemblance to the approach of Antuono & Brocchini (Reference Antuono and Brocchini2013), but it differs in the way the averaging defining turbulent variables is done. The dispersive model generalizes the well-known Green–Naghdi (GN) model to the case of shear flows. The usual dispersive corrections to the Saint-Venant equations leading to the Green–Naghdi equations are supplemented with terms of higher order, taking into account shearing and turbulence effects. The GN system has been derived many times, first by Serre (Reference Serre1953) and then by Su & Gardner (Reference Su and Gardner1969) in the case of one-dimensional surface waves over a flat bottom, and extended to two-dimensional surface waves over a non-trivial bottom topography by Green et al. (Reference Green, Laws and Naghdi1974) and Green & Naghdi (Reference Green and Naghdi1976). If
 $L$
is a characteristic wavelength and
 $H$
is a characteristic water depth, we define the dimensionless small parameter
 ${\it\varepsilon}=H/L$
. Usually the GN equations for potential flows are obtained by depth-averaging the Euler system and only keeping terms up to second order with respect to
 ${\it\varepsilon}$
, without making any assumptions on the amplitude of the waves. A mathematical justification of the GN model has been given by Makarenko (Reference Makarenko1986) and Lannes (Reference Lannes2013). In recent years we have seen increased activity both in the study of modelling properties of the GN system (Gavrilyuk & Teshukov Reference Gavrilyuk and Teshukov2001; El, Grimshaw & Smyth Reference El, Grimshaw and Smyth2006; Barros, Gavrilyuk & Teshukov Reference Barros, Gavrilyuk and Teshukov2007; Carter & Cienfuegos Reference Carter and Cienfuegos2011 and others), and numerics (Le Metayer, Gavrilyuk & Hank Reference Le Metayer, Gavrilyuk and Hank2010; Bonneton et al.
Reference Bonneton, Chazel, Lannes, Marche and Tissier2011; Li et al.
Reference Li, Guyenne, Li and Xu2014 and others).
In the dispersive model we derive here, the turbulence generation is due to the shearing–turbulence interaction, i.e. to the interaction between fluctuations of large and small scales. This turbulence generation is reversible in the sense that the turbulence generated can disappear in the same way it appeared, the equations being invariant by time reversal. The irreversible phenomena which exist in turbulence structures are dissipative in nature and will not be considered here. Our concern will be only the onset of the formation of turbulent structures from a flow where these are absent. The inclusion of these dissipative terms will be left for future work.
The model derivation is given in § 2. The decomposition of the velocity fluctuation into a shearing part and a turbulent part and its consequences will be examined in § 3. Solitary wave solutions are studied in § 4 and the predictions of the model are compared to experimental results from the literature on solitary waves.
Notation used in the text.

2. Derivation of the model of dispersive shear shallow water flows
2.1. General setting
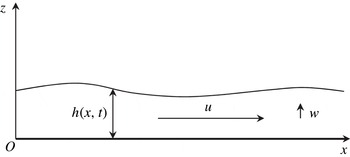
Consider the Euler equations for two-dimensional flows over a flat bottom. The choice of such a simplified topography allows us to separate the study of wave–shear current interaction and geometrical effects due to the bottom topography that naturally induce vertical flows. The introduction of the bottom topography, which is important for applications, can be given in a standard way. In Cartesian coordinate system
 $Oxz$
, the horizontal velocity component in direction
 $Ox$
is
 $u$
, and in the vertical direction
 $Oz$
the velocity component is
 $w$
(see figure 1). With
 ${\it\rho}$
being the fluid density and
 $p$
the fluid pressure, the Euler equations can be written as
 $$\begin{eqnarray}\displaystyle & \displaystyle \frac{\partial u}{\partial x}+\frac{\partial w}{\partial z}=0, & \displaystyle\end{eqnarray}$$
 $$\begin{eqnarray}\displaystyle & \displaystyle {\it\rho}\left(\frac{\partial u}{\partial t}+u\frac{\partial u}{\partial x}+w\frac{\partial u}{\partial z}\right)=-\frac{\partial p}{\partial x}, & \displaystyle\end{eqnarray}$$
 $$\begin{eqnarray}\displaystyle & \displaystyle {\it\rho}\left(\frac{\partial w}{\partial t}+u\frac{\partial w}{\partial x}+w\frac{\partial w}{\partial z}\right)=-{\it\rho}g-\frac{\partial p}{\partial z}. & \displaystyle\end{eqnarray}$$
 $g$
is the acceleration due to gravity. The corresponding boundary condition at the flat rigid bottom
 $z=0$
is
 $$\begin{eqnarray}w|_{z=0}=0.\end{eqnarray}$$
At the free surface
 $z=h(t,x)$
, the kinematic and dynamic conditions are, respectively,
 $$\begin{eqnarray}\frac{\partial h}{\partial t}+u|_{z=h}\frac{\partial h}{\partial x}=w|_{z=h},\quad p|_{z=h}=0.\end{eqnarray}$$
Equations (2.1)–(2.3) admit the conservation of energy:
 $$\begin{eqnarray}\frac{\partial E}{\partial t}+\frac{\partial }{\partial x}(uE+pu)+\frac{\partial }{\partial z}(wE+pw)=0,\end{eqnarray}$$
where
 $$\begin{eqnarray}E=\frac{u^{2}}{2}+\frac{w^{2}}{2}+gz\end{eqnarray}$$
is the specific energy. The equations are then put in dimensionless form by a standard scaling:
 $$\begin{eqnarray}x=L\tilde{x},\quad z=H\tilde{z},\quad t=\frac{V}{L}\tilde{t},\quad u=V\tilde{u} ,\quad w={\it\varepsilon}V\tilde{w},\quad p={\it\rho}gH\tilde{p}.\end{eqnarray}$$
Here
 ${\it\varepsilon}=H/L$
is a standard shallow water parameter, and
 $V=\sqrt{gH}$
(the characteristic Froude number is 1). The dimensionless quantities are denoted by the same letters but with a tilde. In dimensionless form, the balance equations of mass (2.1), momentum (2.2) and (2.3) and energy (2.6) become
 $$\begin{eqnarray}\displaystyle & \displaystyle \frac{\partial \tilde{u} }{\partial \tilde{x}}+\frac{\partial \tilde{w}}{\partial \tilde{z}}=0, & \displaystyle\end{eqnarray}$$
 $$\begin{eqnarray}\displaystyle & \displaystyle \frac{\partial \tilde{u} }{\partial \tilde{t}}+\frac{\partial \tilde{u} ^{2}}{\partial \tilde{x}}+\frac{\partial \tilde{u} \tilde{w}}{\partial \tilde{z}}=-\frac{\partial \tilde{p}}{\partial \tilde{x}}, & \displaystyle\end{eqnarray}$$
 $$\begin{eqnarray}\displaystyle & \displaystyle {\it\varepsilon}^{2}\left(\frac{\partial \tilde{w}}{\partial \tilde{t}}+\frac{\partial \tilde{u} \tilde{w}}{\partial \tilde{x}}+\frac{\partial \tilde{w}^{2}}{\partial \tilde{z}}\right)=-1-\frac{\partial \tilde{p}}{\partial \tilde{z}}, & \displaystyle\end{eqnarray}$$
 $$\begin{eqnarray}\displaystyle & \displaystyle \frac{\partial \tilde{E}}{\partial \tilde{t}}+\frac{\partial }{\partial \tilde{x}}(\tilde{u} \tilde{E}+\tilde{p}\tilde{u} )+\frac{\partial }{\partial \tilde{z}}(\tilde{w}\tilde{E}+\tilde{p}\tilde{w})=0, & \displaystyle\end{eqnarray}$$
 $$\begin{eqnarray}\tilde{E}=\frac{\tilde{u} ^{2}}{2}+{\it\varepsilon}^{2}\frac{\tilde{w}^{2}}{2}+\tilde{z}\end{eqnarray}$$
is the dimensionless specific energy. If the term
 $O({\it\varepsilon}^{2})$
is neglected in (2.11), the pressure is hydrostatic. If not, there is a non-hydrostatic correction to the pressure which is
 $O({\it\varepsilon}^{2})$
. Indeed, the vertical velocity which can be found from (2.1) and the slipping condition (2.4) is of order one,
 $$\begin{eqnarray}\tilde{w}=-\int _{0}^{\tilde{z}}\tilde{u} _{\tilde{x}}(\tilde{t},\tilde{x},s)\,\text{d}s,\end{eqnarray}$$
so the pressure is then
 $O({\it\varepsilon}^{2})$
.
2.2. Averaging over the depth
2.2.1. Balance equations of mass, momentum and energy
The equations (2.9)–(2.12) are then averaged over the depth. For any quantity
 $X$
, the average of
 $X$
is denoted by
 $\langle X\rangle$
and is defined by
 $$\begin{eqnarray}\langle X\rangle =\frac{1}{h}\int _{0}^{h}X\,\text{d}z.\end{eqnarray}$$
For a dimensionless quantity a tilde is simply added. As an exception, the average of the
 $x$
-component of the velocity,
 $u$
, will be denoted by
 $U$
instead of
 $\langle u\rangle$
for convenience. The equations are integrated over
 $z$
from
 $z=0$
to
 $z=h$
. Using the boundary conditions (2.4) and (2.5), we obtain from (2.9), (2.10) and (2.12) the following exact integral equations:
 $$\begin{eqnarray}\displaystyle & \displaystyle \frac{\partial \tilde{h}}{\partial \tilde{t}}+\frac{\partial \tilde{h}\tilde{U} }{\partial \tilde{x}}=0, & \displaystyle\end{eqnarray}$$
 $$\begin{eqnarray}\displaystyle & \displaystyle \frac{\partial \tilde{h}\tilde{U} }{\partial \tilde{t}}+\frac{\partial }{\partial \tilde{x}}\left(\tilde{h}\langle \tilde{u} ^{2}\rangle +\int _{0}^{\tilde{h}}\tilde{p}\,\text{d}\tilde{z}\right)=0, & \displaystyle\end{eqnarray}$$
 $$\begin{eqnarray}\displaystyle & & \displaystyle \displaystyle \frac{\partial }{\partial \tilde{t}}\left[\tilde{h}\left(\frac{\langle \tilde{u} ^{2}\rangle }{2}+\frac{\tilde{h}}{2}+{\it\varepsilon}^{2}\frac{\langle \tilde{w}^{2}\rangle }{2}\right)\right]\nonumber\\ \displaystyle & & \displaystyle \quad +\,\frac{\partial }{\partial \tilde{x}}\left[\frac{\tilde{h}\langle \tilde{u} ^{3}\rangle }{2}+\int _{0}^{\tilde{h}}\tilde{z}\tilde{u} \;\text{d}\tilde{z}+\int _{0}^{\tilde{h}}\tilde{p}\tilde{u} \;\text{d}\tilde{z}+{\it\varepsilon}^{2}\frac{\tilde{h}\langle \tilde{u} \tilde{w}^{2}\rangle }{2}\right]=0.\end{eqnarray}$$
2.2.2. Decomposition of the velocity
We want to derive a model of shallow water accounting for dispersion and shear effects. To this end, we present the velocity
 $u$
as the sum of its mean value over the depth
 $U$
and its fluctuation
 $u_{1}$
by
 $$\begin{eqnarray}u(x,z,t)=U(x,t)+u_{1}(x,z,t).\end{eqnarray}$$
All the dependence on
 $z$
of the
 $x$
-component of the velocity is included in the fluctuation
 $u_{1}$
. By definition,
 $\langle u\rangle =U$
and
 $\langle u_{1}\rangle =0$
. We suppose that the flow is weakly sheared, i.e. that the fluctuation
 $u_{1}$
is of order
 $O({\it\varepsilon}^{{\it\beta}})$
,
 ${\it\beta}>0$
. The value of
 ${\it\beta}$
will be discussed later. In dimensionless form, we then write
 $$\begin{eqnarray}\tilde{u} =\tilde{U} +{\it\varepsilon}^{{\it\beta}}\tilde{u} _{1}.\end{eqnarray}$$
We can thus express
 $\langle u^{2}\rangle$
and
 $\langle u^{3}\rangle$
in dimensionless form:
 $$\begin{eqnarray}\displaystyle & \langle \tilde{u} ^{2}\rangle =\tilde{U} ^{2}+{\it\varepsilon}^{2{\it\beta}}\langle \tilde{u} _{1}^{2}\rangle , & \displaystyle\end{eqnarray}$$
 $$\begin{eqnarray}\displaystyle & \langle \tilde{u} ^{3}\rangle =\tilde{U} ^{3}+3{\it\varepsilon}^{2{\it\beta}}\tilde{U} \langle \tilde{u} _{1}^{2}\rangle +{\it\varepsilon}^{3{\it\beta}}\langle \tilde{u} _{1}^{3}\rangle . & \displaystyle\end{eqnarray}$$
 $$\begin{eqnarray}\displaystyle & & \displaystyle \displaystyle \frac{\partial \tilde{h}\tilde{U} }{\partial \tilde{t}}+\frac{\partial }{\partial \tilde{x}}\left(\tilde{h}\tilde{U} ^{2}+{\it\varepsilon}^{2{\it\beta}}\tilde{h}\langle \tilde{u} _{1}^{2}\rangle +\int _{0}^{\tilde{h}}\tilde{p}\;\text{d}\tilde{z}\right)=0,\end{eqnarray}$$
 $$\begin{eqnarray}\displaystyle & & \displaystyle \displaystyle \frac{\partial }{\partial \tilde{t}}\left[\tilde{h}\left(\frac{\tilde{U} ^{2}}{2}+{\it\varepsilon}^{2{\it\beta}}\frac{\langle \tilde{u} _{1}^{2}\rangle }{2}+\frac{\tilde{h}}{2}+{\it\varepsilon}^{2}\frac{\langle \tilde{w}^{2}\rangle }{2}\right)\right]\nonumber\\ \displaystyle & & \displaystyle +\,\frac{\partial }{\partial \tilde{x}}\left[\frac{\tilde{h}\tilde{U} ^{3}}{2}+\frac{3}{2}{\it\varepsilon}^{2{\it\beta}}\tilde{h}\tilde{U} \langle \tilde{u} _{1}^{2}\rangle +{\it\varepsilon}^{3{\it\beta}}\frac{\tilde{h}\langle \tilde{u} _{1}^{3}\rangle }{2}\right.\nonumber\\ \displaystyle & & \displaystyle +\left.\,\int _{0}^{\tilde{h}}\tilde{z}\tilde{u} \;\text{d}\tilde{z}+\int _{0}^{\tilde{h}}\tilde{p}\tilde{u} \;\text{d}\tilde{z}+{\it\varepsilon}^{2}\frac{\tilde{h}\langle \tilde{u} \tilde{w}^{2}\rangle }{2}\right]=0.\end{eqnarray}$$
2.2.3. Definition of enstrophy
As in Richard & Gavrilyuk (Reference Richard and Gavrilyuk2012, Reference Richard and Gavrilyuk2013), the following variable is introduced:
 $$\begin{eqnarray}{\it\Psi}=\frac{\langle u_{1}^{2}\rangle }{h^{2}}.\end{eqnarray}$$
We called it enstrophy, as it is related to the square of the vorticity. We can define a dimensionless enstrophy by
 $$\begin{eqnarray}\tilde{{\it\Psi}}=\frac{{\it\Psi}H}{g}.\end{eqnarray}$$
The enstrophy will be a fundamental variable of our model.
2.2.4. Pressure
As stated previously, the pressure is hydrostatic if the
 $O({\it\varepsilon}^{2})$
term is neglected. Letting
 $p_{NH}$
denote the non-hydrostatic correction to the pressure, we obtain, in dimensionless form,
 $$\begin{eqnarray}\tilde{p}(\tilde{z})=\underbrace{\tilde{h}-\tilde{z}}_{\mathit{hydrostatic}}+\underbrace{{\it\varepsilon}^{2}\tilde{p}_{NH}}_{\mathit{non}\text{-}\mathit{hydrostatic}}.\end{eqnarray}$$
With the definition of enstrophy, equations (2.23) and (2.24) become
 $$\begin{eqnarray}\frac{\partial \tilde{h}\tilde{U} }{\partial \tilde{t}}+\frac{\partial }{\partial \tilde{x}}\left(\tilde{h}\tilde{U} ^{2}+{\it\varepsilon}^{2{\it\beta}}\tilde{h}^{3}\tilde{{\it\Psi}}+\frac{\tilde{h}^{2}}{2}+{\it\varepsilon}^{2}\int _{0}^{\tilde{h}}\tilde{p}_{NH}\;\text{d}\tilde{z}\right)=0\end{eqnarray}$$
and
 $$\begin{eqnarray}\displaystyle & & \displaystyle \displaystyle \frac{\partial }{\partial \tilde{t}}\left[\tilde{h}\left(\frac{\tilde{U} ^{2}}{2}+{\it\varepsilon}^{2{\it\beta}}\frac{\tilde{h}^{2}\tilde{{\it\Psi}}}{2}+\frac{\tilde{h}}{2}+{\it\varepsilon}^{2}\frac{\langle \tilde{w}^{2}\rangle }{2}\right)\right]+\frac{\partial }{\partial \tilde{x}}\left[\frac{\tilde{h}\tilde{U} ^{3}}{2}+\frac{3}{2}{\it\varepsilon}^{2{\it\beta}}\tilde{h}^{3}\tilde{U} \,\tilde{{\it\Psi}}+{\it\varepsilon}^{3{\it\beta}}\frac{\tilde{h}\langle \tilde{u} _{1}^{3}\rangle }{2}\right.\nonumber\\ \displaystyle & & \displaystyle \displaystyle \quad +\left.\,\tilde{h}^{2}\tilde{U} +{\it\varepsilon}^{2}\tilde{U} \int _{0}^{\tilde{h}}\tilde{p}_{NH}\;\text{d}\tilde{z}+{\it\varepsilon}^{2+{\it\beta}}\int _{0}^{\tilde{h}}\tilde{p}_{NH}\tilde{u} _{1}\;\text{d}\tilde{z}+{\it\varepsilon}^{2}\frac{\tilde{h}\langle \tilde{u} \tilde{w}^{2}\rangle }{2}\right]=0.\end{eqnarray}$$
The non-hydrostatic correction to the pressure can be expressed as
 $$\begin{eqnarray}\tilde{p}_{NH}=-\int _{\tilde{h}}^{\tilde{z}}\left(\frac{\partial \tilde{w}}{\partial \tilde{t}}+\frac{\partial \tilde{u} \tilde{w}}{\partial \tilde{x}}+\frac{\partial \tilde{w}^{2}}{\partial \tilde{z}}\right)\;\text{d}\tilde{z}.\end{eqnarray}$$
The velocity
 $\tilde{w}$
can be found from the continuity equation (2.1):
 $$\begin{eqnarray}\tilde{w}(\tilde{z})=-\int _{0}^{\tilde{z}}\frac{\partial \tilde{u} }{\partial \tilde{x}}\;\text{d}\tilde{z}.\end{eqnarray}$$
The decomposition of the velocity
 $\tilde{u} =\tilde{U} +{\it\varepsilon}^{{\it\beta}}\tilde{u} _{1}$
leads to the following expression of the vertical velocity
 $\tilde{w}$
:
 $$\begin{eqnarray}\tilde{w}(\tilde{z})=-\tilde{z}\frac{\partial \tilde{U} }{\partial \tilde{x}}-{\it\varepsilon}^{{\it\beta}}\int _{0}^{\tilde{z}}\frac{\partial \tilde{u} _{1}}{\partial \tilde{x}}\;\text{d}\tilde{z}.\end{eqnarray}$$
We emphasize that the horizontal velocity is not supposed to be uniform in the depth. Further, the flow is not necessarily irrotational. The material derivative related to the average flow is introduced:
 $$\begin{eqnarray}\frac{\text{D}}{\text{D}t}=\frac{\partial }{\partial t}+U\frac{\partial }{\partial x}.\end{eqnarray}$$
To reduce the notation we will also use the ‘dot’ symbol for the material derivative, but only in the case of the fluid depth:
 $$\begin{eqnarray}{\dot{h}}=\frac{\text{D}h}{\text{D}t}=\frac{\partial h}{\partial t}+U\frac{\partial h}{\partial x}.\end{eqnarray}$$
The velocity
 $\tilde{w}$
can thus be written as
 $$\begin{eqnarray}\tilde{w}(\tilde{z})=\tilde{z}\frac{\dot{\tilde{h}}}{\tilde{h}}-{\it\varepsilon}^{{\it\beta}}\int _{0}^{\tilde{z}}\frac{\partial \tilde{u} _{1}}{\partial \tilde{x}}\;\text{d}\tilde{z}.\end{eqnarray}$$
The non-hydrostatic correction to the pressure can then be expressed as the sum of a
 $O({\it\varepsilon}^{2})$
term which appears in the Green–Naghdi model and a
 $O({\it\varepsilon}^{2+{\it\beta}})$
correction to the Green–Naghdi model, denoted by
 $p_{NGN}$
(‘non-Green–Naghdi’):
 $$\begin{eqnarray}\tilde{p}_{NH}=\underbrace{\frac{\tilde{h}^{2}-\tilde{z}^{2}}{2}\frac{\ddot{\tilde{h}}}{\tilde{h}}}_{\mathit{Green}{-}\mathit{Naghdi}}+\,{\it\varepsilon}^{{\it\beta}}\tilde{p}_{NGN}+O({\it\varepsilon}^{2{\it\beta}}).\end{eqnarray}$$
The averaging of this non-hydrostatic pressure over the fluid depth yields the following expression, with a term that appears in the Green–Naghdi equations and a new term which has to be investigated:
 $$\begin{eqnarray}{\it\varepsilon}^{2}\int _{0}^{\tilde{h}}\tilde{p}_{NH}\;\text{d}\tilde{z}=\underbrace{{\it\varepsilon}^{2}\frac{\tilde{h}^{2}\ddot{\tilde{h}}}{3}}_{\mathit{Green}{-}\mathit{Naghdi}}+\,{\it\varepsilon}^{2+{\it\beta}}\int _{0}^{\tilde{h}}\tilde{p}_{NGN}\;\text{d}\tilde{z}+O({\it\varepsilon}^{2+2{\it\beta}}).\end{eqnarray}$$
2.2.5. Definition of the quantity
 $A$

Direct calculations give us that the
 $O({\it\varepsilon}^{2+{\it\beta}})$
correction to the pressure can be written as
 $$\begin{eqnarray}\int _{0}^{\tilde{h}}\tilde{p}_{NGN}\;\text{d}\tilde{z}=\frac{\partial }{\partial \tilde{x}}\frac{\text{D}\tilde{A}}{\text{D}\tilde{t}}+2\tilde{A}\frac{\partial }{\partial \tilde{x}}\left(\frac{\dot{\tilde{h}}}{\tilde{h}}\right),\end{eqnarray}$$
where the new quantity
 $\tilde{A}$
is given by
 $$\begin{eqnarray}\tilde{A}=\int _{0}^{\tilde{h}}\,\text{d}\tilde{z}\int _{\tilde{h}}^{\tilde{z}}\text{d}\tilde{z}\int _{0}^{\tilde{z}}\tilde{u} _{1}\;\text{d}\tilde{z}.\end{eqnarray}$$
This quantity
 $\tilde{A}$
can also be written in a simpler form,
 $$\begin{eqnarray}\tilde{A}=\int _{0}^{\tilde{h}}\frac{\tilde{z}^{2}}{2}\tilde{u} _{1}\;\text{d}\tilde{z}.\end{eqnarray}$$
The material derivative
 $\text{D}\tilde{A}/\text{D}t$
has the same meaning as in (2.33). The main relevance of
 $\tilde{A}$
is that all
 $O({\it\varepsilon}^{2+{\it\beta}})$
terms from our system of (2.28) and (2.29) can be expressed with the quantities
 $\tilde{h}$
,
 $\tilde{A}$
or their derivatives and with
 $\tilde{U}$
. Thus
 $$\begin{eqnarray}\displaystyle & \displaystyle {\it\varepsilon}^{2}\langle \tilde{w}^{2}\rangle ={\it\varepsilon}^{2}\frac{\dot{\tilde{h}}^{2}}{3}+2{\it\varepsilon}^{2+{\it\beta}}\frac{\dot{\tilde{h}}}{\tilde{h}^{2}}\frac{\partial \tilde{A}}{\partial \tilde{x}}+O({\it\varepsilon}^{2+2{\it\beta}}), & \displaystyle\end{eqnarray}$$
 $$\begin{eqnarray}\displaystyle & \displaystyle {\it\varepsilon}^{2+{\it\beta}}\int _{0}^{\tilde{h}}\tilde{p}_{NH}\tilde{u} _{1}\;\text{d}\tilde{z}=-{\it\varepsilon}^{2+{\it\beta}}\tilde{A}\frac{\ddot{\tilde{h}}}{\tilde{h}}+O({\it\varepsilon}^{2+2{\it\beta}}), & \displaystyle\end{eqnarray}$$
 $$\begin{eqnarray}{\it\varepsilon}^{2}\tilde{h}\langle \tilde{u} \tilde{w}^{2}\rangle ={\it\varepsilon}^{2}\frac{\tilde{h}\tilde{U} \dot{\tilde{h}}^{2}}{3}+2{\it\varepsilon}^{2+{\it\beta}}\tilde{A}\left(\frac{\dot{\tilde{h}}}{\tilde{h}}\right)^{2}+2{\it\varepsilon}^{2+{\it\beta}}\frac{\dot{\tilde{h}}}{\tilde{h}}\tilde{U} \frac{\partial \tilde{A}}{\partial \tilde{x}}+O({\it\varepsilon}^{2+2{\it\beta}}).\end{eqnarray}$$
All
 $O({\it\varepsilon}^{2})$
terms appear in the Green–Naghdi model whereas
 $O({\it\varepsilon}^{2+{\it\beta}})$
terms are corrections to this model.
2.3. Discussion
We finally obtain the following system of equations, where only
 $O({\it\varepsilon}^{2+2{\it\beta}})$
terms are neglected:
 $$\begin{eqnarray}\displaystyle & \displaystyle \frac{\partial \tilde{h}}{\partial \tilde{t}}+\frac{\partial \tilde{h}\tilde{U} }{\partial \tilde{x}}=0, & \displaystyle\end{eqnarray}$$
 $$\begin{eqnarray}\displaystyle & \displaystyle \frac{\partial \tilde{h}\tilde{U} }{\partial \tilde{t}}+\frac{\partial }{\partial \tilde{x}}[\tilde{h}\tilde{U} ^{2}+\tilde{P}]=O({\it\varepsilon}^{2+2{\it\beta}}), & \displaystyle\end{eqnarray}$$
 $$\begin{eqnarray}\displaystyle & \displaystyle \frac{\partial \tilde{h}\tilde{e}}{\partial \tilde{t}}+\frac{\partial }{\partial \tilde{x}}\left[\tilde{h}\tilde{U} \left(\tilde{e}+\frac{\tilde{P}}{\tilde{h}}\right)+{\it\varepsilon}^{2+{\it\beta}}\tilde{A}\left(\frac{\dot{\tilde{h}}^{2}}{\tilde{h}^{2}}-\frac{\ddot{\tilde{h}}}{\tilde{h}}\right)+{\it\varepsilon}^{3{\it\beta}}\frac{\tilde{h}\langle \tilde{u} _{1}^{3}\rangle }{2}\right]=O({\it\varepsilon}^{2+2{\it\beta}}). & \displaystyle\end{eqnarray}$$
 $\tilde{P}$
and the energy
 $\tilde{e}$
are given by
 $$\begin{eqnarray}\displaystyle & \displaystyle \tilde{e}=\frac{\tilde{U} ^{2}}{2}+{\it\varepsilon}^{2{\it\beta}}\frac{\tilde{h}^{2}\tilde{{\it\Psi}}}{2}+\frac{\tilde{h}}{2}+{\it\varepsilon}^{2}\frac{\dot{\tilde{h}}^{2}}{6}+{\it\varepsilon}^{2+{\it\beta}}\frac{\dot{\tilde{h}}}{\tilde{h}^{2}}\frac{\partial \tilde{A}}{\partial \tilde{x}}, & \displaystyle\end{eqnarray}$$
 $$\begin{eqnarray}\displaystyle & \displaystyle \tilde{P}=\frac{\tilde{h}^{2}}{2}+{\it\varepsilon}^{2{\it\beta}}\tilde{h}^{3}\tilde{{\it\Psi}}+{\it\varepsilon}^{2}\frac{\tilde{h}^{2}\ddot{\tilde{h}}}{3}+{\it\varepsilon}^{2+{\it\beta}}\left[\frac{\partial }{\partial \tilde{x}}\frac{\text{D}\tilde{A}}{\text{D}\tilde{t}}+2\tilde{A}\frac{\partial }{\partial \tilde{x}}\left(\frac{\dot{\tilde{h}}}{\tilde{h}}\right)\right]. & \displaystyle\end{eqnarray}$$
2.3.1. Values of
${\it\beta}$

To understand the respective orders of magnitude of all these terms, the value of
 ${\it\beta}$
has to be specified. We start from the expression of the vorticity, which, in this two-dimensional flow, has only one component:
 $$\begin{eqnarray}{\it\omega}=\frac{\partial u}{\partial z}-\frac{\partial w}{\partial x}.\end{eqnarray}$$
The Helmholtz equation of the vorticity leads to the conservation of the vorticity
 ${\it\omega}$
:
 $$\begin{eqnarray}\frac{\text{D}{\it\omega}}{\text{D}t}=0.\end{eqnarray}$$
We consider the case where the vorticity is initially small. Let us suppose that for
 $t=0$
,
 ${\it\omega}=O({\it\varepsilon}^{{\it\alpha}})$
where
 ${\it\alpha}>0$
. Then, owing to (2.50), the order of magnitude of
 ${\it\omega}$
is conserved and so, for any
 $t>0$
,
 ${\it\omega}=O({\it\varepsilon}^{{\it\alpha}})$
. The vorticity can thus be put in dimensionless form by
 $$\begin{eqnarray}\tilde{{\it\omega}}=\frac{{\it\omega}}{{\it\varepsilon}^{{\it\alpha}}}\frac{H}{V}.\end{eqnarray}$$
Consequently, the derivative of
 $u_{1}$
with respect to
 $z$
can be written as the sum of the vorticity and of the derivative of the vertical velocity
 $w$
with respect to
 $x$
. In dimensionless form, we have
 $$\begin{eqnarray}{\it\varepsilon}^{{\it\beta}}\frac{\partial \tilde{u} _{1}}{\partial \tilde{z}}=\underbrace{{\it\varepsilon}^{{\it\alpha}}\tilde{{\it\omega}}}_{rotational}+\underbrace{{\it\varepsilon}^{2}\frac{\partial \tilde{w}}{\partial \tilde{x}}}_{irrotational}.\end{eqnarray}$$
The second term in (2.52) exists even for potential flows and can be called the irrotational part. The velocity
 $u$
can vary with
 $z$
even if the flow is potential. On the other hand, the first term of the sum is due to the vorticity and represents the rotational part of the derivative of
 $u_{1}$
. The first term is always
 $O({\it\varepsilon}^{{\it\alpha}})$
, whereas the second term is always
 $O({\it\varepsilon}^{2})$
. The value of
 ${\it\beta}$
is thus
 $$\begin{eqnarray}{\it\beta}=\min ({\it\alpha},2).\end{eqnarray}$$
If
 ${\it\alpha}\geqslant 2$
, then
 ${\it\beta}=2$
. If
 ${\it\alpha}<2$
, then
 ${\it\beta}={\it\alpha}$
. In this latter case, the variation of
 $u_{1}$
with
 $z$
is mostly due to the vorticity, and the irrotational term can be neglected. We can then write, if
 ${\it\alpha}<2$
,
 $$\begin{eqnarray}\frac{\partial \tilde{u} _{1}}{\partial \tilde{z}}=\tilde{{\it\omega}}+O({\it\varepsilon}^{2-{\it\alpha}}).\end{eqnarray}$$
2.3.2. Classification of different models
It is now possible to discuss the various models that can be derived depending on the value of the order of magnitude of the vorticity and thus on the value of
 ${\it\beta}$
. If
 ${\it\beta}=0$
, the terms
 $\langle u_{1}^{2}\rangle$
and
 $\langle u_{1}^{3}\rangle$
are both
 $O(1)$
. Therefore,
 $\langle u_{1}^{3}\rangle$
cannot be neglected and the equations are not closed.
To close the system,
 ${\it\beta}$
has to be strictly greater than 0, i.e. the vorticity has to be small. If only the terms
 $O(1)$
are kept, then the system of equations reduces to the classical equations of Saint-Venant.
If
 $0<{\it\beta}<1$
, to order
 $O({\it\varepsilon}^{2{\it\beta}})$
, the system reduces to the equations derived by Teshukov (Reference Teshukov2007):
 $$\begin{eqnarray}\displaystyle & \displaystyle \frac{\partial h}{\partial t}+\frac{\partial hU}{\partial x}=0, & \displaystyle\end{eqnarray}$$
 $$\begin{eqnarray}\displaystyle & \displaystyle \frac{\partial hU}{\partial t}+\frac{\partial }{\partial x}\left[hU^{2}+h^{3}{\it\Psi}+\frac{gh^{2}}{2}\right]=0, & \displaystyle\end{eqnarray}$$
 $$\begin{eqnarray}\displaystyle & \displaystyle \frac{\partial he}{\partial t}+\frac{\partial }{\partial x}\left[hU\left(e+\frac{P}{h}\right)\right]=0, & \displaystyle\end{eqnarray}$$
 $$\begin{eqnarray}\displaystyle & \displaystyle e={\textstyle \frac{1}{2}}[U^{2}+gh+h^{2}{\it\Psi}], & \displaystyle\end{eqnarray}$$
 $$\begin{eqnarray}\displaystyle & \displaystyle P=\frac{gh^{2}}{2}+h^{3}{\it\Psi}. & \displaystyle\end{eqnarray}$$
 $h$
,
 $U$
and
 ${\it\Psi}$
. When shocks appear, the mass, momentum and energy equations then give the corresponding Rankine–Hugoniot relations. They allow us to determine the enstrophy jump across the shock. The right-hand side should be added into this system to dissipate the enstrophy jump (Richard & Gavrilyuk Reference Richard and Gavrilyuk2013).
If
 ${\it\beta}>1$
, then to order
 $O({\it\varepsilon}^{2})$
, the system reduces to the equations of Su & Gardner (Reference Su and Gardner1969) and Green & Naghdi (Reference Green and Naghdi1976). At this order of approximation, the velocity
 $u$
is considered as uniform over the fluid depth.
If
 ${\it\beta}=1$
, then all terms of (2.44)–(2.48) must be kept, including the term with
 $\langle u_{1}^{3}\rangle$
and the terms
 $O({\it\varepsilon}^{2+{\it\beta}})$
, which are all
 $O({\it\varepsilon}^{3})$
. The problem is closed if an equation for
 $\langle u_{1}^{3}\rangle$
is found. Such a closure is rigorously done in Castro & Lannes (Reference Castro and Lannes2014).
Finally, we consider in this paper the last case where
 $1<{\it\beta}<2$
. In particular, this implies that
 $3{\it\beta}>2+{\it\beta}$
. Consequently, if the terms
 $O({\it\varepsilon}^{2+{\it\beta}})$
are kept, the term
 $\langle u_{1}^{3}\rangle$
can be neglected.
2.3.3. The considered model
From here on, we will suppose that
 $1<{\it\beta}<2$
, and we will neglect all terms
 $O({\it\varepsilon}^{3{\it\beta}})$
and
 $O({\it\varepsilon}^{2+2{\it\beta}})$
. The full set of equations is thus
 $$\begin{eqnarray}\displaystyle & \displaystyle \frac{\partial h}{\partial t}+\frac{\partial hU}{\partial x}=0, & \displaystyle\end{eqnarray}$$
 $$\begin{eqnarray}\displaystyle & \displaystyle \frac{\partial hU}{\partial t}+\frac{\partial }{\partial x}[hU^{2}+P]=0, & \displaystyle\end{eqnarray}$$
 $$\begin{eqnarray}\displaystyle & \displaystyle \frac{\partial he}{\partial t}+\frac{\partial }{\partial x}\left[hU\left(e+\frac{P}{h}\right)+A\left(\frac{{\dot{h}}^{2}}{h^{2}}-\frac{\ddot{h}}{h}\right)\right]=0, & \displaystyle\end{eqnarray}$$
 $$\begin{eqnarray}\displaystyle & \displaystyle e=\frac{U^{2}}{2}+\frac{h^{2}{\it\Psi}}{2}+\frac{gh}{2}+\frac{{\dot{h}}^{2}}{6}+\frac{{\dot{h}}}{h^{2}}\frac{\partial A}{\partial x}, & \displaystyle\end{eqnarray}$$
 $$\begin{eqnarray}\displaystyle & \displaystyle P=\frac{gh^{2}}{2}+h^{3}{\it\Psi}+\frac{h^{2}\ddot{h}}{3}+\left[\frac{\partial }{\partial x}\frac{\text{D}A}{\text{D}t}+2A\frac{\partial }{\partial x}\left(\frac{{\dot{h}}}{h}\right)\right], & \displaystyle\end{eqnarray}$$
 $$\begin{eqnarray}\displaystyle & \displaystyle A=\int _{0}^{h}\frac{z^{2}}{2}u_{1}\;\text{d}z. & \displaystyle\end{eqnarray}$$
 $h$
, the average horizontal velocity
 $U$
and the enstrophy
 ${\it\Psi}$
. The three equations correspond to balance equations for mass (2.60), momentum (2.61) and energy (2.62). From these equations, it is possible to derive the following equation for the enstrophy
 ${\it\Psi}$
:
 $$\begin{eqnarray}\frac{\text{D}{\it\Psi}}{\text{D}t}=\frac{2A}{h^{3}}\frac{\partial }{\partial x}\left(\frac{\ddot{h}}{h}\right).\end{eqnarray}$$
Neglecting the terms
 $O({\it\varepsilon}^{2+{\it\beta}})$
in system (2.44)–(2.48) is equivalent to putting
 $A=0$
. However, if
 $A=0$
, (2.66) shows that the enstrophy is conserved, i.e. the enstrophy is simply transported by the mean flow. Since we are looking for turbulence generation, variation of enstrophy is needed. Consequently, the terms
 $O({\it\varepsilon}^{2+{\it\beta}})$
should not be neglected and
 $A\neq 0$
.
3. Shearing and turbulence
3.1. Decomposition of the velocity fluctuation
We have to distinguish between two kinds of fluctuations
 $u_{1}$
varying in
 $z$
: a fluctuation on a vertical length scale of approximately the order of magnitude of the depth
 $h$
, which we will call shearing, and a fluctuation on a vertical length scale much smaller than the depth
 $h$
, which we will call turbulence. The turbulent part of
 $u_{1}$
is thus a rapidly varying function with respect to
 $z$
. For example, one can take
 $u_{1}$
as
 $$\begin{eqnarray}u_{1}(x,z,t)=u_{1S}(x,z,t)+u_{1T}\left(x,\frac{z}{{\it\varepsilon}},t\right),\end{eqnarray}$$
where
 $u_{1S}$
is the shear fluctuation of the velocity and
 $u_{1T}$
is the turbulent fluctuation of the velocity. In particular,
 $u_{1T}$
can be taken as a periodic function of
 $z$
of period
 ${\it\varepsilon}$
.
This approach bears some resemblance to the classical approach to turbulence, in which the velocity is decomposed into a mean velocity, which varies slowly with time and space, and a turbulent fluctuation which varies quickly with time and space. This Reynolds decomposition leads to the well-known Reynolds equations, an approach followed by Antuono & Brocchini (Reference Antuono and Brocchini2013), who started from the Reynolds equations and then decomposed the slow part of the velocity into an averaged value over the fluid depth and a fluctuation, which includes the variation of the velocity on a vertical length scale of the order of magnitude of
 $h$
. In our approach, the decomposition between a slow variation and a fast one is done after averaging the Euler equations, whereas in Antuono & Brocchini (Reference Antuono and Brocchini2013), this decomposition is done from the beginning and the equations averaging over depth are the Reynolds equations.
Since
 $u_{1T}$
is an oscillating part on a very small wavelength
 $O({\it\varepsilon})$
, any integration of
 $\tilde{u} _{1T}$
over
 $\tilde{z}$
will give a result
 $O({\it\varepsilon})$
. In particular,
 $$\begin{eqnarray}\int _{0}^{\tilde{h}}\tilde{u} _{1T}\left(\tilde{x},\frac{\tilde{z}}{{\it\varepsilon}},\tilde{t}\right)\text{d}\tilde{z}=O({\it\varepsilon}).\end{eqnarray}$$
Since, by definition,
 $\langle \tilde{u} _{1}\rangle =0$
, it follows from (3.2) that
 $\langle \tilde{u} _{1S}\rangle =O({\it\varepsilon})$
. Another consequence is that the quantity
 $A$
is mainly due to
 $u_{1S}$
, the contribution from
 $u_{1T}$
being negligible:
 $$\begin{eqnarray}\tilde{A}=\int _{0}^{\tilde{h}}\frac{\tilde{z}^{2}}{2}\tilde{u} _{1S}\;\text{d}\tilde{z}+O({\it\varepsilon}).\end{eqnarray}$$
Physically, this means that
 $A$
depends on shearing and not on turbulence.
3.2. Decomposition of the enstrophy
This same decomposition of
 $u_{1}$
affects the enstrophy. A shear enstrophy, defined by
 $$\begin{eqnarray}{\it\Psi}_{S}=\frac{\langle u_{1S}^{2}\rangle }{h^{2}},\end{eqnarray}$$
can be distinguished from a turbulent enstrophy, which will also be denoted by
 ${\it\Phi}$
for simplicity,
 $$\begin{eqnarray}{\it\Phi}={\it\Psi}_{T}=\frac{\langle u_{1T}^{2}\rangle }{h^{2}}.\end{eqnarray}$$
It is worth noting that
 ${\it\Psi}_{T}$
has a priori the same order of magnitude as
 ${\it\Psi}_{S}$
. Another point is that
 $\langle \tilde{u} _{1S}\tilde{u} _{1T}\rangle =O({\it\varepsilon})$
, which means that
 $\langle u_{1S}u_{1T}\rangle$
is negligible.
The quantity
 ${\it\Phi}$
is of particular relevance in the study of turbulence generation. A turbulent energy can be defined as
 $$\begin{eqnarray}e_{T}=\frac{h^{2}{\it\Phi}}{2}.\end{eqnarray}$$
3.3. The irrotational case
We now consider the irrotational case. Thus,
 $$\begin{eqnarray}\frac{\partial u_{1}}{\partial z}\simeq \frac{\partial w}{\partial x}.\end{eqnarray}$$
Consequently,
 $$\begin{eqnarray}\tilde{u} _{1}(\tilde{z})=\frac{1}{2}\left(\tilde{z}^{2}-\frac{\tilde{h}^{2}}{3}\right)\frac{\partial }{\partial \tilde{x}}\left(\frac{\dot{\tilde{h}}}{\tilde{h}}\right)+O({\it\varepsilon}^{2}).\end{eqnarray}$$
The expression of
 $A$
is thus
 $$\begin{eqnarray}A=\frac{h^{5}}{45}\frac{\partial }{\partial x}\left(\frac{{\dot{h}}}{h}\right)\end{eqnarray}$$
and the expression of
 ${\it\Psi}_{S}$
is
 $$\begin{eqnarray}{\it\Psi}_{S}=\frac{h^{2}}{45}\left(\frac{\partial }{\partial x}\frac{{\dot{h}}}{h}\right)^{2}\end{eqnarray}$$
(a similar expression was found by Su & Gardner Reference Su and Gardner1969). In this case, calculating the turbulent enstrophy by
 $$\begin{eqnarray}\frac{\text{D}{\it\Phi}}{\text{D}t}=\frac{\text{D}{\it\Psi}}{\text{D}t}-\frac{\text{D}{\it\Psi}_{S}}{\text{D}t},\end{eqnarray}$$
with (2.66) and the expressions of
 $A$
and
 ${\it\Psi}_{S}$
above, we get
 $$\begin{eqnarray}\frac{\text{D}{\it\Phi}}{\text{D}t}=0.\end{eqnarray}$$
No turbulence can be generated in an irrotational flow. Vorticity must be present in order to create a turbulent structure. For this reason, we will consider thereafter only the case where the vorticity term is predominant, i.e. the case
 ${\it\beta}<2$
.
3.4. The rotational case
3.4.1. Expression of
$A$

By neglecting the irrotational part, we get
 $$\begin{eqnarray}{\it\omega}\simeq \frac{\partial u_{1}}{\partial z},\end{eqnarray}$$
where
 ${\it\omega}$
is the vorticity. The problem now is to know the function
 ${\it\omega}(z)$
. For example, if the vorticity is constant in the fluid layer, this leads to
 $$\begin{eqnarray}A=A_{0}h^{4},\quad A_{0}=\frac{{\it\omega}}{24}.\end{eqnarray}$$
Consider now a more realistic case where the flow is irrotational except in a thin boundary layer of thickness
 ${\it\delta}\ll h$
, where the vorticity is constant:
 $$\begin{eqnarray}\displaystyle & \displaystyle \frac{\partial u}{\partial z}={\it\omega}\quad \text{for}~0<z<{\it\delta}, & \displaystyle\end{eqnarray}$$
 $$\begin{eqnarray}\displaystyle & \displaystyle \frac{\partial u}{\partial z}=0\quad \text{for}~{\it\delta}<z<h. & \displaystyle\end{eqnarray}$$
 $A$
can easily be found:
 $$\begin{eqnarray}A\simeq \frac{{\it\omega}{\it\delta}^{2}h^{2}}{12}.\end{eqnarray}$$
Assuming that the development of the boundary layer is slow and thus negligible on the length of the wave, i.e. that
 ${\it\delta}$
is constant, the expression of
 $A$
becomes
 $A_{0}h^{2}$
, where
 $A_{0}$
is a constant. Note that the sign of
 $A_{0}$
is the sign of
 ${\it\omega}$
. For the same vorticity distribution, the shear enstrophy is
 $$\begin{eqnarray}{\it\Psi}_{S}\simeq \frac{{\it\omega}^{2}{\it\delta}^{3}}{3h^{3}}.\end{eqnarray}$$
For a non-developed flow and
 ${\it\delta}\ll h$
, we can neglect
 ${\it\Psi}_{S}$
.
A more interesting description of the vorticity distribution is the case where there is not only a thin boundary layer at the bottom but also a thin layer with a strong vorticity at the air–water interface (see Dabiri & Gharib Reference Dabiri and Gharib1997 for a description of such a layer just before a spilling water wave). This can be modelled by the following vorticity distribution:
 $$\begin{eqnarray}\displaystyle & {\it\omega}={\it\omega}_{1}\quad \text{for}~0<z<{\it\delta}_{1}, & \displaystyle\end{eqnarray}$$
 $$\begin{eqnarray}\displaystyle & {\it\omega}=0\quad \text{for}~{\it\delta}_{1}<z<h-{\it\delta}_{2}, & \displaystyle\end{eqnarray}$$
 $$\begin{eqnarray}\displaystyle & {\it\omega}={\it\omega}_{2}\quad \text{for}~h-{\it\delta}_{2}<z<h, & \displaystyle\end{eqnarray}$$
 ${\it\delta}_{1}\ll h$
and
 ${\it\delta}_{2}\ll h$
and with
 ${\it\omega}_{1}$
,
 ${\it\omega}_{2}$
,
 ${\it\delta}_{1}$
and
 ${\it\delta}_{2}$
constant. This leads to the following approximate expression of
 $A$
:
 $$\begin{eqnarray}A\simeq \frac{h^{2}}{12}({\it\omega}_{1}{\it\delta}_{1}^{2}+2{\it\omega}_{2}{\it\delta}_{2}^{2}).\end{eqnarray}$$
Denoting
 $A_{0}=({\it\omega}_{1}{\it\delta}_{1}^{2}+2{\it\omega}_{2}{\it\delta}_{2}^{2})/12$
, we can write
 $$\begin{eqnarray}A=A_{0}h^{2}.\end{eqnarray}$$
The shear enstrophy is
 $$\begin{eqnarray}{\it\Psi}_{S}\simeq \frac{{\it\omega}_{1}^{2}{\it\delta}_{1}^{3}+{\it\omega}_{2}^{2}{\it\delta}_{2}^{3}}{3h^{3}}\end{eqnarray}$$
and is also negligible.
3.4.2. Conservative form of the enstrophy equation
The expression of
 $A$
in the form
 $A=A_{0}h^{2}$
, where
 $A_{0}$
is a constant, has some physical support as explained above. It is also the simplest mathematical expression for
 $A$
since it allows us to write the equation of the enstrophy in conservative form:
 $$\begin{eqnarray}\frac{\partial h{\it\Psi}}{\partial t}+\frac{\partial }{\partial x}\left(hU{\it\Psi}-2A_{0}\frac{\ddot{h}}{h}\right)=0.\end{eqnarray}$$
Of course, (3.25) is true in the absence of dissipation. From now on, we will assume the expression of
 $A$
given by (3.23). Further, we will assume that the shear enstrophy is negligible, i.e. that
 $$\begin{eqnarray}{\it\Psi}\simeq {\it\Phi},\end{eqnarray}$$
where
 ${\it\Phi}$
is the turbulent enstrophy. The flux in (3.25) contains an additional term depending on the surface acceleration and the velocity shear. It allows us to create the turbulent enstrophy even if it was initially absent.
4. Solitary wave propagation
4.1. Physical description
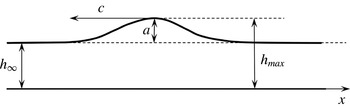
We consider a solitary wave propagating with a negative celerity
 $c$
in the direction of decreasing
 $x$
in still water of depth
 $h_{\infty }$
. The amplitude
 $a$
of the wave is defined as
 $$\begin{eqnarray}a=h_{max}-h_{\infty },\end{eqnarray}$$
where
 $h_{max}$
is the maximum depth that is reached under the wave crest (see figure 2). This solitary wave will be studied in a reference frame propagating at the same velocity
 $c$
as the wave. In this reference frame, the solitary wave is stationary. For
 $x\rightarrow -\infty$
or
 $x\rightarrow +\infty$
, the depth is
 $h_{\infty }$
and the fluid velocity is
 $U_{\infty }=-c>0$
. Also, the bottom wall moves in this reference frame with the velocity
 $U_{\infty }$
. We choose, in this reference frame,
 $x=0$
at the wave crest.
Notation used for the description of the solitary wave.

We can note that there is a similarity between the propagation of a bore and that of a solitary wave, in that in both cases the fluid is initially quiescent and thus irrotational, and that the vorticity is created at the wavefront. The similarity between weak hydraulic jumps and spilling breakers in the inner surf-zone in a reference frame moving with the broken wave has been highlighted, for example, by Dabiri & Gharib (Reference Dabiri and Gharib1997) and Misra et al. (Reference Misra, Kirby, Brocchini, Veron, Thomas and Kambhamettu2008).
Of course, because of friction at the bottom, vorticity is generated as soon as the wave comes, in a thin boundary layer (the flow can be considered as non-developed). However, if a turbulent structure appears, it appears in the upper part of the flow and the vorticity at the bottom can hardly explain the phenomenon.
Dabiri & Gharib (Reference Dabiri and Gharib1997) investigated experimentally the vorticity generation within a spilling water wave. They concluded also that the spilling breaker can be modelled as a local hydraulic jump. They found that the source of vorticity is mainly due to the free-surface deceleration. According to them, ‘the free-surface deceleration not only produces a vorticity flux into the flow through a diffusive process, but in doing so, simultaneously generates a sharp slip velocity which grows into a shear layer, convecting downstream the vorticity which is fluxed into the fluid from the free surface’. They also pointed out that ‘the location of maximum deceleration, and therefore the flux of vorticity into the flow, are clearly distinguishable from the location of the stagnation point along the free surface and the onset of separation from the surface’ (note that the stagnation point indicates the breaking of the wave).
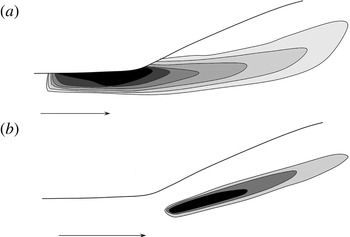
Similar results were found experimentally by Misra et al. (Reference Misra, Kirby, Brocchini, Veron, Thomas and Kambhamettu2008) on a weak hydraulic jump. They wrote that ‘all evidence suggests that breaking is driven by a surface-parallel adverse pressure gradient and a streamwise flow deceleration at the toe of the breaker’ and that ‘the flow characteristics, particularly near the toe and the free surface, depend significantly on the inflow characteristics’. They found that ‘there is a thin concentrated region of negative vorticity in the breaker shear layer’ but that ‘the mean vorticity has its peak, negative value, upstream of the toe … and decreases in the downstream direction’. They noticed that they found a non-zero vorticity at the mean surface. Further, their measurements show that the maximum vorticity is at the free surface, upstream of the jump’s toe, whereas the maximum turbulent energy is at the toe of the breaker. The turbulence structure of the breaker shear layer resembles that of a mixing layer originating from the toe of the breaker. From this point, the turbulence intensity decays rapidly away (Misra et al. Reference Misra, Kirby, Brocchini, Veron, Thomas and Kambhamettu2008). The turbulent energy in the reverse-flow region above the shear layer of the breaker is an order of magnitude smaller than in the shear layer (Misra et al. Reference Misra, Kirby, Brocchini, Veron, Thomas and Kambhamettu2008). Figure 3 shows a sketch of the strong vorticity areas and of the strong turbulent energy areas in the weak hydraulic jump studied by Misra et al. (Reference Misra, Kirby, Brocchini, Veron, Thomas and Kambhamettu2008).
(a) Sketch of the averaged vorticity for a weak hydraulic jump (after Misra et al. Reference Misra, Kirby, Brocchini, Veron, Thomas and Kambhamettu2008) in the upper portion of the flow. The upstream Froude number is 1.2. Darker areas indicate a stronger vorticity. Maximum vorticity is found before the toe of the jump. (b) Sketch of the turbulent kinetic energy in this same hydraulic jump (after Misra et al. Reference Misra, Kirby, Brocchini, Veron, Thomas and Kambhamettu2008). Darker areas indicate a larger turbulence intensity.

Finally, it appears that a strong vorticity is generated along the air–water interface. With our choice of the reference frame moving with the wave, this vorticity is negative. For our model, this implies a non-zero, negative value of
 $A$
before the wave. It can be easily proved that if
 $\partial u_{1}/\partial z>0$
then
 $A>0$
, and that if
 $\partial u_{1}/\partial z<0$
then
 $A<0$
. As we assumed
 $\partial u_{1}/\partial z={\it\omega}$
, the sign of
 ${\it\omega}$
is the sign of
 $A$
. Note that, in our case, the vorticity at the thin bottom boundary layer is also negative and that above this boundary layer but beneath the upper shear layer at the air–water interface, the vorticity is very small and can be considered equal to zero. We can model this as (3.19)–(3.21) (see § 3.4.1) and take the expression (3.23) for
 $A$
with
 $A_{0}<0$
. The fact that the maximum of the turbulent energy appears after the maximum of the vorticity is an argument in favour of a generation of turbulent enstrophy
 ${\it\Phi}$
caused by the presence of vorticity implied by the non-zero value of
 $A$
. The shear vorticity in the thin layer close to the air–water interface can be partially transformed into turbulent vorticity related to rapidly varied motions.
4.2. Explicit expression of the wave profile
Let us consider solutions of (2.60)–(2.64) with (3.23) depending only on
 ${\it\xi}=x-ct$
. Since these equations are Galilean invariant, it is equivalent to looking for stationary solutions. Thus, the balance equation for mass leads to the conservation of the discharge
 $q$
:
 $$\begin{eqnarray}q=hU=\text{constant}.\end{eqnarray}$$
Instead of (2.62), we can take (3.25) with the approximation (3.26). This gives in the stationary case
 $$\begin{eqnarray}{\it\Phi}={\it\varphi}+\frac{2A_{0}q}{h^{3}}\left[\frac{\text{d}^{2}h}{\text{d}x^{2}}-\frac{1}{h}\left(\frac{\text{d}h}{\text{d}x}\right)^{2}\right],\end{eqnarray}$$
where
 ${\it\varphi}={\it\Phi}_{\infty }$
is the turbulent enstrophy far from the wave (for
 $x\rightarrow \pm \infty$
). In fact,
 ${\it\varphi}$
should be zero as the fluid is initially quiescent, but a very small value of
 ${\it\Phi}$
is generated immediately by the wave, whether at the bottom boundary layer due to friction or at the air–water interface.
The equations are put in dimensionless form as in (2.8) and (2.26) with
 $H=h_{\infty }$
. Further,
 $\tilde{x}=x/h_{\infty }$
and the Froude number is defined as
 $$\begin{eqnarray}F=q/\sqrt{gh_{\infty }^{3}}.\end{eqnarray}$$
We can also write this Froude number as
 $F=U_{\infty }/\sqrt{gh_{\infty }}$
or
 $F=|c|/\sqrt{gh_{\infty }}$
. It is the dimensionless wave velocity. We also have
 $$\begin{eqnarray}\tilde{A}_{0}=\frac{A_{0}}{\sqrt{gh_{\infty }^{3}}}.\end{eqnarray}$$
The integration of this system gives an explicit dimensionless expression for the solitary wave,
 $$\begin{eqnarray}\tilde{h}=1+\frac{2\tilde{a}(F^{2}-1-3\tilde{{\it\varphi}})}{F^{2}-1-(3+\tilde{a}^{2})\tilde{{\it\varphi}}+[F^{2}-1-(3-\tilde{a}^{2})\tilde{{\it\varphi}}]\,\text{ch}\left[\tilde{x}\sqrt{3{\displaystyle \frac{F^{2}-1-3\tilde{{\it\varphi}}}{F^{2}+18\tilde{A}_{0}F}}}\right]},\end{eqnarray}$$
where
 $\tilde{a}=a/h_{\infty }$
is the dimensionless amplitude of the solitary wave. It is obvious from this expression that a solitary wave can only exist if
 $$\begin{eqnarray}F>\sqrt{1+3\tilde{{\it\varphi}}}.\end{eqnarray}$$
For the Green–Naghdi model, this condition was simply
 $F>1$
. In our model, the long wave velocity
 $\sqrt{gh}$
has to be replaced by
 $\sqrt{gh+3h^{2}{\it\Psi}}$
(Teshukov Reference Teshukov2007; Richard & Gavrilyuk Reference Richard and Gavrilyuk2012). The Froude number, which is the ratio of the fluid velocity to the long wave velocity, has to be replaced by the generalized Froude number
 $$\begin{eqnarray}F_{g}=\frac{U}{\sqrt{gh+3h^{2}{\it\Psi}}}.\end{eqnarray}$$
The condition of existence for solitary waves is simply
 $F_{g}>1$
.
The expression of the dimensionless amplitude of the solitary wave is
 $$\begin{eqnarray}\tilde{a}=\frac{1}{2\tilde{{\it\varphi}}}\left[-(1+4\tilde{{\it\varphi}})+\sqrt{(1+4\tilde{{\it\varphi}})^{2}+4(F^{2}-1-3\tilde{{\it\varphi}})\tilde{{\it\varphi}}}\right].\end{eqnarray}$$
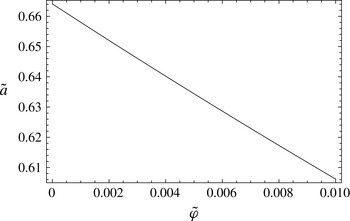
This amplitude decreases if
 $\tilde{{\it\varphi}}$
increases (see figure 4). It is always smaller than the amplitude of the solitary wave in the Green–Naghdi model, which is
 $\tilde{a}=F^{2}-1$
. For a non-developed flow, the order of magnitude of
 $\tilde{{\it\varphi}}$
is
 $5\times 10^{-3}$
(see Richard & Gavrilyuk Reference Richard and Gavrilyuk2013). Therefore, assuming a small value for
 $\tilde{{\it\varphi}}$
,
 $\tilde{a}$
can be developed and the following approximate expression of
 $\tilde{a}$
can be found:
 $$\begin{eqnarray}\tilde{a}=F^{2}-1-\tilde{{\it\varphi}}F^{2}(2+F^{2})+2\tilde{{\it\varphi}}^{2}F^{2}(2+3F^{2}+F^{4})+O(\tilde{{\it\varphi}}^{3}).\end{eqnarray}$$
The amplitude of the solitary wave of Boussinesq is also
 $\tilde{a}=F^{2}-1$
. The solitary waves of the Korteweg–de Vries equation have an amplitude
 $\tilde{a}=2(F-1)$
. Grimshaw (Reference Grimshaw1971) found
 $F=\sqrt{1+\tilde{a}-\tilde{a}^{2}/20-3\tilde{a}^{3}/70}$
. It is well known that the celerity of the solitary wave found by Boussinesq or by Su & Gardner (Reference Su and Gardner1969) (Green–Naghdi model), and even more by the Korteweg–de Vries equation, is slightly higher than the experimental values (Daily & Stephan Reference Daily and Stephan1952), especially for solitary waves of high amplitude (
 $\tilde{a}>0.5$
). On the other hand, the expression of Grimshaw (Reference Grimshaw1971) is in very good agreement with the experimental values. Since the value of
 $F$
that we found for a given amplitude is slightly higher than the value given by the Green–Naghdi model because of
 $\tilde{{\it\varphi}}$
, the result we found is also slightly worse than the Green–Naghdi model with respect to the relation between the wave celerity and its amplitude. We currently believe that this discrepancy is due to the irrotational term, which was neglected since the inclusion of higher-order terms leads to an improvement of this relation (for example Grimshaw Reference Grimshaw1971; Fenton Reference Fenton1972; Shields & Webster Reference Shields and Webster1988 and, specifically for the irrotational Green–Naghdi model, Kim et al.
Reference Kim, Bai, Ertekin and Webster2003).
Variation of the dimensionless amplitude
 $\tilde{a}$
of the solitary wave with
 $\tilde{{\it\varphi}}$
for
 $F=1.29$
.

Experimental profiles of solitary waves have been found by various authors, notably by Daily & Stephan (Reference Daily and Stephan1952). They compared the experimental profiles to theoretical profiles, especially the profile found by Boussinesq (Reference Boussinesq1872),
 $$\begin{eqnarray}\tilde{h}=1+\tilde{a}\;\text{sec}\text{h}^{2}\left(\tilde{x}\sqrt{{\textstyle \frac{3}{4}}\tilde{a}}\right),\end{eqnarray}$$
and the profile found by Rayleigh (1876), which has the same expression as the profile found by Su & Gardner (Reference Su and Gardner1969)
 $$\begin{eqnarray}\tilde{h}=1+\tilde{a}\;\text{sec}\text{h}^{2}\left(\tilde{x}\sqrt{\frac{3}{4}\frac{\tilde{a}}{1+\tilde{a}}}\right).\end{eqnarray}$$
They concluded that the Boussinesq profile gives the most consistent agreement with the experimental values.
It can be noted that, if
 $\tilde{{\it\varphi}}=0$
, the profile found (4.6) reduces to
 $$\begin{eqnarray}\tilde{h}=1+\tilde{a}\;\text{sec}\text{h}^{2}\left[\tilde{x}\sqrt{\frac{3}{4}\;\frac{\tilde{a}}{1+\tilde{a}+18\tilde{A}_{0}\sqrt{\tilde{a}+1}}}\right].\end{eqnarray}$$
Further, if
 $\tilde{A}_{0}=0$
, this profile reduces to the Rayleigh and Su–Gardner profile. On the other hand, if
 $$\begin{eqnarray}\tilde{A}_{0}=-\frac{\tilde{a}}{18\sqrt{\tilde{a}+1}},\end{eqnarray}$$
the profile we found reduces to the Boussinesq profile. If
 $\tilde{{\it\varphi}}=0$
, the amplitude (4.9) becomes simply
 $\tilde{a}=F^{2}-1$
. Hence, this condition (4.14) can also be written as
 $$\begin{eqnarray}\tilde{A}_{0}=\frac{1-F^{2}}{18F}.\end{eqnarray}$$
Our goal here is to handle turbulence generation rather than to fit the experimental profiles. For the latter task, the irrotational term has to be taken into account. However, this model is able to give profiles in very good agreement with the experimental profiles. As was discussed previously, we take the expression (3.23) with
 $\tilde{A}_{0}<0$
. We could adjust the value of
 $\tilde{A}_{0}$
in order to get the best agreement with the experimental profiles. As we only need an approximate value of
 $\tilde{A}_{0}$
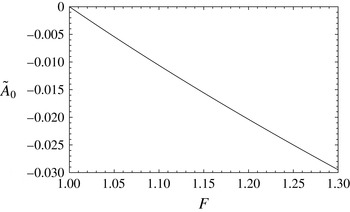
for our goal, we will use (4.15) in order to get the Boussinesq profile, which has already been found to be in good agreement with the experiments. The values of
 $\tilde{A}_{0}$
are plotted in figure 5 as a function of
 $F$
.
Values of
 $\tilde{A}_{0}$
as a function of the Froude number
 $F$
from (4.15).

With the value of
 $\tilde{A}_{0}$
and
 $\tilde{{\it\varphi}}$
, the profile can be derived from (4.6). It is then possible to solve (4.3) to find the evolution of the enstrophy in the wave. Starting from
 $\tilde{{\it\varphi}}$
for
 $\tilde{x}\rightarrow -\infty$
, the enstrophy first decreases and then increases to a value greater than
 $\tilde{{\it\varphi}}$
which is maximum for
 $\tilde{x}=0$
, then follows a symmetrical behaviour for
 $\tilde{x}>0$
. If
 $\tilde{{\it\varphi}}$
is too small, the enstrophy can become negative, which is of course not possible. If
 $\tilde{{\it\varphi}}$
has a greater value, the curve of
 $\tilde{{\it\Phi}}$
as a function of
 $\tilde{x}$
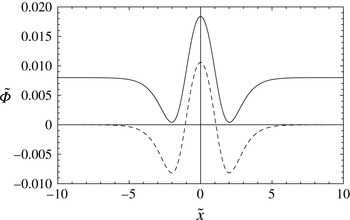
is simply translated towards higher values of
 $\tilde{{\it\Phi}}$
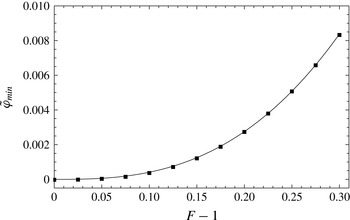
, as shown in figure 6. The minimal value of
 $\tilde{{\it\varphi}}$
which guarantees a positive value of
 $\tilde{{\it\Phi}}$
as a function of the Froude number can then be found. This expression is not explicit, even if the corresponding numerical procedure for finding
 $\tilde{{\it\varphi}}_{min}$
is simple. These values are plotted in figure 7.
Profiles of the enstrophy in a solitary wave as a function of
 $\tilde{x}$
for
 $F=1.29$
if
 $\tilde{{\it\varphi}}=0$
(dashed curve) and if
 $\tilde{{\it\varphi}}=0.008$
(solid line). In each case,
 $\tilde{A}_{0}$
is found with (4.15), which gives
 $\tilde{A}_{0}=-0.0286$
.

Values of the minimal value of
 $\tilde{{\it\varphi}}$
as a function of
 $F-1$
.

The numerical values of
 $\tilde{{\it\varphi}}_{min}$
are of the same order of magnitude as those estimated in Richard & Gavrilyuk (Reference Richard and Gavrilyuk2013) for hydraulic jumps with a non-developed inflow. Knowing
 $\tilde{A}_{0}$
with (4.15) and taking the corresponding value as
 $\tilde{{\it\varphi}}=\tilde{{\it\varphi}}_{min}$
, it is possible to calculate the profiles of solitary waves and to find the relation between the dimensionless wave celerity
 $F$
and the dimensionless wave amplitude
 $\tilde{a}$
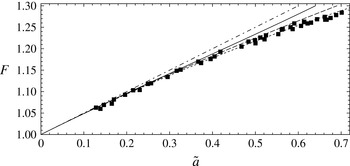
. The relation between
 $F$
and
 $\tilde{a}$
is plotted in figure 8 and compared with experimental results from Watanabe (Reference Watanabe2007) and other theoretical solutions. The solution of Grimshaw (Reference Grimshaw1971) is in very good agreement with the experimental results. The other solutions overestimate the celerity for a given amplitude, or, equivalently, underestimate the amplitude for a given Froude number. The expressions of Boussinesq and Rayleigh (Su–Gardner, Green–Naghdi model) are in good agreement with the experiments for
 $\tilde{a}<0.5$
. Our solution gives higher wave velocities and is in good agreement with the measurements for
 $\tilde{a}<0.4$
. The Korteweg–de Vries equation gives the right value of the wave celerity only for small-amplitude waves (as expected), for
 $\tilde{a}<0.2$
. Our result falls between the Green–Naghdi model and the Korteweg–de Vries equation.
Relation between the dimensionless wave velocity
 $F$
and the dimensionless wave amplitude
 $\tilde{a}$
. Squares, experimental measures of Watanabe (Reference Watanabe2007); solid line, our result with (4.15),
 $\tilde{{\it\varphi}}=\tilde{{\it\varphi}}_{min}$
; long dashed line, Boussinesq and Rayleigh (and also Su & Gardner Reference Su and Gardner1969, Green–Naghdi model) solutions; short dashed line, solution of Grimshaw (Reference Grimshaw1971); dot-dashed line, solution of the Korteweg–de Vries equation.

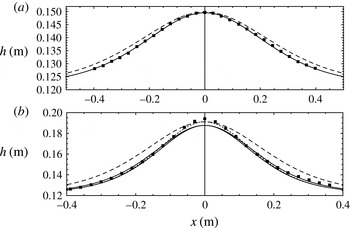
The calculated profiles of solitary waves are then compared to experimental results obtained by Daily & Stephan (Reference Daily and Stephan1952). Two cases are presented in figure 9. The first one is a case of a small-amplitude wave with
 $F=1.11$
and
 $\tilde{a}=0.23$
. The value of
 $\tilde{A}_{0}$
is
 $-0.0116$
and
 $\tilde{{\it\varphi}}=0.000533$
. The profile we obtained is in very good agreement with the experimental profile and is an improvement on the Rayleigh profile. It is nearly identical to the Boussinesq profile by the choice of (4.15). The second case is that of a large-amplitude wave with
 $F=1.25$
and
 $\tilde{a}=0.6$
. The profile was calculated with
 $\tilde{A}_{0}=-0.0252$
and
 $\tilde{{\it\varphi}}=0.00519$
. The calculated profile is also an improvement on the Rayleigh profile except near the maximum depth of the wave, which is not sharp enough. Apart from the top region of the wave, the profile is in good agreement with the experiment. The calculated profile is better than the profile found with the Green–Naghdi model everywhere except in the area of the top of the wave. In particular, the width of the solitary wave, which is slightly too wide with the Green–Naghdi model, is in much better agreement with our model. The top area of the wave is likely to be improved in our model by the inclusion of the irrotational term, as noted above from the results obtained by various authors, especially Kim et al. (Reference Kim, Bai, Ertekin and Webster2003). The profile could even be improved by a choice of
 $\tilde{A}_{0}$
different from (4.15). For example,
 $\tilde{A}_{0}=-0.020$
gives even better results (but the top region is not improved). The value of
 $\tilde{A}_{0}$
, does not change the wave amplitude, which depends only on
 $F$
and
 $\tilde{{\it\varphi}}$
, but modifies the width of the wave. With
 $\tilde{A}_{0}>0$
, the solitary wave is wider by comparison with the Rayleigh solitary wave profile, and with
 $\tilde{A}_{0}<0$
it is narrower. For all values of
 $F$
, the Rayleigh profile is slightly too wide. With
 $\tilde{A}_{0}<0$
, the profile is closer to the experimental profile, except at the top region of the largest waves.
Profiles of solitary waves. (a) Small-amplitude wave with
 $F=1.11$
,
 $\tilde{a}=0.23$
. Squares, experimental measures of Daily & Stephan (Reference Daily and Stephan1952); solid line, calculated profile with
 $\tilde{A}_{0}=-0.0116$
and
 $\tilde{{\it\varphi}}=0.000533$
; dashed line, Rayleigh profile (also Su & Gardner Reference Su and Gardner1969). (b) Large-amplitude wave with
 $F=1.25$
and
 $\tilde{a}=0.6$
. Squares, experimental measures of Daily & Stephan (Reference Daily and Stephan1952); thick solid line, calculated profile with
 $\tilde{A}_{0}=-0.0252$
and
 $\tilde{{\it\varphi}}=0.00519$
; thin solid line, calculated profile with
 $\tilde{A}_{0}=-0.020$
and
 $\tilde{{\it\varphi}}=0.00519$
; long dashed line, Rayleigh profile (also Su & Gardner Reference Su and Gardner1969); short dashed line, Boussinesq profile.

The explicit stationary solution was found with
 $A=A_{0}h^{2}$
. It is worth noting that stationary solitary wave solutions exist for any dependence of
 $A$
on
 $h$
, even if they are not explicit. In this general case, the equation for the fluid depth is
 $$\begin{eqnarray}-\left(\frac{q^{2}}{3}+\frac{4qA}{h^{2}}\right)\frac{\text{d}^{2}}{\text{d}x^{2}}\left(\frac{1}{h}\right)+\frac{\text{d}}{\text{d}x}\left(\frac{q}{h^{3}}\frac{\text{d}A}{\text{d}x}\right)=\frac{3m}{h^{2}}-\frac{2b}{h}-\frac{2q^{2}}{h^{3}}+\frac{g}{2},\end{eqnarray}$$
where
 $m$
and
 $b$
are the constants
 $$\begin{eqnarray}\displaystyle & \displaystyle m=\frac{q^{2}}{h_{\infty }}+\frac{gh_{\infty }^{2}}{2}+h_{\infty }^{3}{\it\varphi}, & \displaystyle\end{eqnarray}$$
 $$\begin{eqnarray}\displaystyle & \displaystyle b=\frac{q^{2}}{2h_{\infty }^{2}}+gh_{\infty }+\frac{3}{2}h_{\infty }^{2}{\it\varphi}. & \displaystyle\end{eqnarray}$$
 $A=A_{0}h^{2}$
.
4.3. Turbulence generation
Having determined the values of
 $\tilde{A}_{0}$
and
 $\tilde{{\it\varphi}}$
, the variations of the turbulent enstrophy can now be calculated in order to study the generation of turbulence. The experimental maximum value of the dimensionless amplitude of a solitary wave is related to the breaking of the wave. For a breaking wave, not only is there a turbulent structure but also the wave profile becomes asymmetric, and there is dissipation producing a decrease in both the amplitude and the velocity of the wave. McCowan (Reference McCowan1894) predicted a maximum dimensionless amplitude of
 $\tilde{a}=0.78$
, which is slightly higher than the experimental value measured by Watanabe (Reference Watanabe2007) of
 $\tilde{a}=0.70$
. The experimental maximum dimensionless velocity is
 $F=1.29$
(Watanabe Reference Watanabe2007). The determination of the value of the maximum wave amplitude assumes that the velocity of a particle at the crest is equal to the velocity of the wave, and that the free surface forms a point at the crest with an angle of
 $2{\rm\pi}/3$
. However, Watanabe (Reference Watanabe2007) observed no overturning of the wave crest above the critical value of the amplitude but the appearance of a turbulent structure of a micro type (micro instability).
The calculation of the variation of enstrophy with
 $\tilde{x}$
shows that the value of the enstrophy reached a maximum at the peak of the wave. This maximum increases with the Froude number
 $F$
. It was shown in Richard & Gavrilyuk (Reference Richard and Gavrilyuk2013) that the disappearance of the roller of a hydraulic jump can be related to a critical value of the dimensionless enstrophy. This threshold was found to be in very good agreement with experimental measures of the roller length of hydraulic jumps at any upstream Froude number. In the present case of the solitary wave, we propose that the onset of the instability of the wave, i.e. the breaking of the wave, is related to the crossing of a threshold by the enstrophy. As long as the enstrophy is smaller than a critical value, the solitary wave is stable and no turbulent structure appears. If the value of the enstrophy becomes greater than this critical value, the wave breaks and dissipation appears, which makes the wave asymmetric and unstable.
This critical value of the enstrophy can be estimated by the maximum value reached by
 $\tilde{{\it\Phi}}-\tilde{{\it\varphi}}$
at the critical Froude number of
 $F=1.29$
. As usual,
 $\tilde{A}_{0}$
is given by (4.15), and
 $\tilde{{\it\varphi}}$
corresponds to
 $\tilde{{\it\varphi}}_{min}$
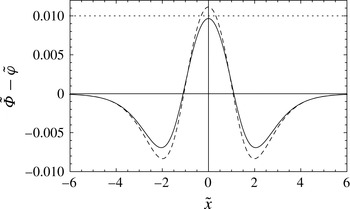
. In figure 10, the variation of
 $\tilde{{\it\Phi}}-\tilde{{\it\varphi}}$
is plotted in the case of a stable solitary wave with
 $F=1.28$
, just below the critical value, and in the case of an unstable wave with
 $F=1.30$
, slightly above the critical value. The critical value of
 $\tilde{{\it\Phi}}-\tilde{{\it\varphi}}$
is approximately 0.010. It is also possible to look for a critical value of
 $\tilde{{\it\Phi}}$
instead of
 $\tilde{{\it\Phi}}-\tilde{{\it\varphi}}$
, in which case a value close to 0.018 is found.
Variations of the dimensionless enstrophy
 $\tilde{{\it\Phi}}-\tilde{{\it\varphi}}$
in the solitary wave as a function of
 $\tilde{x}$
. Solid line, case
 $F=1.28$
,
 $\tilde{A}_{0}=-0.0277$
,
 $\tilde{{\it\varphi}}=0.00692$
; dashed line, case
 $F=1.30$
,
 $\tilde{A}_{0}=-0.0295$
,
 $\tilde{{\it\varphi}}=0.00837$
; dotted horizontal line,
 $\tilde{{\it\Phi}}-\tilde{{\it\varphi}}=0.010$
.

Once breaking is reached, dissipation effects appear that are not included in the present model. It is thus not possible to describe these breaking waves without having introduced the dissipation in the equations. We believe that the present model is able to predict the onset of breaking but that it has to be augmented to handle the case of breaking waves. The dissipative terms included in Richard & Gavrilyuk (Reference Richard and Gavrilyuk2013) are likely to be included in the future dissipative and dispersive model for breaking waves.
5. Conclusion
We derived a dispersive model of shear shallow water flows over a horizontal bottom. The distinction between a rapidly varying part of the velocity and a slowly varying part allows us to distinguish between turbulence and shearing. This model can predict the appearance of turbulence through the variation of the turbulent enstrophy. The turbulent enstrophy generation is due to a second-order moment of the velocity fluctuation
 $A$
related to the presence of vorticity in the flow. If the flow is assumed to be irrotational, then no turbulence can appear. The distribution of vorticity was modelled with some assumptions supported by experimental works. It gives the simple expression
 $A=A_{0}h^{2}$
, where
 $A_{0}$
is a constant, which allows us to find explicit solutions in the stationary case. These solutions are solitary waves whose profiles depend on the value of
 $A_{0}$
. It was found that,
 $A_{0}$
being negative, the wave profile is improved by comparison with the profile found in the Green–Naghdi model, except for the amplitudes of the largest waves which are slightly underestimated. The irrotational term which was neglected in the expression of
 $A$
is a term of a higher order than the usual term in the Green–Naghdi model. Previous works, such as Kim et al. (Reference Kim, Bai, Ertekin and Webster2003) for the irrotational Green–Naghdi model, showed that the inclusion of the higher-order terms improves the relationship between the wave velocity and the wave amplitude, especially for the largest waves. The inclusion of the irrotational term in our model is likely to have the same effect and thus to improve the values of the amplitude of the largest waves. The onset of wave breaking can be predicted by estimating a threshold value for the turbulent enstrophy. Below this critical value, the solitary wave remains stable, and above this value, it breaks and becomes unstable. In the latter case, dissipation has to be added to the model for a correct description of the wave. A refined treatment of the quantity
 $A$
can also be contemplated. The extension of this model to multidimensional flows over a varying bottom should be studied to cover a larger field of applications.
Acknowledgements
The authors were partially supported by ANR BoND, France. One of the authors received support from the Service Hydrographique et Océanographique de la Marine (SHOM). We gratefully acknowledge the reviewers for their helpful comments and suggestions. We wish to thank D. Lannes for useful discussions about the wave–current interaction modelling.