INTRODUCTION
Radiocarbon (14C) measured in tree rings has long been used as a record of atmospheric CO2 ∆14C values. These records are the gold standard for calibration of 14C dates for the period extending from the present back to 13,900 yr BP. It is assumed that the ∆14C of cellulose extracted from a tree ring represents CO2 that had been photosynthesized from atmospheric CO2 during the same year. Recent studies have indicated that this is not always the case.
14C measurements were reported in 10 bands per year of a Sitka spruce from Washington State (48°N) during the years 1962–1964 (Grootes et al. Reference Grootes, Farwell, Schmidt, Leach and Stuiver1989). Cellulose ∆14C values were lower than those of atmospheric CO2. They used a model to calculate that the input of biospheric CO2 derived from the surrounding soil and litter was 13–28% of the cellulose. They concluded that input of stored photosynthate from the previous year appeared less important (0–18%).
Recent studies using bomb 14C have shown that trees utilize nonstructural carbon (NSC) reserves for metabolism and cellulose production when photosynthates are insufficient, such as in times of stress (e.g. drought). In a study of temperate trees, NSC had a mean residence time of 10 yr and was composed of a fast pool (<1 yr) and a slow pool (>20 yr) (Richardson et al. Reference Richardson, Carbone, Keenan, Czimczik, Hollinger, Murakami, Schaberg and Xu2013). In a study of mature red maple (Acer rubrum) trees, a decade-old NSC pool was used for cellulose production, particularly during summer growth (Carbone et al. Reference Carbone, Czimczik, Keenan, Murakami, Pederson, Schaberg, Xu and Richardson2013).
In an earlier study, it was demonstrated that later C is incorporated into earlier whole wood during the process of conversion from sapwood to heartwood (Cain and Suess Reference Cain and Suess1976). This is known as the “Cain effect.” Unlike the NSC contribution involving earlier carbon in cellulose, the “Cain effect” is the incorporation of later carbon into the lignin in heartwood.
We report ∆14C measurements from a tree that grew in western Oregon (45°N), about 200 km south of the Sitka spruce reported by Grootes et al. (Reference Grootes, Farwell, Schmidt, Leach and Stuiver1989). We find ∆14C values that are equal to or lower than those of the Sitka spruce. We observe that the variation in the rate of spring mixing of stratospheric bomb 14C correlates with the variation in the track of the circumpolar jet stream, particularly during the springs of 1962, 1963, and 1964. This could have had a significant effect on the ∆14C values obtained from tree rings during periods of high ∆14C variability.
METHODS
The tree used in this study was an approximately 200-yr-old white oak (Sheridan Novitiate Oak, SNO) that was also used in an earlier 14C study (Cain Reference Cain1975; Cain and Suess Reference Cain and Suess1976). The tree grew in a mixed wooded and grassy area located just west of Sheridan, Oregon (45°7′N, 123°27′W), 30 km east of the Pacific coast. It was located at the western edge of a cleared field that abruptly sloped down to a valley approximately 100 m below. The tree was felled in March 1972, and the cross section used was 4 m above grade, where the trunk diameter was approximately 55 cm. Annual rings ranged from 1 to 3 mm thick, with the exception of the 1890–1910 rings that were narrower. The heartwood/sapwood color-change occurred at 1941–1942.
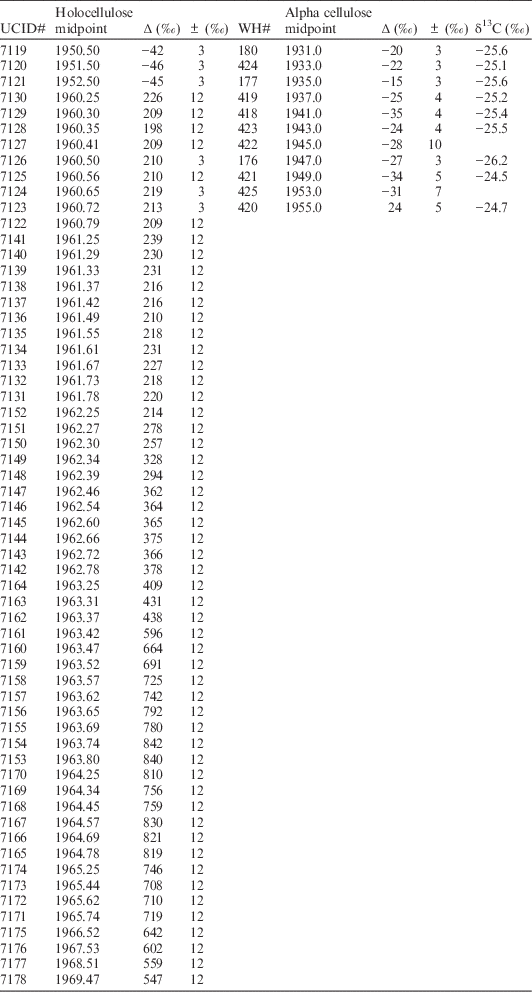
Annual and biennial samples were cut from the 1930–1955 bands, and converted to alpha cellulose at Loyola Marymount University in 1982. They were oxidized to carbon dioxide, converted to acetylene gas, and the 14C measured using gas proportional counting at the Woods Hole Oceanographic Institution Radiocarbon Lab using standard methods (Griffin and Druffel Reference Griffin and Druffel1985).
For the near monthly samples, 9–12 sub-annual ring segments were sliced from annual bands between the years of 1960 and 1970 using a wood slicer (Pootatuck Lion miter trimmer) designed to shave sub-millimeter fractions from tree rings. The trimmer was modified in the laboratory of Susan Trumbore (UCI) by adding a screw-driven stage that advances the block to be sliced. The stage advances 1 mm per 15.5 turns of the drive. All slices were analyzed from the 1960–1963 bands, six from 1964, four slices from 1965, and middle slices only from 1966–1969.
The sub-annual samples were converted to holocellulose using a modification of the Jayme-Wise technique in batches of 10–15 samples at a time (Leavitt and Danzer Reference Leavitt and Danzer1993). Briefly, samples were Soxhlet extracted of waxes, oils and resins using 2:1 toluene/ethanol for 48 hr, then Soxhlet extracted using ethanol for another 48 hr. To remove low molecular weight polysaccharides, samples were heated numerous times in a solution that contained water, sodium chlorite and acetic acid, then rinsed with water and dried. A secondary standard, C3 cellulose, was run with the SNO samples; the published ∆ value is +294‰ (Rozanski et al. Reference Rozanski, Stichler, Gonfiantini, Scott, Buenkins, Kromer and van der Plicht1992). Samples were converted to CO2, and then to graphite, using hydrogen reduction on cobalt (Vogel et al. Reference Vogel, Southon and Nelson1987). ∆14C measurements were performed at the Keck Carbon Cycle AMS laboratory at UC Irvine (Southon et al. Reference Southon, Santos, Druffel-Rodriguez, Druffel, Trumbore, Xu, Griffin, Ali and Mazon2004).
Radiocarbon results are reported as ∆ values that are corrected for known age to 1950 according to convention (Table 1; Stuiver and Polach Reference Stuiver and Polach1977). The 13C/12C ratio of each sample was measured on the AMS at the time of 14C/12C measurement and was used to correct to a δ13C value of –25‰ as per convention. For the biennial samples, δ13C measurements were made on re-burned acetylene gas (±0.1‰). Duplicate analyses were performed for 12 pairs of sub-annual samples. The total uncertainties of the near monthly and annual/biennial ∆14C analyses were ±12‰ and ±3–10‰, respectively.
∆ values, years CE, and Lab ID# for SNO tree-ring measurements from this work. Midpoint was determined based on mass of sample.

RESULTS AND DISCUSSION
∆14C Results of Annual and Biennial Pre-Bomb Tree Rings
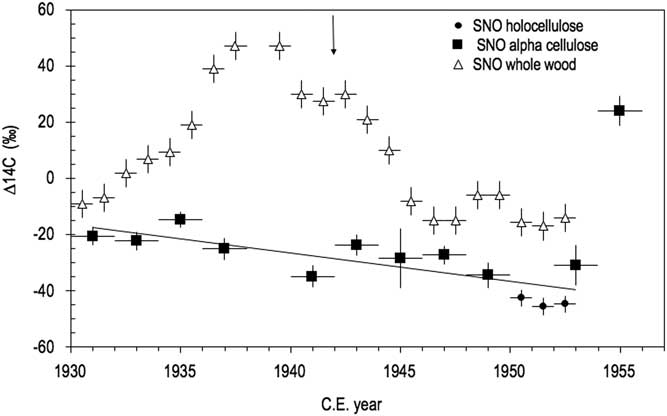
Figure 1 shows ∆14C results of cellulose extracted from the pre-bomb biennial and annual SNO bands. Values range from –46‰ to –15‰, and a linear regression of data from the 1930–1953 bands (r=0.80, p=.0004, n=13) shows a decrease of 23‰ (Figure 1). This decrease is the Suess effect caused mostly by the input of 14C-free fossil CO2 from the burning of coal, oil and gas since the 1800s (Revelle and Suess Reference Revelle and Suess1957; Suess Reference Suess1953). The 1954–1955 sample (24‰) shows the presence of bomb-produced 14C. Annual ∆14C measurements of whole wood from the SNO tree are also shown in Figure 1 and revealed higher values than the holo- and alpha cellulose values due to the movement of lignin and other soluble materials (removed during cellulose extraction) in the sapwood (Cain and Suess Reference Cain and Suess1976), the “Cain effect.” These records demonstrate the importance of using cellulose for 14C analysis of tree rings during periods of high atmospheric ∆14C variability.
∆14C values of biennial and annual cellulose samples from the pre-bomb period of the SNO tree. Also shown are ∆14C values of annual tree ring samples of whole wood from the same tree (Cain and Suess Reference Cain and Suess1976). Line is the least squares fit of the cellulose SNO values (y=–1.00x+1920.2 r=0.803 n=13 p<.0004). Arrow indicates the boundary between heartwood and sapwood.

Near Monthly Age Assignments and ∆14C Results of Post-Bomb Tree Rings
Age assignments of the near monthly samples were made assuming that the growing season was from April 1 to November 1. The sub-annual time fraction of the radial growth was corrected using the fraction of total mass of the ring segment. For example, the 1962 band was divided into 11 samples whose fractions ranged from 5 to 14% of the mass of the annual band.
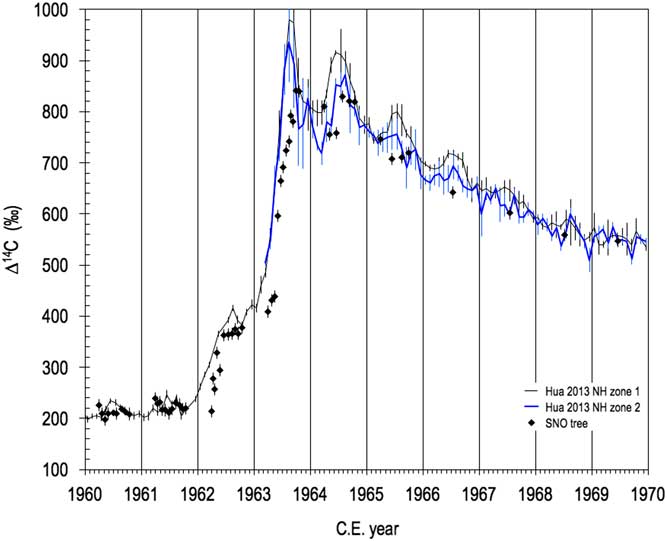
The ∆14C results of the near monthly SNO samples are plotted in Figure 2. The SNO ∆14C values ranged from a low of 198‰ (1960.35) to a high of 842‰ (1963.74). The ∆14C values remained low during 1960 and 1961, with averages of 211±8‰ sd (n=9) and 223±9‰ (n=11), respectively. Values rose sharply in early 1962, from 214‰ at the beginning of the growing season to 378‰ at the end. The steepest rise occurred in 1963, when ∆14C values increased from 409‰ to 842‰.
SNO ∆14C values of near monthly holocellulose samples. Also shown are the monthly ∆14C values of atmospheric CO2 from zone 1 (1960–1970) and zone 2 (>1963) in the Northern Hemisphere (Hua et al. Reference Hua, Barbetti and Rakowski2013). Error bars shown are 1 sigma. If no error bars are shown, the error is smaller than the point.

The SNO ∆14C values are plotted along with atmospheric CO2 ∆14C records (Figure 2) from two zones in the Northern Hemisphere, zone 1 north of ~40°N, and zone 2 between ~40°N and 0° (Hua et al. Reference Hua, Barbetti and Rakowski2013). Monthly values for zone 2 are available beginning in early 1963, due to the paucity of data before then. Bomb 14C was highest in the mid- and high latitudes of the Northern Hemisphere (zone 1), because most of the thermonuclear warheads that produced 14C were exploded in the northern stratosphere; this 14C entered the troposphere at ~50°N via the spring leak (Nydal Reference Nydal1968). Comparison of the SNO ∆14C values with those of atmospheric CO2 reveals general agreement from 1960–1961 and 1964–1969. In contrast, most of the SNO ∆14C values are more than 2σ lower than the corresponding atmospheric CO2 ∆14C values from 1962–1963 (Figure 2). We note that the SNO ∆14C values in the middle of 1–2 samples from each of four years (1960, 1961, 1964, and 1966) are significantly lower than the corresponding atmospheric CO2 ∆14C (zone 2) values.
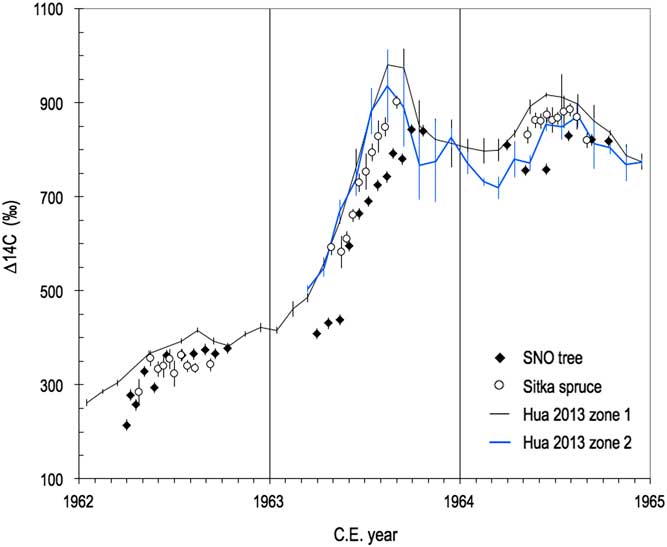
There are several possible explanations for the ∆14C values in the SNO cellulose being lower than those in the concurrent atmospheric CO2. First, incorporation of fossil fuel CO2 from the surrounding area would cause lower SNO ∆14C values, but this is unlikely because this rural region is located 40 km from the nearest city of any size (Salem, Oregon) that could provide a source of pollution. Second, although biospheric CO2 from soil, litter, and root respiration was attributed as the cause of the offset between the Sitka spruce cellulose and atmospheric CO2 ∆14C values (zone 1) (Grootes et al. Reference Grootes, Farwell, Schmidt, Leach and Stuiver1989), there is little difference between Sitka results and those from atmospheric CO2 in zone 2 (Figure 3). Third, although Carbone et al. (Reference Carbone, Czimczik, Keenan, Murakami, Pederson, Schaberg, Xu and Richardson2013) concluded that mature red maple trees use NSC to produce cellulose, the difference we observe is primarily in specific years (1962–1963), so this seems unlikely to be the primary cause of low ∆14C values in the SNO samples (see Figures S1 and S2 in the Supplemental Information).
SNO ∆14C values of near monthly samples (this work) and those of a Sitka spruce (Grootes et al. Reference Grootes, Farwell, Schmidt, Leach and Stuiver1989) from 1962–1964. The atmospheric CO2 ∆14C record for zones 1 and 2 are also shown (Hua et al. Reference Hua, Barbetti and Rakowski2013).

Fourth, spatial variability of the atmospheric CO2 ∆14C values may have been present during the early 1960s when ∆14C values were increasing by hundreds of per mil per year. Hua et al. (Reference Hua, Barbetti and Rakowski2013) describe that zones 1 and 2 are separated by the atmospheric Ferrel cell–Hadley cell boundaries. The atmospheric CO2 ∆14C values in zone 1 are generally higher than those in zone 2 (Figure 2). Most of our SNO ∆14C values are similar to zone 2 ∆14C values, except in the 1962–1963 time period, where they are significantly lower.
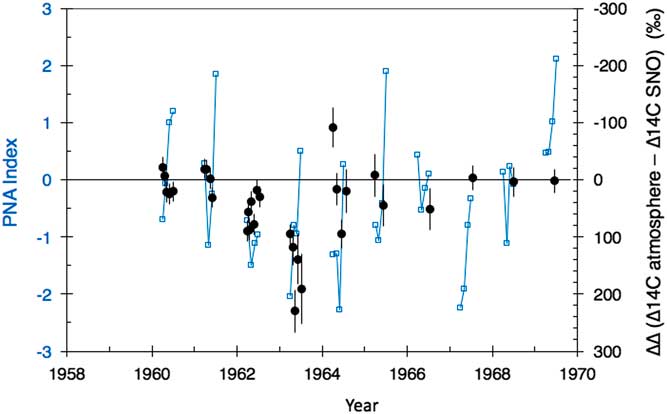
The low SNO ∆14C values in the 1962–1963 time period may be related to variability in atmospheric circulation processes that control the delivery of bomb 14C from the tropopause to high northern latitudes (zone 1) and then southward to zone 2. Atmospheric circulation in the Pacific Northwest consists of the westerly polar jet in the north and the westerly subtropical jet (East Asian jet stream) to the south. The Pacific North American index (PNA) is a record of large-scale weather patterns that describe the placement of these two jets, by taking into account the geopotential height fields of the 500mb surface with respect to sea level observed over the western and eastern United States and northeast Pacific. The PNA index has negative values during March–June of 1962–1964 and 1967 (Figure 4). Also plotted is the difference between atmospheric CO2 (zone 2) and SNO ∆14C values, called ∆∆, where high ∆∆ values are found for 1962–1963 and one value in 1964. The negative values of the PNA indicate a “blocking” pattern in the Pacific, which pushes the polar jet to higher latitudes (i.e., away from the Pacific northwest and the tree site) and brings the subtropical jet closer to the Pacific Northwest. This circulation pattern may be a cause for the low SNO ∆14C values during 1962–1964. In other words, the low PNA indicates that the air arriving at the SNO site originated from lower latitudes that would contain lower bomb 14C levels. Most of the other SNO samples (1960–1961, 1965–1969) have low ∆∆ values and higher PNA values, with the exception of 1967 that showed low PNA values and one ∆∆ value of zero. The match is not perfect, and visual comparisons are not ideal. However, it appears that the two years of large ∆∆ values occurred coincidently with periods when the PNA index was low.
Monthly PNA index values for March–June (open squares) and ∆∆ values (atmospheric CO2 ∆14C in zone 2 minus SNO ∆14C) (black circles) for April–June from 1960–1970 (note the reversed scale). The line represents zero values for both PNA index and ∆∆ values.

IMPLICATIONS FOR ISOTOPIC RECONSTRUCTIONS
Implications of these results for tree ring reconstructions are identified in two areas. First, as recent work on red maple indicates (Carbone et al. Reference Carbone, Czimczik, Keenan, Murakami, Pederson, Schaberg, Xu and Richardson2013; Richardson et al. Reference Richardson, Carbone, Keenan, Czimczik, Hollinger, Murakami, Schaberg and Xu2013), NSC produced in previous years can be used to produce cellulose by trees. Our work indicates that NSC incorporated into the SNO oak tree is not the primary explanation for low ∆14C values. Second, we find that the period of low ∆14C values occurs at the same time as negative PNA index values, indicating that there may be a link between atmospheric circulation changes that bring subpolar versus subtropical air to our tree site. This is particularly important during periods of unusually high variability of atmospheric ∆14C values, such as the early 1960s.
ACKNOWLEDGMENTS
We thank Drs John Southon, Xiaomei Xu, Claudia Czimczik, Sue Trumbore and the staff of the Keck Carbon Cycle Accelerator Mass Spectrometry Laboratory at UCI for assistance and advice. We also thank Dr Houk and Dr Jin-Yi Yu for helpful guidance about the PNA and correlations with the tree ring data. The W M Keck Foundation, Fred Kavli Foundation, and Loyola Marymount University provided support.
SUPPLEMENTARY MATERIALS
To view supplementary material for this article, please visit https://doi.org/10.1017/RDC.2017.82