In adult cardiology, natriuretic peptides are used as cardiac biomarkers while the use in paediatric cardiology is still questionable. Advances in medical imaging have greatly improved decision-making, but there still remain a number of relatively common problems where clinical examination and imaging are not always enough to plan treatment. Therefore, we have considered which paediatric heart conditions have a practical need for an additional tool and have chosen to investigate the role of cardiac natriuretic peptides in children with atrial septal defects, preterm babies with a patent arterial duct, children with tetralogy of Fallot with pulmonary regurgitation, and in diagnosis of rejection in children after heart transplantation. As a consequence some common paediatric heart defects are not discussed here, like ventricular septal defects where treatment can be guided by clinical examination and echocardiography, although cardiac peptides does correlate with the clinical presentation.Reference Suda, Matsumura and Matsumoto1 We have also reviewed the literature to establish valid reference intervals of B-type natriuretic peptide and N-terminal pro-B-type natriuretic peptide in healthy children and neonates.
The cardiac natriuretic peptides
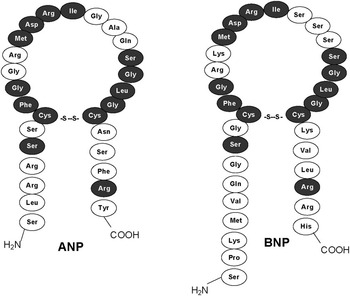
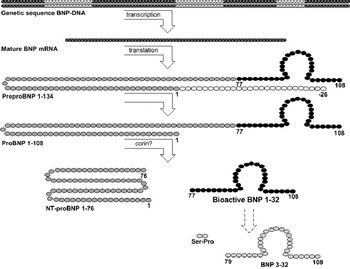
Almost 30 years ago, it was shown in rats that the heart is an endocrine organ with a hormonal link between the atria and kidneys.Reference de Bold, Borenstein, Veress and Sonnenberg2 A human equivalent identified as A-type or atrial natriuretic peptide and the structurally related B-type or brain natriuretic peptide are both cardiac hormones (Fig 1).Reference Kangawa and Matsuo3, Reference Sudoh, Maekawa and Kojima4 On chromosomal level, A-type and B-type natriuretic peptide genes are in close proximity on chromosome 1, while the C-type natriuretic peptide gene is located on chromosome 2.Reference Ogawa, Itoh and Yoshitake5, Reference Tamura, Ogawa and Yasoda6 The cardiac C-type natriuretic peptide expression and secretion has for long been somewhat unclear and at best contradictory, but new research suggests it primarily to be a hormone involved in reproduction.Reference Nielsen, Gotze, Jensen and Rehfeld7 B-type and mainly A-type natriuretic peptides are expressed and stored in the atria of the normal adult heart. In the failing heart, A-type and B-type natriuretic peptide gene expression is dramatically regulated up in both atria and ventricles, and the total amount of B-type natriuretic peptide in the ventricles exceeds that of the atria. Human A-type natriuretic peptide expression appears to be developmentally regulated; foetal ventricles express larger amounts of mRNA compared with the adult myocardium and the expression decrease with gestational age. Comparable amounts of B-type natriuretic peptide mRNA are found in foetal and adult hearts.Reference Tsuchimochi, Kurimoto and Ieki8, Reference Takahashi, Allen and Izumo9 However, in mice larger concentrations of B-type natriuretic peptides are found in foetal ventricles compared with adult ventricles, and peaks of A-type natriuretic peptide expression coincides with important stages of cardiac embryogenesis.Reference Cameron, Aitken, Ellmers, Kennedy and Espiner10 Mechanical stretch of the adult myocardium stimulates secretion of the peptides into the bloodstream and reactivates gene expression.Reference Mantymaa, Vuolteenaho, Marttila and Ruskoaho11–Reference Liang, Wu, Garami and Gardner13 Consequently, systolic ventricular dysfunction increases ventricular release resulting in rise in B-type natriuretic peptide plasma concentrations.Reference Hosoda, Nakao and Mukoyama14–Reference Tulevski, Groenink and van Der Wall17 Concentrations are also increased by hypoxia, tachycardia, and possibly cardiac fibrosis.Reference Weidemann, Klanke and Wagner18–Reference Walther, Klostermann and Heringer-Walther23 In addition, age, obesity, gender, and other hormonal and inflammatory mediators influence circulating concentrations.Reference Mehra, Uber and Park24–Reference Emdin, Passino and Prontera28 B-type and A-type natriuretic peptides both cause hypotension and induce renal excretion of sodium and water.Reference Holmes, Espiner, Richards, Yandle and Frampton29, Reference Misono, Grammer, Fukumi and Inagami30 B-type natriuretic peptide and the precursor-derived fragment N-terminal pro-B-type natriuretic peptide (Fig 2) are established biomarkers in adult cardiology.Reference Clerico, Iervasi and Del Chicca31 Renal dysfunction can increase serum levels of cardiac peptidesReference Buckley, Sagnella, Markandu, Singer and MacGregor32, Reference Buckley, Sethi and Markandu33 and also pulmonary disease when it is associated with right ventricular dysfunction.Reference Nagaya, Nishikimi and Okano34 Immunoassays measure higher concentrations of N-terminal pro-B-type natriuretic peptide than B-type natriuretic peptide, but also one type of peptide can display significant concentration variations when using different kits.Reference Goetze, Dahlstrom, Rehfeld and Alehagen35 As an example commercial B-type natriuretic peptide assays recognise not only the bioactive peptide, but also the shortened B-type natriuretic peptide 3-32, and commercial N-terminal pro-B-type natriuretic peptide assays also detect prohormone B-type natriuretic peptide 1-108 (Fig 2).Reference Heublein, Huntley and Boerrigter36–Reference Seferian, Tamm and Semenov39 In addition, N-terminal pro-B-type natriuretic peptides can circulate in plasma as glycoproteins being difficult for the assays to recognise.Reference Seferian, Tamm and Semenov40 It is not known how age, gender, disease, genetics, or other factors influence the types of natriuretic peptides in plasma, and the respective physiological roles of the various types are unclear.
A-type and B-type natriuretic peptides. The structural similarities between the bioactive peptides are primarily confined to the ring structure where 12, depictured in black, amino acid residues are identical. The ring structure is completed by a disulphide bridge from where N-terminal and C-terminal elements, the “tails”, protrude from each of the cystyl residues.Reference Kangawa and Matsuo3, Reference Flynn, de Bold and de Bold86–Reference Kambayashi, Nakao and Mukoyama88

From genetic code (DNA) to bioactive hormone, BNP 1-32. A schematic drawing of the peptide maturation process. The C-terminals are at the 108th amino acid and the N-terminal regions are at the other end of the peptides. In myocardial tissue the mRNA transcript, deriving from DNA exon regions, is translated into a preprohormone named prepro-B-type natriuretic peptide 1-134. Subsequently a small N-terminal signal sequence is removed during translation, leading to prohormone pro-B-type natriuretic peptide 1-108.Reference Sudoh, Maekawa and Kojima4, Reference Hino, Tateyama, Minamino, Kangawa and Matsuo89 A protease, possibly corin, is facilitating the cleavage of pro-B-type natriuretic peptide 1-108 into the actual bioactive hormone B-type natriuretic peptide 1-32 and its split product N-terminal pro-B-type natriuretic peptide 1-76.Reference Yan, Wu, Morser and Wu90 Pro-B-type, N-terminal pro-B-type, and B-type natriuretic peptides are all measurable in plasma. The bioactive peptide can be trimmed in the N-terminal region by aminopeptidases to B-type natriuretic peptide 3-32, but the biological significance of this trimming is still unknown.Reference Brandt, Lambeir and Ketelslegers91

Natriuretic peptides in healthy infants
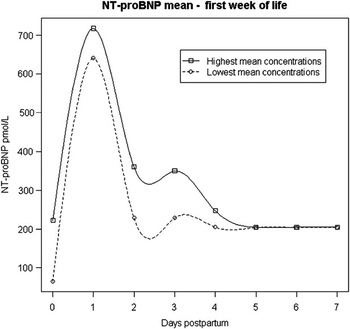
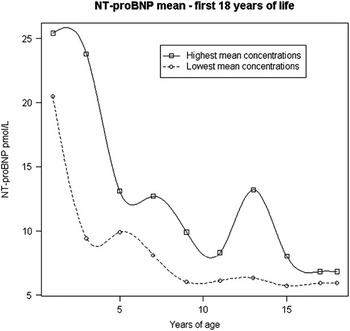
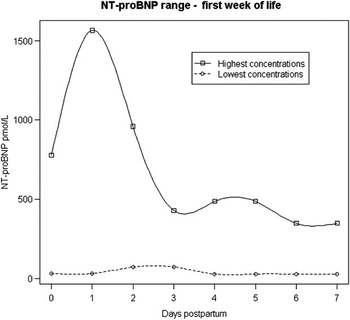
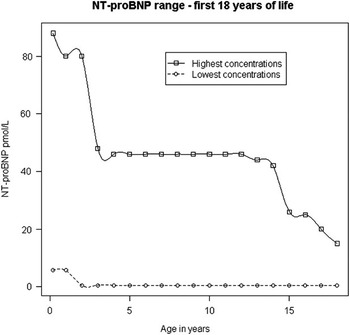
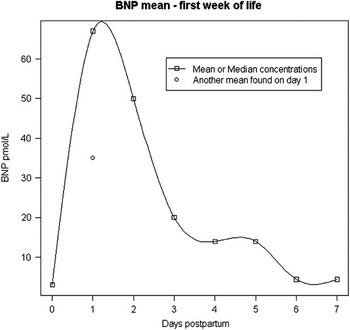
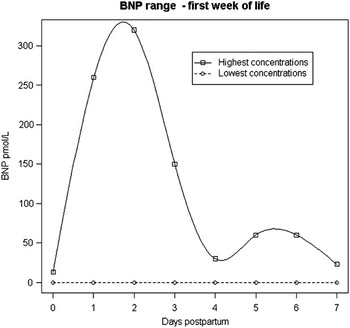
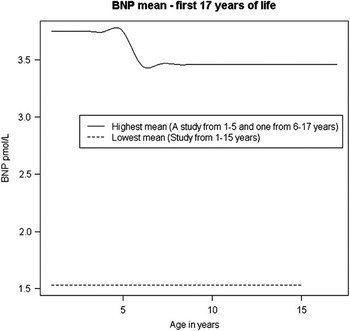
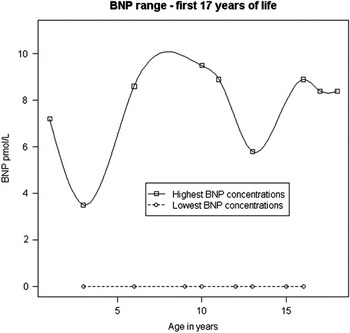
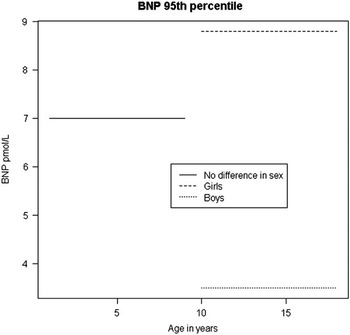
In order to use natriuretic peptides in paediatric cardiology valid reference intervals for healthy children of all ages needs to be defined. This section summarises the research on plasma concentrations of N-terminal pro-B-type and B-type natriuretic peptide in children without cardiovascular disease. N-terminal pro-B-type natriuretic peptide plasma concentrations are higher in newborn twins than singletons, with close coherence between twin siblings.Reference Hammerer-Lercher, Puschendorf and Sommer41 The concentrations of cardiac peptides are 10-fold higher in umbilical cord plasma compared with maternal blood, which implies that cardiac peptides in neonates are not derived from placental transfer.Reference Hammerer-Lercher, Puschendorf and Sommer41, Reference Hammerer-Lercher, Mair, Tews, Puschendorf and Sommer42 The mean concentration of N-terminal pro-B-type natriuretic peptide peaks the first day after birth, is halved on the second day, and decreases further during the first week, but remains higher than mean concentration in umbilical cord plasma (Fig 3).Reference Hammerer-Lercher, Puschendorf and Sommer41–Reference Schwachtgen, Herrmann and Georg48 Within the first month post partum concentrations becomes lower than in cord plasma and continue to fall (except for an outlying mean at 13 years of age)Reference Mir, Flato and Falkenberg55 (Fig 4).Reference Mir, Laux and Hellwege45–Reference Hammerer-Lercher, Geiger and Mair56 Upper range concentrations are used as reference intervals in this review (Figs 5 and 6). Plasma values convert from picomoles per litre to nanograms per litre by a factor 8.457 kilo Dalton. Only few studies include B-type natriuretic peptide in healthy children, yet plasma mean concentration follows a similar pattern to N-terminal pro-B-type the first days of life with a marked increase on the first day and on the second day of life it declines (Fig 7), although the upper range is peaking on the second day due to an outlier (Fig 8).Reference Ko, Lee and Choi57–Reference Kunii, Kamada and Ohtsuki61 After a continuous decline within the first 2 weeks of life concentrations remains at a similar level until adulthood (Fig 9).Reference Koch, Rauh, Zink and Singer54, Reference Koch and Singer60–Reference Takeuchi, Saji, Takatsuki and Fujiwara64 In adult subjects concentrations increase with age.Reference Alehagen, Goetze and Dahlstrom65, Reference Redfield, Rodeheffer and Jacobsen66 The concentration of 9.5 picomoles per litre, 33 nanograms per litre is used in this review as the maximum reference value for children older than 2 weeks (Fig 10).Reference Koch and Singer60 For B-type natriuretic peptide, picomoles per litre converts to nanograms per litre by factor 3.464. The high peak in cardiac peptide plasma concentrations post partum appears to be a hormonal response to the change from the low resistance placental circuit, to an exclusively systemic circulation resulting in increased left ventricular afterload. The right ventricle also experience increased afterload following arterial duct closure when pulmonary vascular resistance is still high. Another theory is that cardiac peptide expression is unaffected by the cardiovascular changes after birth, but there is decreased clearance by the immature kidneys. However, neither hypothesis can explain the consistent decrease in plasma concentrations of N-terminal pro-B-type natriuretic peptide through childhood that is not seen for B-type natriuretic peptide (Figs 4, 6, 9, and 10).Reference Koch, Rauh, Zink and Singer54 N-terminal pro-B-type natriuretic peptide is able to conform to glycoprotein and this state is not fully detected by conventional assays;Reference Seferian, Tamm and Semenov40 so if age involves increasing amounts of glycosylation it could explain the decreasing concentrations. The half-life of the B-type is approximately 20 minutes, whereas half-life of the larger N-terminal pro-B-type natriuretic peptide is between 25 and 120 minutes;Reference Kroll, Twomey and Srisawasdi67 this and the glycosylation can explain the higher N-terminal pro-B-type concentrations compared with B-type natriuretic peptide. There is no gender difference in N-terminal pro-B-type concentrations,Reference Nir, Bar-Oz and Perles46–Reference Mir, Flato and Falkenberg55 but levels of B-type natriuretic peptide are higher in females than in males from 10 to 18 years of age (Fig 11).Reference Koch and Singer60 The sex difference is suggested to be an inhibitory effect of testosterone in males rather than stimulatory by estradiol in females though this does not explain the higher concentration in adolescent girls compared with prepubertal girls.Reference Koch and Singer60, Reference Chang, Abdullah and Jain68
The plots represent highest and lowest mean concentrations, picomoles per litre, in circulation found in studies of N-terminal pro-B-type natriuretic peptide the first 7 days of life.Reference Hammerer-Lercher, Puschendorf and Sommer41–Reference Schwachtgen, Herrmann and Georg48

The plots represent highest and lowest mean concentrations, picomoles per litre, in circulation found in studies of N-terminal pro-B-type natriuretic peptide from 10 days after delivery until 18 years of life.Reference Nir, Bar-Oz and Perles46–Reference Hammerer-Lercher, Geiger and Mair56

The plots represent highest and lowest concentrations, picomoles per litre, in circulation found in studies of N-terminal pro-B-type natriuretic peptide the first 7 days of life.Reference Hammerer-Lercher, Puschendorf and Sommer41–Reference Schwachtgen, Herrmann and Georg48

The plots represent highest and lowest concentrations, picomoles per litre, in circulation found in studies of N-terminal pro-B-type natriuretic peptide from 10 days after delivery to 18 years of life.Reference Schwachtgen, Herrmann and Georg48–Reference Hammerer-Lercher, Geiger and Mair56

The plots represent mean or median concentrations, picomoles per litre, in circulation found of B-type natriuretic peptide the first 7 days of life.Reference Ko, Lee and Choi57–Reference Kunii, Kamada and Ohtsuki61 Only one line was constructed due to very little available data on this subject.

The plots represent highest and lowest concentrations, picomoles per litre, in circulation found in studies of B-type natriuretic peptide the first 7 days of life.Reference Ko, Lee and Choi57–Reference Kunii, Kamada and Ohtsuki61 Notice the maximum plots peak on day 2 due to one extreme outlier in Koch and Singers study.Reference Koch and Singer60 These lines are created from reading data plots in other studies due to little data available on this subject.

Schematic drawing of mean B-type natriuretic peptide concentrations, picomoles per litre, in circulation from 1 to 17 years of life.Reference Koch and Singer60–Reference Takeuchi, Saji, Takatsuki and Fujiwara64

The plots represent highest and lowest concentrations, picomoles per litre, in circulation found in studies of B-type natriuretic peptide from 1 to 17 years of life.Reference Koch and Singer60–Reference Takeuchi, Saji, Takatsuki and Fujiwara64

The 95th percentile for B-type natriuretic peptide is depictured for all children from the first year to the 9th year of life, where there is no difference in gender. From 10 to 17 years the 95th percentile shows a significant difference between sex.Reference Koch and Singer60 No difference in sex is found for N-terminal pro-B-type natriuretic peptide.

Four clinical problems in paediatric cardiology
We have identified four paediatric cardiac conditions where planning the correct treatment can be difficult even after thorough clinical examination and echocardiography. Atrial septal defects, persistent arterial ducts in preterm neonates, pulmonary regurgitation in tetralogy of Fallot, and cardiac allograft rejection are conditions where additional diagnostic tools are relevant.
The atrial septal defect
In foetal life, there is right to left shunting across the atrial septum through the foramen ovale. After birth, septum primum functions as a flap valve closing the atrial septum in response to increased left arterial pressure. If septum primum is insufficient the child is left with a secundum atrial septal defect, where blood will shunt from left to right. A large secundum defect is rarely a problem in young children, because right ventricular compliance is low in early life. As right ventricular compliance increases with age, left to right shunting increases and results in right ventricular volume overload. Most atrial septal defects will only be clinically significant in late childhood or adulthood, and sometimes only in old age. It is difficult to predict when or if a child will become symptomatic. A child who fails to thrive may be diagnosed with an atrial septal defect, but an echocardiogram will not always reveal if this is the cause of the problem and if an operation is needed. B-type natriuretic peptide correlates positively with the flow ratio between pulmonary and systemic blood flow (Qp/Qs) in patients with atrial septal defects.Reference Kunii, Kamada and Ohtsuki61, Reference Lin, Landt and Trinkaus69, Reference Ozhan, Albayrak and Uzun70 Holmgren et al do not find this correlation, and the discrepancy is explained by “a narrow range of the left-to-right shunts, with the exception of one outlier”.Reference Holmgren, Westerlind, Lundberg and Wahlander62 B-type natriuretic peptide concentrations greater than 5.8 picomoles per litre (20 nanograms per litre) is suggested to identify patients with a significant shunt by Ozhan et al.Reference Ozhan, Albayrak and Uzun70 However, as seen in Figure 10, the highest concentration in healthy children older than 2 weeks without cardiac disease is 9.5 picomoles per litre, 33 nanograms per litre, hence the suggested cut-off point is within normal range and therefore not useful. Five studies of children with atrial septal defects measure B-type natriuretic peptide concentrations within and above normal range, 0–137 picomoles per litre; 0–473 nanograms per litre.Reference Kunii, Kamada and Ohtsuki61, Reference Holmgren, Westerlind, Lundberg and Wahlander62, Reference Lin, Landt and Trinkaus69–Reference Mir, Falkenberg and Friedrich71 One would expect young children with atrial septal defects to have the lowest concentrations of cardiac peptides because low right ventricular compliance protects from left to right shunting through an atrial septal defect. However, this important physiological fact is not taken into account in existing studies, except for one, where younger patients have concentrations above normal, and older children’s are within normal range,Reference Mir, Falkenberg and Friedrich71 but it only includes seven children, and the younger patients are probably diagnosed because they have very large septal defects, but unfortunately ratios of pulmonary and systemic flows are not measured. To decide if a moderate or large atrial septal defect is responsible for a child’s failure to thrive remains a difficult call and evidence to date does not support use of cardiac peptides to guide the clinician. No studies have longitudinal measurements to potentially determine the need for operation if concentrations suddenly increase, and no study shows if closure of large atrial septal defects, benefit patients with high concentrations more than patients with low concentrations.
Persistent arterial duct in preterm neonates
A persistent arterial duct is a common problem in preterm neonates. Morbidity is high and can be associated with heart failure, intracranial haemorrhage, necrotising enterocolitis, and bronchopulmonary dysplasia when the duct is haemodynamically significant. It is not always obvious if premature neonates are in distress because of the persistent arterial duct or other complications associated with prematurity, therefore a serological marker to distinguish a minor from a haemodynamically significant persistent arterial duct is clinically relevant and lessens the need for numerous echocardiographies. Natriuretic peptide concentrations correlates with arterial duct size and shunt,Reference Czernik, Lemmer and Metze72–Reference Flynn, da Graca, Auld, Nesin and Kleinman74 and are a potential screening tool to predict the need for medicalReference Czernik, Lemmer and Metze72, Reference Choi, Lee and Eun73, Reference Farombi-Oghuvbu, Matthews, Mayne, Guerin and Corcoran75, Reference Puddy, Amirmansour, Williams and Singer76 or surgical intervention.Reference Farombi-Oghuvbu, Matthews, Mayne, Guerin and Corcoran75, Reference Puddy, Amirmansour, Williams and Singer76 The concentrations fall significantly when a haemodynamically significant duct is surgically closed or medically treated with success.Reference Choi, Lee and Eun73, Reference Puddy, Amirmansour, Williams and Singer76 The clinical significance of persistent arterial ducts are closely related to changes in pulmonary vascular resistance, so when resistance is high even large ducts will not result in significant left to right shunting. Therefore, cardiac peptides ought to be within normal range, when pulmonary vascular resistance is high even if the arterial duct is large. However, both B-type and N-terminal pro-B-type natriuretic peptides measured on the secondReference Czernik, Lemmer and Metze72 or third day of lifeReference Czernik, Lemmer and Metze72, Reference Farombi-Oghuvbu, Matthews, Mayne, Guerin and Corcoran75, Reference Puddy, Amirmansour, Williams and Singer76 have high sensitivity and specificity in predicting the need for duct closure with cut-off values of 160 picomoles per litre, 550 nanograms per litre, for B-type natriuretic peptide on the second dayReference Czernik, Lemmer and Metze72 and 320 picomoles per litre, 1110 nanograms per litre, on the third day of life.Reference Flynn, da Graca, Auld, Nesin and Kleinman74 For N-terminal pro-B-type natriuretic peptide concentrations above 1350 picomoles per litre, 11,395 nanograms per litre, on the third day post partum suggest the need for duct closure.Reference Farombi-Oghuvbu, Matthews, Mayne, Guerin and Corcoran75 The above concentrations apply to preterm neonates of varying gestational ages, but no reference intervals are available. However, concentrations in preterm show the same changes as seen in term neonates with a peak the first day of life followed by decreasing concentrations.Reference Farombi-Oghuvbu, Matthews, Mayne, Guerin and Corcoran75, Reference da Graca, Hassinger and Flynn77 Serial testing of cardiac peptides is uncomplicated when managing preterm infants, but it is the peptide values on the second and third day of life that appears to have the highest predictive value. In conclusion, B-type natriuretic peptide is a minimally invasive test, and values measured on the second and third day of life is helpful in determining whether a persistent arteria duct is or will become haemodynamically significant.
Pulmonary regurgitation and tetralogy of Fallot
In patients with tetralogy of Fallot and pulmonary stenosis the most common residual defect, after cardiac intervention or surgery, is pulmonary. Severe pulmonary regurgitation is a growing problem in paediatric cardiology, as more patients survive the initial treatment. Similar to atrial septal defects, pulmonary regurgitation is often not problematic in early childhood because the right ventricle has a relatively low compliance, but as compliance increases with age, regurgitation will increase and adversely affect right ventricular function. When interpreting cardiac peptide plasma concentrations in patients with repaired tetralogy of Fallot it is important to acknowledge the diverse clinical presentations. In uncorrected tetralogy of Fallot, concentrations are within normal rangeReference Koch, Zink and Singer78 so a hypertrophied right ventricle with systemic pressures does not appear to stimulate gene expression of the peptides. In surgically corrected tetralogy of Fallot, B-type natriuretic peptide concentrations can range from normal up to 254 picomoles per litre, 880 nanograms per litre,Reference Lin, Landt and Trinkaus69, Reference Mir, Falkenberg and Friedrich71, Reference Cheung, Lam and Chiu79 and these values include patients with varying degrees of regurgitation. Right ventricular volume overload is common later in life causing exercise intolerance, atrial- and ventricular arrhythmias, the latter a potential cause of sudden death. Size and function of the right ventricle can be difficult to measure with routine echocardiography. Cardiac magnetic resonance imaging can measure right ventricular volumes and function accurately but is time consuming and costly, and there is no clear cut-off value for size and function when planning additional surgery. Consequently, a prognostic marker for right ventricular failure that could indicate when to insert a new pulmonary valve would be very helpful. Khositseth et al suggest that N-terminal pro-B-type natriuretic peptide concentrations above 13.6 picomoles per litre, 115 nanograms per litre, predicts right ventricular dilatation and dysfunction in children at average age 12.06 years plus or minus 2.54.Reference Khositseth, Manop and Khowsathit80 However, in healthy teenagers N-terminal pro-B-type natriuretic peptide concentrations range up to 46 picomoles per litre, 391 nanograms per litre, between 3 and 14 years of age and up to 27 picomoles per litre, 230 nanograms per litre, between 15 and 18 years of age (Fig 6), and therefore some patients with right ventricular dilatation and dysfunction have concentrations within normal range. Cheung et alReference Cheung, Lam and Chiu79 find positive correlation between B-type natriuretic peptide concentrations and the degree of regurgitation, average age 14.7 years, although Mir et alReference Mir, Falkenberg and Friedrich71 find no correlation, average age 5.2 years. The most likely explanation for this discrepancy is difference in age between the subjects, because right ventricular dilatation normally is less pronounced in young children due to low right ventricular compliance even if pulmonary valve dysfunction is severe. Nevertheless, in adolescent patients with pulmonary regurgitation natriuretic peptide concentrations seem to correlate well with right ventricular dilatation.Reference Cheung, Lam and Chiu79, Reference Khositseth, Manop and Khowsathit80 Thus, cardiac peptides holds promise for predicting right ventricular overload in teenage Fallot patients, so when B-type natriuretic peptide concentrations are above 9.5 picomoles per litre, 33 nanograms per litre, or N-terminal pro-B-type natriuretic peptide concentrations are above 46 picomoles per litre, 391 nanograms per litre, in early teens or above 27 picomoles per litre, 230 nanograms per litre, in late teens (Figs 6 and 10) it warrants further investigation of right ventricular volume and function.
Heart transplantation and allograft rejection
It is difficult to determine clinically whether morbidity in paediatric heart transplant patients is caused by life threatening allograft rejection or by other childhood diseases. This is particularly an issue in local emergency departments or general paediatric wards where the clinician need to act quickly when an immunosuppressed heart transplant patient is unwell. Endomyocardial biopsy is gold standard for evaluating allograft rejection and all existing non-invasive techniques are considered less reliable. The natriuretic peptides are suggested as cardiac markers in paediatric transplant patients, where children with allograft rejection have a B-type natriuretic peptide mean concentration of 251 picomoles per litre, 870 nanograms per litre, before treatment, and 2.5 months after antirejection therapy it decreases to 42 picomoles per litre, 145 nanograms per litre.Reference Lindblade, Chun and Darragh81 Claudius et al find B-type natriuretic peptide concentrations range from 64 to 375 picomoles per litre, 221–1300 nanograms per litre, in nine plasma samples from paediatric heart transplant recipients with allograft pathology, but only 6–84 picomoles per litre, 20–290 nanograms per litre, in 50 recipients with no allograft pathology.Reference Claudius, Lan, Chang, Wetzel and Alejos82 Most of the children with allograft pathology have rejection, but some have vascular diseases or left ventricular dysfunction, and all require special attention by transplant specialists. The study suggests concentrations below 29 picomoles per litre, 100 nanograms per litre, to exclude allograft pathology.Reference Claudius, Lan, Chang, Wetzel and Alejos82 After 4–6 weeks post-heart transplantation children have concentrations up to 375 picomoles per litre, 1300 nanograms per litre, but 14 weeks after transplantation concentrations are less than 29 picomoles per litre, 100 nanograms per litre, in children with no rejection pathology.Reference Lan, Chang, Alejos, Burch and Wetzel83 Similarly, Rossano et al find the risk of allograft pathology is less than 1% when B-type natriuretic peptide concentrations are less than 29 picomoles per litre, 100 nanograms per litre, 1 year and above post-transplant.Reference Rossano, Denfield and Kim84 In 53 paediatric transplant patients visiting the emergency room or urgent care unit B-type natriuretic peptide concentrations above 202 picomoles per litre, 700 nanograms per litre, suggests allograft rejection with a 100% sensitivity, 92% specificity and with a negative predictive value of 100%.Reference Geiger, Harake, Halnon, Alejos and Levi85 This suggested threshold includes all of the patients with acute allograft rejection in this particular study; however, other studies have measured concentrations below 202 picomoles per litre, 700 nanograms per litre, in patients with acute allograft pathology.Reference Claudius, Lan, Chang, Wetzel and Alejos82, Reference Rossano, Denfield and Kim84 Even so, cardiac peptides are promising in diagnosing or excluding paediatric allograft rejection in the emergency room. In conclusion, paediatric heart transplantation recipients without rejection can have higher natriuretic peptide concentrations compared with normal healthy children. In the first weeks following heart transplantation, natriuretic peptide concentrations are very high where there is no difference between the rejection and non-rejection groups, but if a child is acutely ill more than 1 year after transplantation and plasma B-type natriuretic peptide is below 29 picomoles per litre, 100 nanograms per litre, then there is less than 1% chance of acute allograft rejection, but if the concentration is above 202 picomoles per litre, 700 nanograms per litre, then allograft rejection can be expected. B-type natriuretic peptide values between 29 and 202 picomoles per litre, 100 and 700 nanograms per litre, do not help the clinician in differentiating allograft pathology from other paediatric conditions.
Conclusion
There are several conditions in paediatric cardiology where clinical decision-making is difficult despite modern imaging technology and good clinical skills. We have listed four common clinical problems where additional tests are called for, and we have reviewed the role of cardiac natriuretic peptides as an additional tool to help the clinician. Reference intervals for natriuretic peptides are defined in this review based on published studies, but these are less well defined compared with reference intervals in adult patients. The presentation of congenital cardiac disease changes with age reflecting changes in the pulmonary vascular resistance and right ventricular compliance, a fact that has confounded many of the attempts to describe natriuretic peptide concentrations in children with cardiac disease. In preterm neonates with persistent arterial ducts, the natriuretic peptide concentrations on day 2 and 3 predict the need for duct closure. In children with heart transplants, concentrations help to guide treatment; and in teenagers with tetralogy of Fallot with pulmonary regurgitation, they imply the need for further investigations of right ventricular size and function. But in children with atrial septal defect, cardiac peptides have no clinical value when planning therapy.
Acknowledgement
The authors thank The Danish Heart Foundation for financial support.