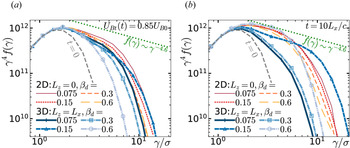
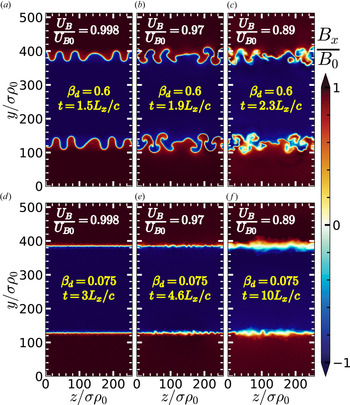
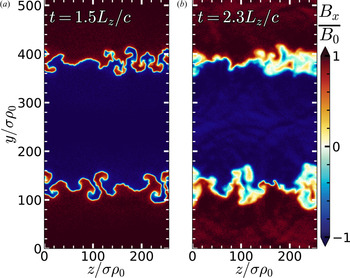
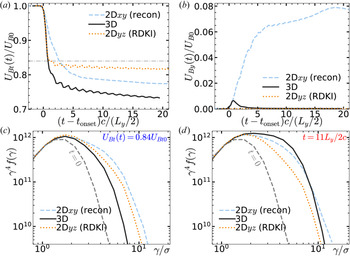
1. Introduction
Magnetic reconnection is an important plasma physical process because it can rapidly convert magnetic energy to particle kinetic energy; it does so by rearranging the magnetic field configuration, ‘breaking’ and subsequently ‘reconnecting’ magnetic field lines (for a review, see, e.g. Zweibel & Yamada Reference Zweibel and Yamada2009; Yamada, Kulsrud & Ji Reference Yamada, Kulsrud and Ji2010). Magnetic reconnection is thus believed to play a fundamental role in a wide variety of rapid – and sometimes violent and spectacular – releases of magnetic energy resulting in particle energization and radiation, from solar flares to X-ray emission in coronae of accreting black holes to flaring TeV emission in blazar jets of active galactic nuclei (AGN). In some high-energy astrophysical sources, such as pulsar wind nebulae (PWN) and blazar jets, reconnection may operate in a somewhat extreme regime of relativistically hot plasma containing positrons instead of, or in addition to, ions. In such environments, reconnection in the relativistic regime has become a promising explanation for high-energy emission, especially since particle-in-cell (PIC) simulations have convincingly demonstrated that, in addition to heating plasma, reconnection can accelerate a significant fraction of particles to very high energies, yielding a non-thermal power-law energy distribution of particles (e.g. Zenitani & Hoshino Reference Zenitani and Hoshino2001, Reference Zenitani and Hoshino2005a,Reference Zenitani and Hoshinob, Reference Zenitani and Hoshino2007, Reference Zenitani and Hoshino2008; Jaroschek et al. Reference Jaroschek, Treumann, Lesch and Scholer2004; Lyubarsky & Liverts Reference Lyubarsky and Liverts2008; Liu et al. Reference Liu, Li, Yin, Albright, Bowers and Liang2011; Sironi & Spitkovsky Reference Sironi and Spitkovsky2011, Reference Sironi and Spitkovsky2014; Bessho & Bhattacharjee Reference Bessho and Bhattacharjee2012; Cerutti et al. Reference Cerutti, Werner, Uzdensky and Begelman2012b, Reference Cerutti, Werner, Uzdensky and Begelman2013, Reference Cerutti, Werner, Uzdensky and Begelman2014a,Reference Cerutti, Werner, Uzdensky and Begelmanb; Kagan, Milosavljević & Spitkovsky Reference Kagan, Milosavljević and Spitkovsky2013; Guo et al. Reference Guo, Li, Daughton and Liu2014, Reference Guo, Liu, Daughton and Li2015, Reference Guo, Li, Li, Daughton, Zhang, Lloyd-Ronning, Liu, Zhang and Deng2016b, Reference Guo, Li, Daughton, Li and Liua, Reference Guo, Li, Daughton, Kilian, Li, Liu, Yan and Ma2019; Dahlin, Drake & Swisdak Reference Dahlin, Drake and Swisdak2015, Reference Dahlin, Drake and Swisdak2017; Nalewajko et al. Reference Nalewajko, Uzdensky, Cerutti, Werner and Begelman2015; Sironi, Petropoulou & Giannios Reference Sironi, Petropoulou and Giannios2015; Sironi, Giannios & Petropoulou Reference Sironi, Giannios and Petropoulou2016; Werner et al. Reference Werner, Uzdensky, Cerutti, Nalewajko and Begelman2016, Reference Werner, Uzdensky, Begelman, Cerutti and Nalewajko2018; Werner, Philippov & Uzdensky Reference Werner, Philippov and Uzdensky2019; Werner & Uzdensky Reference Werner and Uzdensky2017; Petropoulou & Sironi Reference Petropoulou and Sironi2018; Ball, Sironi & Özel Reference Ball, Sironi and Özel2018, Reference Ball, Sironi and Özel2019; Hakobyan, Philippov & Spitkovsky Reference Hakobyan, Philippov and Spitkovsky2019; Hakobyan et al. Reference Hakobyan, Petropoulou, Spitkovsky and Sironi2021; Li et al. Reference Li, Guo, Li, Stanier and Kilian2019; Schoeffler et al. Reference Schoeffler, Grismayer, Uzdensky, Fonseca and Silva2019; Guo et al. Reference Guo, Li, Daughton, Li, Kilian, Liu, Zhang and Zhang2020; Kilian et al. Reference Kilian, Li, Guo and Li2020; Mehlhaff et al. Reference Mehlhaff, Werner, Uzdensky and Begelman2020; Sironi & Beloborodov Reference Sironi and Beloborodov2020; Zhang, Sironi & Giannios Reference Zhang, Sironi and Giannios2021). High-energy non-thermal particle acceleration (NTPA) followed by synchrotron or inverse Compton emission could explain observed non-thermal radiation spectra.
Large two-dimensional (2-D) PIC simulations of reconnection in collisionless, relativistic pair plasma have observed fast reconnection, with reconnection rates around  $E_\textrm {rec}\sim 0.1 B_0 v_A/c$ (where
 $B_0$ is the upstream, ambient, reconnecting magnetic field,
 $v_A$ is the corresponding Alfvén speed and c is the speed of light), resulting in rapid conversion of magnetic energy to plasma energy. In these simulations, NTPA yields power-law electron energy distributions
 $f(\gamma )\sim \gamma ^{-p}$ (where electron energy is
 $\gamma m_e c^2$) with a range of slopes
 $p$; it appears that, depending on the environment and system size,
 $p$ can take on values greater than 1, and
 $p$ may even approach 1 in highly magnetically dominated reconnection (e.g. Guo et al. Reference Guo, Li, Daughton and Liu2014, Reference Guo, Liu, Daughton and Li2015; Werner et al. Reference Werner, Uzdensky, Cerutti, Nalewajko and Begelman2016). Since
 $p$ can in principle be inferred from observed radiation, these simulation results may potentially elucidate plasma parameters (such as magnetization) in astrophysical sources. Besides the power-law slope
 $p$, an important result of these simulations is the determination of the high-energy cutoff
 $\gamma _c$ of the power law, and in particular its scaling with system size
 $L$, since real astrophysical systems are usually much larger (with respect to kinetic scales) than we can possibly simulate. For systems with small
 $L$, simulations observe ‘extreme acceleration’ consistent with particles being accelerated in reconnection electric field
 $E_\textrm {rec}\simeq 0.1(v_A/c)B_0$ (where
 $B_0$ is the reconnecting magnetic field) over system size
 $L$ (Hillas Reference Hillas1984; Aharonian et al. Reference Aharonian, Belyanin, Derishev, Kocharovsky and Kocharovsky2002), so that particles reach energies
 $\gamma _c m_e c^2 \simeq eE_\textrm {rec} L$, where e is the elementary charge (Werner et al. Reference Werner, Uzdensky, Cerutti, Nalewajko and Begelman2016). However, for larger systems, this rapid acceleration seems to stall around
 $\gamma _c \sim 4\sigma$, where
 $\sigma \equiv B_0^2/(4{\rm \pi} n_{b0} m_e c^2)$ is the ‘cold’ magnetization parameter involving the reconnecting field
 $B_0$ and the ambient plasma rest-mass energy density
 $n_{b0} m_e c^2$ (Werner et al. Reference Werner, Uzdensky, Cerutti, Nalewajko and Begelman2016). More recent PIC simulations found that acceleration can continue well beyond this limit in extremely large systems, albeit at a significantly slower rate so that cutoff energies grow with the square root of time, resulting in
 $\gamma _c \sim \sqrt {L}$ (Petropoulou & Sironi Reference Petropoulou and Sironi2018; Hakobyan et al. Reference Hakobyan, Petropoulou, Spitkovsky and Sironi2021). The precise mechanism of reconnection-driven particle acceleration has received much attention (e.g. Zenitani & Hoshino Reference Zenitani and Hoshino2001; Jaroschek et al. Reference Jaroschek, Treumann, Lesch and Scholer2004; Drake et al. Reference Drake, Swisdak, Che and Shay2006; Zenitani & Hoshino Reference Zenitani and Hoshino2007; Lyubarsky & Liverts Reference Lyubarsky and Liverts2008; Liu et al. Reference Liu, Li, Yin, Albright, Bowers and Liang2011; Bessho & Bhattacharjee Reference Bessho and Bhattacharjee2012; Cerutti, Uzdensky & Begelman Reference Cerutti, Uzdensky and Begelman2012a; Cerutti et al. Reference Cerutti, Werner, Uzdensky and Begelman2013, Reference Cerutti, Werner, Uzdensky and Begelman2014b; Kagan et al. Reference Kagan, Milosavljević and Spitkovsky2013; Guo et al. Reference Guo, Li, Daughton and Liu2014, Reference Guo, Liu, Daughton and Li2015, Reference Guo, Li, Daughton, Kilian, Li, Liu, Yan and Ma2019; Bessho et al. Reference Bessho, Chen, Germaschewski and Bhattacharjee2015; Nalewajko et al. Reference Nalewajko, Uzdensky, Cerutti, Werner and Begelman2015; Dahlin, Drake & Swisdak Reference Dahlin, Drake and Swisdak2016; Sironi et al. Reference Sironi, Giannios and Petropoulou2016; Werner et al. Reference Werner, Uzdensky, Cerutti, Nalewajko and Begelman2016; Ball et al. Reference Ball, Sironi and Özel2018, Reference Ball, Sironi and Özel2019; Petropoulou & Sironi Reference Petropoulou and Sironi2018; Li et al. Reference Li, Guo, Li, Stanier and Kilian2019; Guo et al. Reference Guo, Li, Daughton, Li, Kilian, Liu, Zhang and Zhang2020; Kilian et al. Reference Kilian, Li, Guo and Li2020; Zhang et al. Reference Zhang, Sironi and Giannios2021); a number of mechanisms have been considered, and it remains a matter of ongoing research to determine precisely which mechanism operates most effectively in which regime.
Most studies of reconnection in relativistic plasmas have relied on 2-D simulations; an important outstanding question remains whether these are applicable to 3-D events in nature. A much smaller number of 3-D simulations of reconnection in relativistic pair plasmas have been done (Zenitani & Hoshino Reference Zenitani and Hoshino2005b, Reference Zenitani and Hoshino2008; Yin et al. Reference Yin, Daughton, Karimabadi, Albright, Bowers and Margulies2008; Liu et al. Reference Liu, Li, Yin, Albright, Bowers and Liang2011; Kagan et al. Reference Kagan, Milosavljević and Spitkovsky2013; Cerutti et al. Reference Cerutti, Werner, Uzdensky and Begelman2014b; Guo et al. Reference Guo, Li, Daughton and Liu2014, Reference Guo, Liu, Daughton and Li2015; Sironi & Spitkovsky Reference Sironi and Spitkovsky2014; Werner & Uzdensky Reference Werner and Uzdensky2017; Guo et al. Reference Guo, Li, Daughton, Li, Kilian, Liu, Zhang and Zhang2020; Zhang et al. Reference Zhang, Sironi and Giannios2021) (there have also been 3-D PIC simulations of non-relativistic electron–ion reconnection, e.g. Hesse, Kuznetsova & Birn Reference Hesse, Kuznetsova and Birn2001; Pritchett & Coroniti Reference Pritchett and Coroniti2001, Reference Pritchett and Coroniti2004; Lapenta et al. Reference Lapenta, Krauss-Varban, Karimabadi, Huba, Rudakov and Ricci2006; Daughton et al. Reference Daughton, Roytershteyn, Karimabadi, Yin, Albright, Bergen and Bowers2011, Reference Daughton, Nakamura, Karimabadi, Roytershteyn and Loring2014; Markidis et al. Reference Markidis, Lapenta, Divin, Goldman, Newman and Andersson2012; Nakamura et al. Reference Nakamura, Daughton, Karimabadi and Eriksson2013; Wendel et al. Reference Wendel, Olson, Hesse, Aunai, Kuznetsova, Karimabadi, Daughton and Adrian2013; Lapenta et al. Reference Lapenta, Goldman, Newman, Markidis and Divin2014, Reference Lapenta, Pucci, Goldman and Newman2020; Dahlin et al. Reference Dahlin, Drake and Swisdak2015, Reference Dahlin, Drake and Swisdak2017; Lapenta et al. Reference Lapenta, Goldman, Newman and Markidis2017; Le et al. Reference Le, Daughton, Ohia, Chen, Liu, Wang, Nystrom and Bird2018, Reference Le, Stanier, Daughton, Ng, Egedal, Nystrom and Bird2019; Pucci et al. Reference Pucci, Matthaeus, Chasapis, Servidio, Sorriso-Valvo, Olshevsky, Newman, Goldman and Lapenta2018; Li et al. Reference Li, Guo, Li, Stanier and Kilian2019; Stanier et al. Reference Stanier, Daughton, Le, Li and Bird2019; Lapenta et al. Reference Lapenta, Pucci, Goldman and Newman2020). Because of computational expense, 3-D simulations have been smaller in physical system size, and have covered a much narrower range of regimes.
The first 3-D PIC studies of relativistic reconnection focused on the competition between the tearing instability that leads to reconnection and the relativistic drift-kink instability (RDKI), which is forbidden in 2-D reconnection simulations but in three dimensions can grow as fast as the tearing instability (Zenitani & Hoshino Reference Zenitani and Hoshino2005a, Reference Zenitani and Hoshino2007, Reference Zenitani and Hoshino2008; Yin et al. Reference Yin, Daughton, Karimabadi, Albright, Bowers and Margulies2008). Later, simulations with sufficiently large system sizes observed NTPA, and moreover (despite clear manifestations of RDKI) found substantial similarities between 2-D and 3-D relativistic reconnection in both NTPA and general reconnection dynamics, including magnetic energy release and reconnection rates (Liu et al. Reference Liu, Li, Yin, Albright, Bowers and Liang2011; Kagan et al. Reference Kagan, Milosavljević and Spitkovsky2013; Sironi & Spitkovsky Reference Sironi and Spitkovsky2014; Guo et al. Reference Guo, Li, Daughton and Liu2014, Reference Guo, Liu, Daughton and Li2015; Werner & Uzdensky Reference Werner and Uzdensky2017; Guo et al. Reference Guo, Li, Daughton, Li, Kilian, Liu, Zhang and Zhang2020; Zhang et al. Reference Zhang, Sironi and Giannios2021). Our previous work (Werner & Uzdensky Reference Werner and Uzdensky2017) systematically compared 2-D and 3-D simulations in the magnetically dominated regime (where the upstream magnetic energy dominates over the upstream plasma thermal and rest-mass energy), and found magnetic energy conversion and NTPA in two and three dimensions to be nearly indistinguishable. This was found to be the case over a range of guide magnetic fields,  $0 \leq B_{gz}/B_0 \leq 1$ (although both energy conversion and NTPA were suppressed by stronger guide field). In the non-relativistic regime, where NTPA occurs but may not yield power laws, 2-D and 3-D reconnection (with guide field) have also been found to be similar, but with slightly enhanced NTPA in three dimensions (Dahlin et al. Reference Dahlin, Drake and Swisdak2015). We note in passing that all of these 3-D simulations began with a thin initial Harris or force-free current sheet. The close resemblance between 2-D and 3-D reconnection justifies the use of 2-D simulations to model natural 3-D systems, allowing us to simulate larger system sizes with lower computational expense. However, some have supposed that 3-D reconnection might behave somewhat or even drastically differently, because of 3-D instabilities and turbulence (e.g. Lazarian & Vishniac Reference Lazarian and Vishniac1999; Zenitani & Hoshino Reference Zenitani and Hoshino2008; Takamoto, Inoue & Lazarian Reference Takamoto, Inoue and Lazarian2015; Lazarian et al. Reference Lazarian, Kowal, Takamoto, de Gouveia Dal Pino and Cho2016; Beresnyak Reference Beresnyak2017, Reference Beresnyak2018; Muñoz & Büchner Reference Muñoz and Büchner2018; Takamoto Reference Takamoto2018; Zhou et al. Reference Zhou, Büchner, Widmer and Muñoz2018; Boozer Reference Boozer2019; Lapenta et al. Reference Lapenta, Pucci, Goldman and Newman2020; Lazarian et al. Reference Lazarian, Eyink, Jafari, Kowal, Li, Xu and Vishniac2020).
In this paper, we use PIC simulation to study both 2-D and 3-D magnetic reconnection in an ultrarelativistically hot pair plasma in the moderately magnetized regime where the upstream magnetic energy is comparable to the upstream plasma thermal energy (i.e.  $\sigma _h=1$, where the ‘hot’ magnetization
 $\sigma _h$ is defined in § 2). In both two and three dimensions, we systematically explore the effects of different initial current sheet configurations, as well as the effect of guide magnetic field; in two dimensions, where very large simulations are feasible, we also vary the overall system size, and in three dimensions, we vary the system size in the third dimension (i.e.
 $L_z$).
The moderately magnetized, ultrarelativistic pair-plasma regime is of interest for several reasons. First, it is likely relevant to astrophysical sources such as AGN jets and PWN (e.g. the Crab Nebula) in which energy might be expected to be roughly equally partitioned between plasma and magnetic field. Second, this regime lies between magnetically dominated relativistic reconnection and non-relativistic reconnection, both of which have been much more studied (especially in two dimensions); this study provides an important bridge between these regimes and also connects to reconnection in semi- or transrelativistic electron–ion plasma, where particles may be transrelativistic or ions may be subrelativistic while electrons are relativistic (e.g. Rowan, Sironi & Narayan Reference Rowan, Sironi and Narayan2017, Reference Rowan, Sironi and Narayan2019; Ball et al. Reference Ball, Sironi and Özel2018, Reference Ball, Sironi and Özel2019; Werner et al. Reference Werner, Uzdensky, Begelman, Cerutti and Nalewajko2018). Third, this is perhaps the most computationally tractable regime, because the kinetic (microphysical) plasma length scales all collapse to roughly the same values, allowing the greatest dynamic range between system size and the kinetic scales, with less computational expenditure. Using pair plasma means that electron and ‘ion’ (i.e. positron) scales are the same; in the ultrarelativistic limit, the collisionless skin depth  $d_e$ and Debye length
 $\lambda _D$ are nearly equal,
 $d_e=\sqrt {3}\lambda _D$; and the moderately magnetized regime implies that the gyroradius
 $\rho _{b}$ in the ambient plasma is nearly the same as
 $d_e$. Thus the grid spacing
 $\Delta x$ can be chosen just a little smaller than all these kinetic scales (which are nearly the same), maximizing the separation between the largest (hence all the) kinetic scales and the system size
 $L$ (for a given computational cost). This facilitates the study of macroscopic, large-system behaviour, such as plasmoid formation and NTPA.
Reconnection in mildly relativistic, moderately magnetized pair plasma has been previously studied with 3-D PIC simulations (Yin et al. Reference Yin, Daughton, Karimabadi, Albright, Bowers and Margulies2008; Liu et al. Reference Liu, Li, Yin, Albright, Bowers and Liang2011; Kagan et al. Reference Kagan, Milosavljević and Spitkovsky2013; Guo et al. Reference Guo, Li, Daughton, Li, Kilian, Liu, Zhang and Zhang2020). However, this work features the first extensive systematic exploration of several important parameters (such as the initial current sheet configuration and guide magnetic field strength) both in two and three dimensions, running for long times with sufficiently large system sizes that allow us to investigate NTPA. A detailed discussion of this current work in the context of those previous studies can be found in § 8.1.
We will show that the evolution of current sheets can be substantially different in two and three dimensions, in particular in the way that they evolve and convert magnetic energy to plasma energy – but despite these differences, NTPA is not much changed (if anything, it is enhanced in three dimensions). First, however, we will systematically characterize 2-D reconnection in the ultrarelativistic moderately magnetized ( $\sigma _h=1$) pair-plasma regime, as a number of parameters are varied – including initial current sheet configuration, system size and guide magnetic field. Then, we will characterize current sheet evolution in three dimensions across a similar range of parameters, comparing with 2-D reconnection. We will identify patches in 3-D simulations that exhibit signatures of classical 2-D reconnection, including outflows from thin current sheets, non-ideal electric fields (parallel to and/or larger than the magnetic field), and energy transfer from fields to plasma. However, we will see that 3-D reconnection is vastly more complicated to study than 2-D reconnection, displaying a greater variety of behaviours along with greater sensitivity to the initial configuration (e.g. the initial current sheet thickness or field perturbation). The rates of magnetic energy depletion and upstream magnetic flux reduction are generally slower in three dimensions, but reconnection continues for much longer times. Ultimately, more magnetic energy is released in three dimensions than in two dimensions, because in two dimensions, magnetic energy in outflows is trapped forever in plasmoids, whereas in three dimensions the plasmoid-like structures can decay. We also find that, in three dimensions, there is a new channel for magnetic energy conversion that does not necessarily involve classical reconnection at all: the kinking of the current sheet in three dimensions can grow to such large amplitudes that the current sheet becomes violently and chaotically deformed, resulting in rapid magnetic energy release and turbulent thickening of the current layer. This process is not inevitable; two initially similar simulations can end up behaving very differently over long times because one triggers such deformation and energy release, while the other does not, even though the upstream conditions may be identical in both cases. This sensitivity to initial conditions complicates the study of 3-D reconnection by increasing the parameter space that needs to be explored.
This paper is organized as follows. We will define the simulation parameters and set-up in § 2. Then in § 3 we describe diagnostics used to characterize current sheet evolution, starting with precise definitions of important terms (§ 3.1) and followed by detailed descriptions of diagnostics, such as how we measure the amount of unreconnected flux in a simulation and how we characterize NTPA. In § 4 we will describe 2-D reconnection in the moderately magnetized, relativistically hot pair-plasma regime. We will see that, in two dimensions, this regime exhibits behaviour that is qualitatively very similar to, e.g. magnetically dominated relativistic reconnection, and we will use this opportunity to review the basic picture of plasmoid-dominated (multiple X-line) reconnection, to be contrasted later with 3-D simulations. In addition, we quantify the effects of varying a number of parameters (such as initial current sheet thickness, system size, and guide magnetic field) on magnetic energy conversion and NTPA. Besides expanding our knowledge of 2-D reconnection in the moderately magnetized, relativistically hot regime, this provides a baseline for our study of 3-D reconnection in § 5. There we find that current sheet evolution can differ distinctly from 2-D reconnection, and we investigate the effects of varying the initial current sheet configuration, varying system length  $L_z$ in the third dimension and varying guide magnetic field. We discuss differences between the moderately magnetized regime studied in this paper and the magnetically dominated regime (studied in three dimensions in previous work) in § 6. We list the most important findings in § 7 before discussing some possible impacts on plasma physics and astrophysical modelling in § 8, and finally conclude with § 9. For reference, in the Appendix we present a resolution convergence study justifying the cell size
 $\Delta x$ used in this work.
2. Simulation set-up
The simulations in this work use a standard double-periodic simulation box initialized with a twice-reversing magnetic field balanced by two thin, oppositely directed Harris current sheets (e.g. Werner et al. Reference Werner, Uzdensky, Cerutti, Nalewajko and Begelman2016; Werner & Uzdensky Reference Werner and Uzdensky2017). The Harris sheets (which contain drifting plasma) are superimposed upon a uniform, stationary, relativistically hot background plasma. Once the initial state is set, the simulation code Zeltron evolves the plasma with no external input (e.g. no driving) according to a standard explicit, relativistic electromagnetic PIC algorithm (Cerutti et al. Reference Cerutti, Werner, Uzdensky and Begelman2013), with periodic boundary conditions; in 2-D simulations, all quantities are assumed to be uniform in the third dimension ( $z$) at all times – e.g.
 $\partial B_x/\partial z=0$, since all derivatives with respect to
 $z$ are zero.
In this section, we first describe the background plasma, and then the drifting plasma that forms the Harris current sheets. At the end, we summarize the parameters describing the set-up, including whether they are fixed or varied throughout this study.
Ideally, we hope to associate reconnection behaviour with the uniform background (or upstream) pair plasma, described by
(a)
 $n_{b0}$, the initial (electron plus positron) particle number density;
(b)
$\theta _b \equiv T_b/m_e c^2$, the normalized temperature;(c)
$B_0$, the (reconnecting) magnetic field in the $x$ direction; and(d)
$B_{gz}\hat {\boldsymbol {z}}$, the initially uniform guide magnetic field.


(Here,  $\boldsymbol {B}$ is initially uniform except for
 $B_x$ reversing around the current sheets.) It is useful to express
 $n_{b0}$,
 $\theta _b$,
 $B_0$ and
 $B_{gz}$ in terms of a nominal gyroradius
 $\rho _0$ and three dimensionless parameters,
 $\sigma$,
 $\sigma _h$ and
 $B_{gz}/B_0$. We define the nominal relativistic gyroradius
 $\rho _0\equiv m_ec^2/eB_0$ in place of
 $B_0$; thus a particle with ultrarelativistic Lorentz factor
 $\gamma \gg 1$ has a gyroradius of order
 $\gamma \rho _0$ in field
 $B_0$, hence typical background particles have gyroradii around
 $3\theta _b \rho _0$ (for
 $\theta _b \gg 1$). The density
 $n_{b0}$ can then be expressed in terms of
 $\rho _0$ and the ‘cold’ magnetization parameter
 $\sigma \equiv B_0^2/(4{\rm \pi} n_{b0} m_e c^2)$, which is twice the ratio of the reconnecting magnetic field's energy density,
 $B_0^2/8{\rm \pi}$, to plasma rest-energy density,
 $n_{b0}m_e c^2$. If all magnetic energy were given to particles, their Lorentz factors would increase by
 $\Delta \gamma = \sigma /2$ – i.e.
 $\sigma$ determines the available magnetic energy per particle. Thus we generally normalize lengths to a characteristic scale
 $\rho _c \equiv \sigma \rho _0$, which is of the order of the gyroradii of typical energized particles. Finally, we re-express the temperature
 $\theta _b$ in terms of the hot magnetization
 $\sigma _h \equiv B_0^2/(16{\rm \pi} \theta _b n_{b0} m_e c^2) = \sigma /(4\theta _b)$, the ratio of magnetic enthalpy density
 $B_0^2/4{\rm \pi}$ to plasma enthalpy density (including rest-mass energy), which is
 $h=4\theta _b n_{b0} m_e c^2$ in the relativistic limit
 $\theta _b\gg 1$ (Melzani et al. Reference Melzani, Walder, Folini, Winisdoerffer and Favre2014). We note that (for
 $B_{gz}=0$) the Alfvén 4-velocity is
 $c\sqrt {\sigma _h}$; i.e. the Alfvén velocity is
 $v_A=c\sqrt {\sigma _h/(1+\sigma _h)}$.
In this paper we focus on the specific case of reconnection with moderate magnetization, or  $\sigma _h=1$ (the majority of studies of reconnection in pair plasma have explored
 $\sigma _h \gg 1$, and most electron–ion reconnection studies have been non-relativistic with
 $\sigma _h \ll 1$). The upstream plasma is then completely defined by specifying, in addition to
 $\sigma _h=1$, the values of
 $\rho _0$,
 $B_{gz}/B_0$ and
 $\sigma$. The particular value of
 $\rho _0$ is irrelevant; the entire simulation scales trivially with
 $\rho _0$. For astrophysical relevance and theoretical simplicity, we choose to study the ultrarelativistically hot regime in which
 $\sigma \gg 1$ and
 $\theta _b\gg 1$ – as with
 $\rho _0$, the particular value of
 $\sigma$ does not matter (the simulation scales trivially with
 $\rho _c\equiv \sigma \rho _0$ as long as we stay in the ultrarelativistically hot regime). When
 $\sigma _h=1$, the upstream magnetic and plasma energy are roughly comparable; even complete conversion of magnetic energy would not drastically increase the plasma energy. For
 $B_{gz}=0$,
 $\sigma _h=1$ implies that the plasma beta is
 $\beta _\textrm {plasma}=1/2$ and the expected bulk reconnection outflow velocity is
 $v_A=c/\sqrt {2}$.
Important plasma length scales, in terms of  $\sigma \rho _0$ and
 $\sigma _h$, include the average background gyroradius
 $\rho _b\equiv 3\theta _b \rho _0 = (3/4)\sigma _h^{-1} \sigma \rho _0$, the background Debye length
 $\lambda _D =(1/2) \sigma _h^{-1/2} \sigma \rho _0$ and the collisionless skin depth
 $d_e = \sqrt {3\theta _b m_e c^2/4{\rm \pi} n e^2} =\sqrt {3} \lambda _D$.
Over time, the background plasma should (at least in two dimensions) dominate reconnection dynamics. However, to start in a state susceptible to reconnection, we need a reversing magnetic field and its associated current sheet (Kirk & Skjæraasen Reference Kirk and Skjæraasen2003). Actually we use two oppositely directed Harris current sheets to allow periodic boundary conditions in all directions. The simulation box, containing both current sheets, has size  $L_x\times L_y \times L_z$ where
 $x$ is the direction of reconnecting magnetic field,
 $y$ is perpendicular to the initial current sheet, and
 $z$ is the ‘third’ dimension, parallel to the initial current. We initialize this box with a (doubly) reversing magnetic field
 \begin{equation} \boldsymbol{B}(t=0) = \hat{\boldsymbol{z}} B_{gz} + \hat{\boldsymbol{x}} B_0 \times \left\{\begin{array} {@{}ll} -\textrm{tanh} [(y- L_y/4)/\delta] & \text{for } y < L_y/2, \\ \phantom{-}\textrm{tanh} [(y-3L_y/4)/\delta] & \text{for } y > L_y/2, \end{array} \right. \end{equation}
where  $\delta$ is the half-thickness of the initial current sheet. All simulations in this work use
 $L_y=2L_x$; although the lower and upper halves of the simulation can interact, the separation
 $L_y/2=L_x$ between current sheets has been found to limit the interaction so that, e.g. the reconnection rate is the same as in simulations with much larger
 $L_y$ (also, in three dimensions, the current sheets kink and stray more in the
 $y$ direction; it is important that
 $L_y$ be large enough that they never touch). When presenting results, we often focus on just one current sheet (the lower one) for simplicity, but display results involving total energy and particle spectra for the entire simulation. The system length
 $L_z$ in the third dimension will be varied to investigate 3-D effects, but the fiducial value for 3-D simulations will be
 $L_z=L_x$.
To balance the magnetic field reversal (according to Ampere's law), as well as to provide pressure balance against the upstream magnetic field, we add a ‘drifting’ plasma in addition to the background plasma (Kirk & Skjæraasen Reference Kirk and Skjæraasen2003). This initially drifting plasma has a total particle density strongly peaked around the magnetic field reversal,  $n_d(y) = n_{d0} \text {cosh}^{-2}[(y-y_c)/\delta ]$ (measured in the simulation frame), where
 $y_c$ is the centre of the current sheet;
 $y_c=L_y/4$ for the lower sheet, or
 $y_c=3L_y/4$ for the upper. Within each sheet, the electrons and positrons drift in opposite
 $\pm \hat {\boldsymbol {z}}$ directions with speed
 $\beta _d c$ (hence Lorentz factor
 $\gamma _d=(1-\beta _d^2)^{-1/2}$), and the initial temperature in the co-moving frame is
 $\theta _d m_e c^2$. The initial current sheet configuration can be specified by the drift
 $\beta _d$ and the overdensity
 $\eta \equiv n_{d0}/n_{b0}$, with the remaining parameters,
 $\theta _d$ and
 $\delta$, determined by pressure balance and Ampere's law
 $n_{d0} \theta _d/\gamma _d = B_0^2/8{\rm \pi} m_e c^2 = \sigma n_{b0}/2$ and
 $B_0/\delta = 4{\rm \pi} e n_{d0} \beta _d$. In terms of the characteristic length
 $\sigma \rho _0$, the sheet thickness is
 $\delta = (n_{b0}/n_{d0})\sigma \rho _0/\beta _d$; and in terms of the gyroradius
 $\rho _d \equiv 3\theta _d \rho _0$ of drifting particles,
 $\delta = 2\rho _d/(3\beta _d \gamma _d)$.
In previous (especially 2-D) reconnection simulations, the initial current sheets have often been slightly perturbed to trigger reconnection faster (reducing computation time) and to create an initial X-point in a predetermined location. Although such a perturbation can have an effect in two dimensions (Ball et al. Reference Ball, Sironi and Özel2019), we find that small perturbations leave 2-D simulations basically unchanged in many important ways (cf. § 4.2) as the simulation becomes dominated by the background plasma; however, the effect in three dimensions can be more significant (cf. § 5.3). While most of our simulations begin with zero perturbation, we have explored in a few cases the effect of a small magnetic field perturbation – a tearing-type perturbation with a single X-point and a single magnetic island with a small height (in  $y$) but a long width (in
 $x$). The perturbed field, expressed via vector potential
 $\boldsymbol {A}=\hat {\boldsymbol {z}} A_z$, is
 $$\begin{align} A_z(x,y) &= \left[1 + 0.877 a \frac{\delta}{L_y} \cos \left( \frac{2{\rm \pi} x}{L_x} \right) \cos^2 \left( \frac{2{\rm \pi} (y-y_c)}{L_y} \right) \right] \nonumber\\ &\quad \times B_0 \delta \left[ \ln \text{cosh} \left( \frac{L_y}{4\delta} \right) - \ln \text{cosh} \left( \frac{y-y_c}{\delta} \right) \right], \end{align}$$
where  $a$ is the perturbation strength. Although
 $a$ is useful for initializing
 $A_z(x,y)$, it is also useful to characterize the perturbation in terms of
 $s$, the half-height of the initial magnetic island. For
 $\delta \ll L_y$ and
 $s \ll L_y$,
 $s$ and
 $a$ are related approximately by
 $\text {cosh}(s/\delta ) \approx \exp (0.44 a)$. In the above,
 $a$ is thus normalized so that when
 $a=1$, we have
 $s/\delta =1$; i.e. the separatrix extends roughly as far as the initial current sheet.
For  $a \lesssim 1$, the initial separatrix lies within the initial current sheet (
 $s \lesssim \delta$). We note that the ‘wavelength’ of the perturbation in
 $x$ is
 $L_x$ – the longest that can fit in the simulation. For 3-D simulations, this perturbation is uniform in
 $z$. Unless specifically noted,
 $a=0$.
At the beginning of each simulation, particle velocities for the background (and drifting) populations are initialized randomly, drawn from the appropriate (drifting) relativistic Maxwell–Jüttner distribution. Because of this randomness, two simulations that are identical in all macroscopic initial parameters (i.e. differing only in random initial positions and velocities) will not yield completely identical results, even for global quantities such as the total magnetic energy depletion or total particle energy spectrum. Although computational expense prohibits running large statistical ensembles of simulations for every macroscopic parameter choice, one goal of this study is the estimation of ‘stochastic variation’ due to randomized particle initialization (especially in three dimensions; cf. § 5.2). In a limited number of cases, we will therefore show the results of multiple macroscopically identical simulations as a means of gauging stochastic variability, and distinguishing it from systematic effects correlated with macroscopic parameters.
In summary, the reconnection simulation set-up is described by the following physical parameters:
(a) The nominal gyroradius
$\rho _0=m_ec^2/eB_0$ is fixed for all simulations; its value is irrelevant – we can trivially scale simulation results to any other value of $\rho _0$.(b) The upstream (cold) magnetization (excluding guide field)
$\sigma = B_0^2/(4{\rm \pi} n_{b0} m_e c^2) = 10^4 \gg 1$ is fixed in all simulations; its particular value is irrelevant, as long as $\sigma \gg 1$.(c) The upstream hot magnetization (excluding guide field)
$\sigma _h = \sigma /(4\theta _b) = 1$ is fixed in all simulations; its value puts this study in the moderately magnetized regime. This implies (for $B_{gz}=0$) plasma $\beta =1/2$ and $v_A=c/\sqrt {2}$. (Previous studies of reconnection in pair plasma have mostly concentrated on the $\sigma _h\gg 1$ regime, while non-relativistic reconnection studies have $\sigma _h \ll 1$.)(d) The initial guide magnetic field
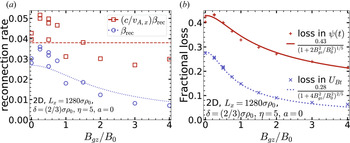
$B_{gz}$ is zero except in § 4.4 and in § 5.6, when it is varied up to $B_{gz}=4B_0$ in two dimensions and up to $B_{gz}=B_0$ in three dimensions, respectively.(e) The initial current sheet overdensity,
$\eta =n_{d0}/n_{b0}$, is set to $\eta =5$, except when varied systematically in §§ 4.2, 5.3 and 5.4.(f) The average drift speed of particles forming the initial Harris sheet is
$\beta _d c = 0.3 c$, except when varied in §§ 4.2, 5.3 and 5.4.(g) The initial current sheet half-thickness
$\delta =(\eta \beta _d)^{-1} \sigma \rho _0$ is $(2/3)\sigma \rho _0$ except when $\eta$ and $\beta _d$ are varied as noted above.(h) The initial magnetic field perturbation strength
$a$ (see (2.2)) is zero except when varied in §§ 4.2 and 5.3.(i) The system size
$L_x$ determines the overall system size, and is desired to be as large as possible, but limited by computational resources; its value will be noted in each subsection, where we generally compare simulations with the same $L_x$. However, the effect of varying $L_x$ is specifically investigated in § 4.3.(j) The system aspect ratio
$L_y/L_x = 2$ in all simulations.(k) The system aspect ratio
$L_z/L_x$ is considered to be zero in all 2-D simulations; in 3-D simulations the value of $L_z/L_x$ is noted in each case, although we most commonly use $L_z=L_x$; we systematically explore the effect of varying $L_z/L_x$ in § 5.5.(l) For 2-D simulations, a simulation time
$T\approx 10L_x/c$ is usually sufficient; 3-D simulations were run for longer times, 20–50$L_x/c$ (the longest runs are shown in § 5.5).


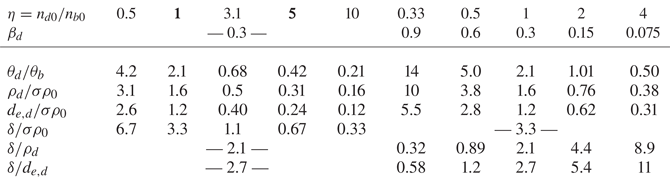
For the various choices of above parameters, important plasma length scales will be summarized in table 1.
Initial temperature and length scales of the drifting (current sheet) plasma resulting from various combinations of initial peak current sheet density  $n_{d0}=\eta n_{b0}$ and drift speed
 $\beta _d c$ used in this study. Listed are (normalized) values of the initial temperature
 $\theta _d m_e c^2$, the average gyroradius
 $\rho _d=3\theta _d\rho _0$, and the skin depth of the drifting plasma forming the current sheet,
 $d_{e,d}=\sqrt {3}\lambda _{Dd}=[3\theta _d m_e c^2/(4{\rm \pi} n e^2)]^{1/2}$, as well as the initial sheet half-thickness
 $\delta$ (relative to the fiducial upstream plasma length scale
 $\sigma \rho _0$ and drifting plasma length scales
 $\rho _d$ and
 $d_{e,d}$). We note that
 $\theta _d/\theta _b=2\gamma _d \sigma _h/\eta$ and
 $\eta \delta = \sigma \rho _0/\beta _d$. For comparison, the background plasma gyroradius is
 $\rho _b=0.75 \sigma \rho _0$ and the skin depth
 $d_e=\sqrt {3}\lambda _D=0.87 \sigma \rho _0$; the cell size is
 $\Delta x =0.33 \sigma \rho _0$. Boldface entries indicate the two configurations used to study the effect of varying perturbation strength
 $a$.

Using periodic boundary conditions offers theoretical and numerical simplicity; and it is usually the simplest way to simulate a mesoscopic box – i.e. a small part of a system whose global inhomogeneity scale along the layer is much larger than the computational box. For application to real systems, the effect of these or any boundary conditions must ultimately be studied, e.g. by examining simulation size dependence or by comparing simulations with different boundary conditions; alternatively, running simulations for less than one light-crossing time ( $t\lesssim 1\,L_x/c$) can lessen effects of boundaries, but at the cost of exacerbating the effect of the initial conditions. In this work, we run simulations well beyond
 $1\,L_x/c$ for two primary reasons: (i) the very early evolution,
 $t \lesssim 1L_x/c$, may be heavily influenced by initial conditions (which are uniform in the third dimension) and may fail to capture the most interesting and important 3-D phenomena, and (ii) the evolution in three dimensions can be relatively slow. Over long times, boundary conditions might well be expected to affect system evolution significantly, and, this being the case, there is a trade-off between possibly more realistic but complicated boundaries (like ‘open’ boundaries, e.g. Daughton, Scudder & Karimabadi Reference Daughton, Scudder and Karimabadi2006) and the simpler, better-understood periodic boundaries. However, the effect of periodic boundaries is arguably realistic for long simulations, e.g.
 $t\sim 30\,L_x/c$, if the inhomogeneity scale of the real system is larger than
 ${\sim }30L_x$. Determining the effect of various boundary conditions on current sheet evolution in three dimensions is important, but beyond the scope of this work.
Finally, we summarize the numerical parameters. The grid resolution  $\Delta x=\Delta y=\Delta z=\sigma \rho _0/3$ marginally resolves the background Debye length and skin depth
 $d_e/\sqrt {3}=\lambda _D=\sigma \rho _0/2$ as well as the background gyroradius
 $\rho _b = (3/4)\sigma \rho _0$ and the initial current sheet (usually
 $\delta =(2/3)\sigma \rho _0$). This marginal resolution allows us to simulate the largest system sizes with the computational resources available; the Appendix shows that this resolution is sufficient. The timestep
 $\Delta t=\Delta x/(c\sqrt {d})$, where the dimensionality
 $d$ is 2 or 3, is determined by the Courant–Friedrichs–Lewy condition (all 2-D simulations compared directly against 3-D simulations were run with
 $d=3$). Simulations were initialized with
 $20\times 4=80$ macroparticles per cell: 20 background electrons and positrons, plus 20 ‘drifting’ electrons and positrons. The initially drifting particles were weighted (depending on their
 $y$-position) to represent the non-uniform current sheet density, and particles with negligibly low weights were deleted from the simulation. Thus our largest simulation (
 $L_x=L_z=512\sigma \rho _0$, with
 $1536\times 3072\times 1536$ cells, cf. § 5.1) contained approximately 300 billion macroparticles. Energy is not precisely conserved by the PIC algorithm, but with these numerical parameters it is approximately conserved in all simulations to better than 1 per cent – and in almost all but the larger 2-D simulations, energy is conserved to better than 0.1 per cent.
3. Diagnostics
In this section we will define terms used to characterize reconnection (in § 3.1) and then provide detailed descriptions of diagnostics that we will use: the central surface of the ‘layer’ or current sheet,  $y_c(x,z,t)$ (§ 3.2); global volume-integrated characteristics as functions of time – unreconnected flux (§ 3.3) and various energy components (§ 3.4); the reconnection onset time
 $t_\textrm {onset}$ (§ 3.5); the local bulk velocity of the plasma (§ 3.6); and the power-law index and high-energy cutoff of a particle energy distribution (§ 3.7).
3.1. Terminology
Before describing diagnostics for reconnection, we offer explicit definitions or clarifications of some often-used terms, so that we can avoid lengthy qualifications in the text.
Transverse: the  $x$ and
 $y$ directions, transverse to
 $z$, the direction of the guide magnetic field.
Transverse magnetic field energy  $U_{Bt}$: the energy in the
 $B_x$ and
 $B_y$ components of the magnetic field – the volume integral of
 $(B_x^2+B_y^2)/8{\rm \pi}$ over the entire system. Even in simulations with substantial guide magnetic field, it is mainly the transverse magnetic energy (and not energy in
 $B_z$) that is depleted during reconnection.
Guide magnetic field energy  $U_{Bz}$: the energy in the
 $B_z$ components of the magnetic field. Because
 $B_z(x,y,z)$ is initially uniform and the flux
 $\int B_z \,{\textrm {d}x}\,{\textrm {d}y}$ through any transverse plane is exactly conserved in the simulation,
 $U_{Bz}$ can only increase from its initial value (in practice it does not increase much and the increase can often be neglected).
Plasma energy: the total kinetic energy of individual plasma particles.
Magnetic energy conversion: the conversion of (transverse) magnetic field energy  $U_{Bt}$ to plasma energy. Because the guide magnetic field energy
 $U_{Bz}$ cannot decrease, it is essentially equivalent to refer to magnetic energy conversion or transverse magnetic energy conversion.
Plasma energization: the conversion of (transverse) magnetic energy to plasma energy.
Released magnetic energy: (transverse) magnetic energy that has been converted to plasma energy.
Magnetic energy depletion: (transverse) magnetic energy conversion, with emphasis on the reduction in magnetic energy (as it is converted to plasma energy). This is nearly a synonym for ‘dissipation’, except that ‘dissipation’ refers to irreversible heating, whereas ‘depletion’ or ‘conversion’ also include conversion to bulk flow kinetic energy (in this paper, however, we will not measure the difference between depletion and dissipation).
Unreconnected (magnetic) field (line): a magnetic field line that crosses the entire simulation domain in the  $x$ direction (possibly diagonally), without reversing (in
 $x$). As we discuss in § 3.3, this is an imperfect, approximate, but practical definition.
‘Reconnected’ (magnetic) field (line): any magnetic field line that is not unreconnected (according to the definition above). In 2-D reconnection, a reconnected field line is a closed loop around one or more magnetic islands or plasmoids, and our definition of a ‘reconnected’ field line identifies most closed loops accurately. In three dimensions, however, there may be many field lines that are ‘not unreconnected’ but do not resemble closed loops or even spirals around flux ropes; we nevertheless call them ‘reconnected’ and will often use quotation marks as a reminder that they do not necessarily resemble reconnected field lines in 2-D reconnection.
Upstream: the upstream region includes all points on ‘unreconnected’ field lines. By extension, upstream plasma is the plasma in this region, upstream magnetic energy is the magnetic energy in this region, etc.
Upstream value: When we refer to specific upstream values, such as the upstream  $\sigma _h$,
 $B_0$,
 $n_{be}$, or
 $\theta _b$, we mean the asymptotic or far upstream values.
Current sheet (or sheets): the region containing currents that support the reversal in magnetic field. We often refer to the initial current sheet, which is well defined, and otherwise use the term to refer to sheet-like regions where  $J_z$ is strong.
The layer (reconnection layer, current layer): the complement of the upstream region – i.e. the region containing ‘reconnected’ field lines. This region contains the current sheet (or current sheets) as well as reconnection outflows and plasmoids. We think of ‘the layer’ as the evolved current sheet. Each (double-periodic) simulation contains two layers – the upper and lower layers.
Separatrix: the surface between the ‘upstream’ region and ‘the layer’, i.e. that separates ‘reconnected’ and ‘unreconnected’ magnetic field lines. In two dimensions this is a smooth, well-defined surface. In three dimensions that may not be the case, but none of our analysis will be sensitive to the precise location of the separatrix.
Unreconnected flux: the integral of  $B_x$ over the
 $x=0$ plane intersected with the ‘upstream’ region; i.e. the integral is over all (and only) unreconnected field. See § 3.3 for more detail.
Reconnected flux: the flux of magnetic field around the major (largest) plasmoid. This concept is well defined and easily measured in two dimensions, where the unreconnected plus reconnected flux is conserved (cf. § 3.3). It is non-trivial, however, to define and measure this in three dimensions, and we will not do so.
Upstream magnetic energy  $U_{Bt,{\rm up}}$: the transverse magnetic energy in the upstream region. We exclude guide-field energy from this quantity, because we are primarily interested in conversion of magnetic energy to plasma energy.
Magnetic energy in the layer  $U_{Bt,{\rm layer}}$:, the transverse magnetic energy in the layer;
 $U_{Bt,{\rm up}} + U_{Bt,{\rm layer}}=U_{Bt}$. We exclude guide-field energy from this quantity.
Reconnection: technically, ‘reconnection’ should involve the conversion/rearrangement of ‘unreconnected field lines’ to ‘reconnected field lines’ in a way that conserves the total unreconnected plus reconnected flux. In 2-D reconnection, this conservation is easily verified. However, in three dimensions it is non-trivial to decide precisely how to characterize reconnection, much less to measure true reconnection rates. Rather than argue for any particular precise definition of reconnection, we will focus on more tangible properties of the current layer, such as magnetic energy and plasma energy. We will use the words ‘3-D reconnection’ loosely to refer to any magnetic-energy-depleting evolution of thin current sheets that, in principle, could or would undergo 2-D-like reconnection. However, any discussion of reconnecting flux or field lines will refer specifically to the 2-D-like flux-conserving process.
Flux annihilation: the utter disappearance of upstream (unreconnected) magnetic flux by unspecified means. In contrast, 2-D reconnection does not annihilate flux (it conserves flux as described above). For example, magnetic diffusion in a plasma with finite resistivity can directly annihilate flux; although this process is far too slow to explain observed magnetic energy releases (assuming neat laminar current sheets), it could be considerably enhanced, e.g. by effective turbulent magnetic diffusivity. Incidentally, the flux  $\int B_x\,{\textrm {d}y}\,\textrm {d}z$ through any
 $x$-plane in the simulation is exactly conserved – however, by virtue of the reversing magnetic field, this flux is zero, and it tells us nothing about how much flux is reconnected or annihilated.
(Upstream) flux depletion: the depletion of the upstream magnetic flux, without regard to the process (e.g. reconnection or annihilation).
3.2. Current sheet (layer) central surface
It is useful to analyse some field quantities at the current sheet ‘centre’ (in  $y$), even as the layer kinks and deforms. In the initial state, the current sheet (or layer) central surface
 $y_c(x,z,t=0)$ is the location where
 $B_x(x,y_c,z,t=0)=0$, i.e. where
 $B_x$ crosses through zero in the
 $y$ direction, reversing sign. At later times, we continue to define
 $y_c(x,z,t)$ in the same way, with the following complication. The layer may become extremely distorted by the nonlinear development of the kink instability so that it folds over on itself, resulting in multiple field reversals. Because the upstream magnetic field never changes sign,
 $B_x(x,y,z,t)$ will always reverse sign at least once along
 $y$; however, it may reverse sign an odd number of times at each layer. If there are multiple reversals in
 $y$ at some
 $(x,z)$ and time
 $t$, we take
 $y_c(x,z,t)$ to be the middle reversal (e.g. if there are three reversals,
 $y_c(x,z,t)$ will be at the second reversal).
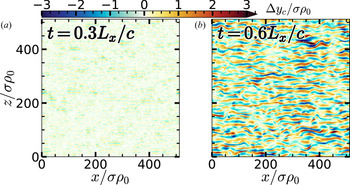
We define the displacement of the central surface,  $\Delta y_c(x,z,t) \equiv y_c(x,z,t) - y_c(x,z,0)$.
In § 5.5 we look at  $\tilde {y}_c(k_z,t)$, the Fourier spectrum of
 $\Delta y_c(x,z,t)$ in
 $z$, averaged over
 $x$, at a given time
 $t$. To find the ‘Fourier spectrum in
 $z$ averaged over
 $x$’, we take the power spectrum in
 $z$ of
 $\Delta y_c(x,z,t)$ at every
 $x$ (for a given time
 $t$), then average the power spectra over
 $x$, and take the square root. We normalize the result
 $\tilde {y}_c(k_z,t)$ so that it indicates the amplitude of the sinusoidal component with
 $k_z$. E.g. if
 $\Delta y_c(x,z,t)=A\sin (k_z z)$, then
 $\tilde {y}_c(k_z,t)=A$.
3.3. Unreconnected flux and reconnection rate
Reconnection breaks upstream (unreconnected) field lines and reconnects them in a different configuration in the downstream outflows. Defining and measuring unreconnected flux is straightforward in two dimensions using the vector potential  $A_z(x,y)$, which is constant along field lines. In three dimensions, however, it is much more difficult to define unreconnected flux precisely, and so we adopt the following practical definition. An unreconnected field line is a field line that runs from
 $x=0$ to
 $x=L_x$ without changing direction in
 $x$ (
 $B_x$ never changes sign). In two dimensions, this definition is unambiguous and almost always agrees with the method using
 $A_z$ (disagreement could occur in the rare case of an unreconnected field line with an
 $\Omega$-shaped kink; we believe such cases are negligibly rare in two dimensions, but we have not studied whether they are also rare in three dimensions). In two dimensions, a field line that runs from
 $x=0$ to
 $x=L_x$ wraps around via periodic boundary conditions exactly onto itself; therefore, this definition unambiguously determines whether the entire field line has the same sign for
 $B_x$. In three dimensions, this is not necessarily true; nevertheless this method captures the most obviously unreconnected upstream field lines with
 $|B_y|\ll |B_x|$, that run across the simulation box with little deflection in the
 $y$ direction.
Specifically, we trace a field line from each grid node  $(0,y,z)$ in the
 $x=0$ plane, following it in the
 $+x$ direction; if the field line ever reverses direction in
 $x$, then the field line is considered to be ‘reconnected.’ If the sign of
 $B_x$ does not reverse, then the field line must eventually reach
 $x=L_x$, at which point we stop and consider the field line to be ‘unreconnected.’ The unreconnected flux is then estimated as
 $\sum _{y,z} B_x(0,y,z) \Delta y \Delta z$ where the sum is over nodes
 $(y,z)$ on unreconnected field lines, and
 $\Delta y \Delta z$ is the cell face area. We add the flux for all unreconnected field lines between the central surfaces of the two layers (cf. § 3.2) to obtain the total unreconnected flux.
During this process of tracing field lines, we note the index of every cell that is penetrated by an unreconnected field line and consider any such cell to be part of the ‘upstream’ region; any cell not penetrated by any unreconnected field line is considered part of the ‘layer.’ In this way we can calculate, for example, the magnetic energy in upstream and layer regions. The boundary between regions of unreconnected and reconnected field lines is (an approximation of) the separatrix, which can be clearly seen in figure 4; (in two dimensions, at least) the separatrix bounds magnetic islands (O-points or plasmoids) and goes through X-points.
This analysis is rigorously based on 2-D reconnection; in three dimensions it still paints a useful picture, even though the notions of ‘unreconnected’ and ‘reconnected’ are no longer precisely well defined, and the analysis does not distinguish between reconnection and annihilation of upstream flux (i.e. between reconnected flux and annihilated flux). In two dimensions, any field line that is not unreconnected is reconnected, forming a closed loop in a magnetic island (when  $B_z$ is ignored). Moreover, we find that in two dimensions, flux is conserved – specifically, the flux between the major O-points of the two layers (in the double-periodic simulation) is conserved. This flux can be divided into two parts: the upstream unreconnected flux between the two layers, plus the reconnected flux between the major O-point and separatrix for each layer, and the sum of these parts remains constant, at least within our measurement precision, which is better than 1 per cent of the initial flux. Therefore, in two dimensions, flux is not annihilated or destroyed (in a more resistive plasma, flux would be annihilated; and even in a ‘collisionless’ PIC simulation, numerical resistivity will eventually annihilate flux, but only over extremely long times). In three dimensions, field lines that are ‘not unreconnected’ do not necessarily form a closed loop around an O-point or flux rope, but again, for brevity we will still use the term ‘reconnected’ for such field lines. Periodically we include quotation marks around ‘reconnected’ as a reminder that it really means ‘not unreconnected.’ In addition (spoiler alert!), we will find that in three dimensions, flux is not conserved in the way it is in two dimensions: some flux is outright annihilated.
When we refer to a ‘reconnection rate’, we mean the rate at which the upstream magnetic flux decays – regardless of whether this flux depletion occurs due to reconnection (as always in 2-D collisionless reconnection) or to annihilation (as might be happening in 3-D simulations). The reconnection rate represents the rate at which upstream flux is changing, and therefore represents an electric field along an X-line by Faraday's law, if a suitable X-line (or reasonable approximation) exists.
We use the symbol  $\beta _\textrm {rec}$ for the dimensionless reconnection rate normalized to
 $cB_0$:
 $\beta _\textrm {rec} \equiv -(cB_0L_z)^{-1}\,\textrm {d}\psi /\textrm {d}t$, where
 $\psi (t)$ is the flux upstream of one layer (or half the flux between the two layers). Usually we obtain values of
 $\beta _\textrm {rec}$ averaged over some time – for example the time over which
 $\psi (t)$ falls from
 $0.9\psi _0$ to
 $0.8\psi _0$, or alternatively, 0.8–0.7
 $\psi _0$ (the choice between intervals often depends on whether all simulations being compared actually reached
 $0.7\psi _0$). Sometimes we also quote
 $(c/v_A)\beta _\textrm {rec}$, the dimensionless reconnection rate normalized to
 $B_0 v_A$, where
 $v_A$ is the Alfvén velocity.
3.4. Energy
Energy is a powerful diagnostic because of its physical importance, because it is conserved (to a good approximation in these simulations), and because it is generally straightforward and unambiguous to measure. We will calculate various energy components integrated over the entire simulation volume (at any given time  $t$), including total particle energy
 $U_\textrm {plasma}(t)$ and electric-field energy
 $U_{E}(t)$. The component of most frequent interest is the magnetic field energy
 $U_B(t)$, and more specifically the transverse magnetic field energy,
 $U_{Bt}(t)\equiv \int \, \textrm {d}V\, (B_x^2+B_y^2)/8{\rm \pi}$; it is mainly
 $U_{Bt}$ that gets converted to particle energy
 $U_\textrm {plasma}$, while
 $U_{Bz}\equiv U_{B}-U_{Bt}$ remains relatively constant (or at least negligibly small) over the course of a simulation. For zero guide field,
 $U_{Bt}\approx U_B$ and it does not much matter which we use; when comparing simulations with different guide fields, however, it is more illuminating to compare
 $U_{Bt}$.
We also calculate the upstream magnetic energy  $U_{Bt,{\rm up}}$ in transverse magnetic field components of unreconnected field lines, and then define the magnetic energy in the layer (i.e. in ‘reconnected’ field lines) to be
 $U_{Bt,{\rm layer}}=U_{Bt} - U_{Bt,{\rm up}}$ (see § 3.3).
3.5. Onset time $t_\textrm {onset}$

Sometimes the initial current sheet configuration strongly affects the time it takes reconnection to start; when comparing time evolution of simulations with different initial configurations, it is sometimes helpful to compare different cases relative to the onset time rather than  $t=0$. We define the onset time as the time
 $t_\textrm {onset}$ when the transverse magnetic energy
 $U_{Bt}(t)$ has declined by 1 per cent from its initial value
 $U_{Bt0}$. Although this value is somewhat arbitrary, no results will depend strongly on this choice, as long as it is used consistently. Occasionally the time axis of graphs will be shifted by
 $t_\textrm {onset}$ to allow more revealing comparison between different simulations, which may have similar time evolution apart from different onset times.
3.6. Bulk Velocity
We compute electron bulk velocities  $\boldsymbol {v}_e=\boldsymbol {J}_e/\rho _e$ (in each grid cell), where
 $\boldsymbol {J}_e$ and
 $\rho _e$ are the current and charge density due to electrons; similarly, the positron velocity is
 $\boldsymbol {v}_i= \boldsymbol {J}_i/\rho _i$. The plasma velocity is then computed as the average of electron and ion velocities,
 $\boldsymbol {v}\equiv (\boldsymbol {v}_e + \boldsymbol {v}_i)/2$. More accurately, this average should be weighted by the mass (or
 $\gamma m$) of particles in each cell; however, in this paper, quasineutrality and the symmetry between electrons and positrons make the simple average a reasonable approximation.
3.7. Particle energy spectra and power-law fitting
Particle energy distributions  $f(\gamma )$ are shown integrated over the entire simulation box at single time snapshots (where the Lorentz factor
 $\gamma$ is a proxy for particle energy
 $\gamma m_e c^2$). The energy spectra often display power laws
 $f(\gamma )\sim \gamma ^{-p}$ extending to high energies (well above the average energy).
We determine the power-law index  $p$ by finding the longest, straightest segment on a log-log plot (Werner et al. Reference Werner, Uzdensky, Begelman, Cerutti and Nalewajko2018). We compute the local slope,
 $p(\gamma )=-\textrm {d}\ln f/\textrm {d}\ln \gamma$ and search exhaustively for the interval
 $[\gamma _1,\gamma _2]$ with the largest
 $\gamma _2/\gamma _1$ such that
 $p(\gamma )$ remains within a range of
 $\Delta p$ over the entire interval. We then choose ‘the’ power-law index
 $p$ to be the median
 $p(\gamma )$ over
 $[\gamma _1,\gamma _2]$. We do this separately for
 $\Delta p=$0.1, 0.2 and 0.4, as well as using spectra at different nearby times, considering variation in
 $p$ – whether due to time variation or choice of
 $\Delta p$ – as uncertainty in the measurement. In this paper, we display ‘error bars’ on
 $p$ comprising the middle 68 per cent of all the values of
 $p$ measured.
To find the cutoff of the high-energy power law, we fit  $f(\gamma )$ over
 $[\gamma _1,\gamma _2]$ to the form
 $A\gamma ^{-p}$, where
 $p$ is determined as above (thus only the normalization
 $A$ must be found). We then consider the cutoff
 $\gamma _c$ to be the energy at which
 $f(\gamma _c)=e^{-1} A\gamma _c^{-p}$.
4. Two-dimensional reconnection with moderate magnetization: basic evolution and NTPA
Before exploring 3-D reconnection, we investigate reconnection – in ultrarelativistically hot pair plasma with  $\sigma _h=1$ – in two dimensions, systematically varying a number of parameters. We will begin with an overview of 2-D reconnection (§ 4.1); then we will investigate the effects of different initial current sheet configurations in § 4.2. In § 4.3 we study system-size effects, and finally in § 4.4 we report on the effects of guide magnetic field.
This 2-D reconnection study serves multiple purposes. First, it is of interest in its own right to characterize 2-D reconnection in the ultrarelativistically hot  $\sigma _h=1$ regime (most previous reconnection studies have focused on
 $\sigma _h \ll 1$, usually in non-relativistic electron–ion plasma, or
 $\sigma _h \gg 1$). Second, much larger simulations are possible in two dimensions; only in two dimensions, therefore, can we really explore system-size dependence. And last, to determine whether 3-D reconnection is different, we need to compare with 2-D simulation; this 2-D study provides a baseline for the subsequent 3-D study (§ 5).
4.1. Overview of 2-D reconnection with $\sigma _h=1$

We begin by reviewing the familiar behaviour of plasmoid-dominated reconnection in two dimensions, for a single representative simulation with  $L_x=1280\sigma \rho _0$; other initial parameters are:
 $B_{gz}=0$,
 $\eta =5$,
 $\beta _d=0.3$,
 $\delta =(2/3)\sigma \rho _0$,
 $a=0$. This simulation exhibits the familiar behaviour of 2-D plasmoid-dominated reconnection – it is qualitatively similar to plasmoid-dominated reconnection at small and large
 $\sigma _h$. The simulation lingers in its initial state until the tearing instability triggers reconnection, resulting in a chain of plasmoids (magnetic islands or O-points) in each layer. (In the following, we describe just one of the layers in the double-periodic system; both layers behave qualitatively similarly.) Reconnection occurs at X-points in thin, elementary current sheets between plasmoids: at X-points, upstream magnetic field lines are broken, and reconnected in a different topology, with reconnected field lines wrapping around plasmoids in the reconnection outflows. In this process, some of the upstream magnetic energy is converted to particle/plasma energy, while some of it ends up as magnetic energy in the layer (i.e. in ‘reconnected’ field in plasmoids). Secondary tearing breaks up the elementary current sheets when they become too long and too thin, detaching the small plasmoids from the X-point that fed them magnetic energy and reconnected flux. Thereafter, those plasmoids no longer grow via reconnection, but instead grow by merging with other plasmoids via the coalescence instability, which conserves the flux around O-points. A hierarchy of different-sized plasmoids thus develops, and eventually a single monster plasmoid dominates the simulation, continuing to grow as it consumes (i.e. merges with) smaller plasmoids. If
 $L_y/L_x$ is large enough, this major plasmoid eventually grows to a size of order
 $L_x$, and reconnection can no longer continue; the angle of the magnetic separatrix at the major X-point opens to 90
 $^{\circ }$, and reconnection effectively stops (actually, systems often oscillate with low amplitudes about the final state, with magnetic energy and flux sloshing between the major plasmoid and the upstream). If
 $L_y \gg L_x$ (even if
 $L_y \gtrsim 2L_x$), there will still be significant upstream ‘unreconnected’ magnetic field that could in principle be reconnected were it not prevented from doing so by reaching a stable magnetic configuration (at least on reconnection time scales; magnetic diffusion might deplete additional magnetic energy on much, much longer time scales).
During this evolution, upstream magnetic flux is reconnected and some upstream magnetic energy is converted into plasma energy, while some ends up permanently stored in the magnetic field of the major plasmoid. To describe this process more quantitatively, we will rely heavily on several important diagnostics. These will be essential throughout the rest of the paper, as we explore reconnection over a very large parameter space, to help us compare and contrast reconnection with different parameters including  $a$,
 $\eta$,
 $\beta _d$,
 $L_x$,
 $B_{gz}$ and (in three dimensions)
 $L_z$. We will measure, for example, the amount of magnetic flux that is reconnected over time (cf. § 3.3). However, perhaps of even more importance is the behaviour of various energy components – for example, the plasma or magnetic energy vs time (cf. § 3.4). In addition, we further decompose the plasma energy into the energy distribution of particles to distinguish thermal heating from NTPA (cf. § 3.7). In the following, we describe these diagnostics for the single representative simulation.
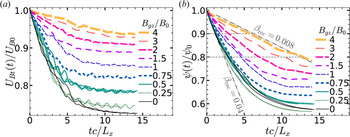
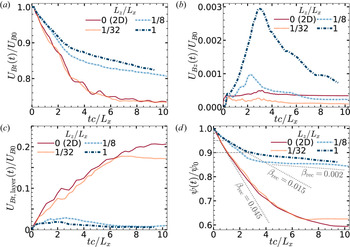
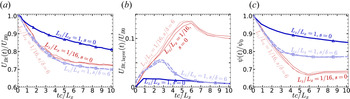
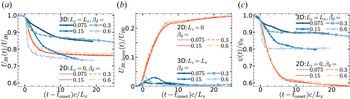
The behaviour of magnetic flux and energy is qualitatively similar to that observed in other 2-D regimes, such as  $\sigma _h\gg 1$ (e.g. Guo et al. Reference Guo, Li, Daughton and Liu2014; Werner et al. Reference Werner, Uzdensky, Cerutti, Nalewajko and Begelman2016; Werner & Uzdensky Reference Werner and Uzdensky2017; Werner et al. Reference Werner, Uzdensky, Begelman, Cerutti and Nalewajko2018). Figure 1 shows unreconnected flux vs time as well as the energy (and energy changes) vs time in various components, including the energy in magnetic fields and particles. The unreconnected (upstream) magnetic flux
 $\psi (t)$ decreases over the course of reconnection, finally down to approximately 55 per cent of its initial value (i.e. reconnecting 45 per cent of upstream flux). (We note that these values are specific to this representative simulation; reconnection with other parameters may yield different values while being qualitatively similar.) During this time, the magnetic energy falls to approximately 70 per cent of its initial value, with the 30 per cent loss converted almost entirely to plasma energy. This occurs within a time of roughly 8–12
 $\:L_x/c$ over which the rate of reconnection continually slows (in this closed system). The dimensionless reconnection rates (cf. § 3.3), averaged over the time it takes for unreconnected flux
 $\psi (t)$ to fall from
 $0.9\psi _0$ to
 $0.8\psi _0$, and from
 $0.8\psi _0$ to
 $0.7\psi _0$ (as measured in Werner et al. Reference Werner, Uzdensky, Begelman, Cerutti and Nalewajko2018), are
 $\beta _\textrm {rec}\equiv -(cB_0 L_z)^{-1} \dot {\psi }=0.032$ and
 $0.022$, respectively (here, the dimensionless rate is normalized to
 $B_0 c$). Normalized to
 $B_0 v_A$ instead of
 $B_0 c$, where
 $B_0 v_A=B_0 c\sqrt {\sigma _h/(1+\sigma _h)}=B_0 c/\sqrt {2}$, the reconnection rates over these same intervals are
 $(c/v_A)\beta _\textrm {rec}=0.045$ and
 $0.031$. The normalized-to-
 $B_0 v_A$ reconnection rate around 0.03–0.05 is of the order of, but less than the oft-cited nominal value of 0.1 for fast reconnection (Cassak, Liu & Shay Reference Cassak, Liu and Shay2017) – a value that is realized for ultrarelativistic reconnection with
 $\sigma _h \gg 1$.
Panel (a) shows the unreconnected flux (normalized to the initial unreconnected flux  $\psi _0$) diminishing over time as reconnection occurs. Horizontal dashed lines mark the levels
 $\psi =0.9\psi _0$,
 $0.8\psi _0$ and
 $0.7\psi _0$; the dimensionless reconnection rates averaged over each of these
 $0.1\psi _0$ drops are
 $\beta _\textrm {rec}=$0.03 and 0.02 (cf. § 3.3), and dashed lines with those slopes are drawn. Panel (b) shows the energy in various components vs time (normalized to
 $\int \,\textrm {d}V \, B_0^2/8{\rm \pi}$), and panel (c) shows the changes in those components from their initial values. Energy components shown are total energy (
 $U_\textrm {total}$, dash-dotted black line), magnetic (
 $U_B$, solid blue), plasma/particle (
 $U_\textrm {plasma}$, dashed green) and electric (
 $U_E$, dotted red – in panel (b),
 $U_E$ is magnified by a factor of 20).

By way of comparison, we note that, with the same aspect ratio  $L_y/L_x=2$, a similar set-up with
 $\sigma _h\gg 1$ depletes roughly 40 per cent of magnetic field energy (Werner & Uzdensky Reference Werner and Uzdensky2017) and reconnects 55 per cent of the initial flux (Werner et al. Reference Werner, Uzdensky, Begelman, Cerutti and Nalewajko2018). Energy conversion in high-
 $\sigma _h$ reconnection occurs within approximately 3
 $\:L_x/c$, with normalized reconnection rates around 0.10–0.12.
An important aspect of 2-D reconnection is that the upstream field lines are indeed broken and reconnected in the following precise sense: the decrease in upstream flux equals the increase in flux around the O-points in magnetic islands (plasmoids). In 2-D simulations we can measure these fluxes accurately using the  $z$-component of the magnetic vector potential (see § 3.3), and we find that the sum of these fluxes – which is precisely equivalent to the total flux between the major O-points in each layer – is conserved to better than 1 per cent. This is not surprising; the only way the total flux can change is (by Faraday's law) if
 $E_z\neq 0$ at the major O-points (e.g.
 $E_z$ could be non-zero due to resistivity, which would allow annihilation of magnetic flux via magnetic diffusion, but typically the rate of annihilation is very slow, especially in a collisionless plasma).
The reconnection rate measurements quoted in this paper are defined in terms of an upstream field of  $B_0$, although in these closed systems, the actual (far) upstream field diminishes over time (although not very much for large systems). For simulations presented in this paper, the upstream magnetic field decays only to
 $\approx 0.9B_0$, which affects the calculation less than the measurement uncertainty. There are also questions about whether ‘the upstream field’ should be far upstream or at some upstream point closer to the current sheet (Cassak et al. Reference Cassak, Liu and Shay2017; Liu et al. Reference Liu, Hesse, Guo, Daughton, Li, Cassak and Shay2017), and the difference between far upstream and near upstream might potentially depend on
 $\sigma _h$. However, we must leave a better understanding of the precise
 $\sigma _h$-dependence of the 2-D reconnection rate to future work.
When  $\sigma _h$ is not large, particles cannot gain much energy on average during reconnection. For example, for
 $\sigma _h=1$ and 30 per cent of magnetic energy depleted, the average particle energy (averaged over the entire simulation) increases by a relative fraction of only
 $\Delta \gamma /\gamma _b = 0.30 (2/3) \sigma _h = 0.20$ (where
 $\gamma _b = 3\theta _b = 0.75\sigma$ is the initial average Lorentz factor). Nevertheless, some particles reach energies well above the average energy,
 $\bar {\gamma } \approx 0.7$–
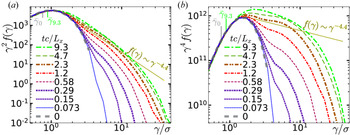
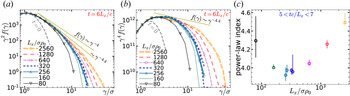
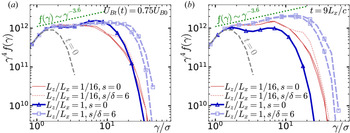
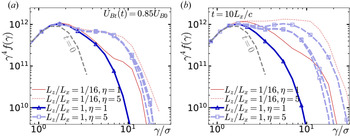
 $0.9\sigma$, as shown by the particle energy spectra in figure 2. Reconnection in the
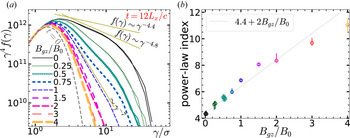
 $\sigma _h=1$ regime clearly generates NTPA; a high-energy non-thermal power-law
 $f(\gamma )\sim \gamma ^{-p}$ becomes apparent within a time of 1–2
 $L_x/c$, with approximately the same power-law index
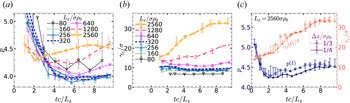
 $p\approx 4$ as at later times; the power law extends up to a cutoff energy exceeding
 $4\sigma$ (cf. Werner et al. Reference Werner, Uzdensky, Cerutti, Nalewajko and Begelman2016). The power-law index of
 $p\approx 4$ is quite steep; to distinguish small changes (when comparing other simulations), we will usually graph
 $\gamma ^4 f(\gamma )$, so that if
 $p$ were exactly 4, the graph would be a horizontal line. The high-energy cutoff of the power law has been observed, for simulations with high
 $\sigma _h\gg 1$ and very large
 $L_x$, to grow rapidly to an energy
 $\sim 4\sigma$ (Werner et al. Reference Werner, Uzdensky, Cerutti, Nalewajko and Begelman2016), and then to continue to grow slowly (sublinearly) in time (Petropoulou & Sironi Reference Petropoulou and Sironi2018; Hakobyan et al. Reference Hakobyan, Petropoulou, Spitkovsky and Sironi2021); our results are consistent with this.
The particle energy spectra  $f(\gamma )$ at logarithmically spaced times, compensated by
 $\gamma ^2$ to show the relative amount of energy stored in different energy ranges (a) and by
 $\gamma ^4$ to enhance differences (b). Here, particle energy is
 $\gamma m_e c^2$. The average particle energy
 $\bar {\gamma }$ is indicated at
 $t=0$ and
 $tc/L_x=9.3$. A power law
 $\gamma ^{-4.4}$ is also shown (in panel (b),
 $f\sim \gamma ^{-4}$ would be horizontal).

Importantly, the high-energy cutoff measured in our simulations is far below the extreme particle acceleration limit for this simulation size and duration – i.e. below the energy a particle could gain in the nominal reconnection electric field of  $E_\textrm {rec}$ over the simulation duration
 $T$ (which is usually proportional to simulation size
 $L_x$). Such an ‘extremely accelerated’ particle would gain maximum energy
 $m_ec^2 \Delta \gamma _\textrm {ext} = eE_\textrm {rec}cT$. We can estimate
 $\Delta \gamma _\textrm {ext}$ using
 $\beta _\textrm {rec}$ to relate
 $E_\textrm {rec}$ and
 $B_0$, i.e.
 $E_\textrm {rec}=\beta _\textrm {rec}B_0$. Since
 $m_e c^2/eB_0\equiv \rho _0$,
 $\Delta \gamma _\textrm {ext} \sim \beta _\textrm {rec} cT/\rho _0 \sim 0.02 (cT/L_x) L_x/\rho _0$. In our simulations,
 $\beta _\textrm {rec}$ decreases over time (as reconnection slows to a stop), but above we measured
 $\beta _\textrm {rec}\approx 0.02$ in the middle of active reconnection; and in this simulation,
 $L_x=1280\sigma \rho _0$, so
 $\Delta \gamma _\textrm {ext} \sim 26 (cT/L_x)\sigma$. Thus, after
 $T\sim 10L_x/c$, the maximum energy gain would be around
 $\Delta \gamma _\textrm {ext}\sim 250 \sigma$. However, rather than estimate
 $\beta _\textrm {rec}$ and the active reconnection time
 $T$, it is convenient to consider that by Faraday's law,
 $\int _0^T E_\textrm {rec}\,\textrm {d}t = -\Delta \psi /(cL_z)$ where
 $\Delta \psi$ is the change in unreconnected upstream flux; in a 2-D simulation, the simulation size
 $L_z$ in the unsimulated third dimension is arbitrary, but the upstream flux is also proportional to
 $L_z$ – the flux upstream of the initial current sheet is
 $\psi _0 \approx B_0 L_z L_y/4$. Therefore,
 $\Delta \gamma _\textrm {ext} \approx (L_y/4 L_x) (\Delta \psi /\psi _0) (eB_0 L_x/m_e c^2) = 0.5(0.45)(L_x/\rho _0)$, or
 $\Delta \gamma _\textrm {ext}\approx 0.2 (1280\sigma )\approx 250\sigma$.
In this simulation, we observe  $\Delta \gamma \lesssim 40\sigma$, far below the extreme acceleration limit,
 $\Delta \gamma _\textrm {ext}\approx 250 \sigma$. However, some particles undergo extreme acceleration up to at least
 $\gamma \sim 4\sigma$ (but not beyond
 $\gamma \approx 20\sigma$) in a time consistent with constant acceleration in
 $E_\textrm {rec}$. We can infer from figure 2 that a tiny fraction of particles reach nearly
 $\gamma \approx 20\sigma$ by time
 $0.44L_x/c$. At this time,
 $\Delta \psi /\psi _0 = 0.039$, so we estimate
 $\gamma _\textrm {ext} = 0.5(0.039)(1280\sigma )=25\sigma$, close to the observed
 $\gamma \approx 20\sigma$ (which we emphasize is not the power-law cutoff, but the maximum energy gained by any particle in the simulation). This suggests that particles are in fact ‘extremely accelerated’ up to some energy less than but of the order of
 $\gamma \approx 20\sigma$. However, no particle ever exceeds
 $\gamma \approx 40$ significantly, even after much longer times. We note that: (i) we measured
 $\Delta \psi$ with a time cadence of
 $0.44 L_x/c$, so we cannot examine extreme acceleration on smaller time scales, and (ii) ideally we would prefer to know about extreme acceleration in the middle of the simulation rather than at the beginning, but we present this result for the very beginning because it is the only time that we can know that a particle with
 $\gamma \approx 20$ accelerated to that energy within
 $0.44L_x/c$. Thus our results are consistent with particles experiencing extreme acceleration up to an energy around
 $\gamma \sim 4\sigma$ (Werner et al. Reference Werner, Uzdensky, Cerutti, Nalewajko and Begelman2016), and experiencing slower acceleration thereafter (as described by Petropoulou & Sironi Reference Petropoulou and Sironi2018; Hakobyan et al. Reference Hakobyan, Petropoulou, Spitkovsky and Sironi2021).
Incidentally, we also note that all particle gyroradii are much smaller than the system size. A particle with energy  $\gamma$ has gyroradius
 ${\sim }\gamma \rho _0$ (in field
 $B_0$), and so a particle would need
 $\gamma =640 \sigma$ for its gyroradius to equal
 $L_x/2$; therefore, the system size is much larger than the gyro-orbits of even the most energetic particles.
In the rest of this paper, we will be comparing the flux reconnected vs time, as well as the conversion of magnetic to plasma energy and the resulting particle energy spectra, for reconnection simulations with different initial parameters (including 3-D simulations with different lengths  $L_z$). In the following subsections, we consider 2-D simulations all with the same upstream plasma conditions as in this subsection, but with different initial current sheet configurations (§ 4.2), and different system sizes (§ 4.3); then, we consider the addition of different guide-field strengths (§ 4.4). We will find that for large systems, the initial current sheet configuration and system size
 $L_x$ have relatively weak effects on reconnection, including on energy conversion and NTPA; in contrast, (sufficiently strong) guide magnetic field will significantly slow energy conversion and inhibit NTPA.
4.2. Two-dimensional reconnection: dependence on initial current sheet configuration
In this subsection we show that 2-D reconnection behaviour is largely (but not completely) determined by the background (upstream) plasma and not the configuration of the initial current sheet. We will compare results from 2-D simulations with varying initial magnetic perturbation strength  $a$, and varying initial current sheet parameters (i.e. density
 $n_{d0}$ or, equivalently,
 $\eta =n_{d0}/n_{b0}$, temperature
 $\theta _d$, drift speed
 $\beta _d c$ and half-thickness
 $\delta$). All simulations in this subsection have identical background plasma (i.e.
 $\sigma =10^4$,
 $\sigma _h=1$, hence upstream
 $\beta _\textrm {plasma}=0.5$, and
 $B_{gz}=0$, as well as
 $L_y/L_x=2$).
The initial magnetic field perturbation  $a$ (cf. (2.2)), can be varied independently of all other parameters, as in the following substudy (2D-a); however, increasing
 $a$ shifts the system away from the Harris equilibrium. In contrast, we always maintain the initial equilibrium when altering
 $\eta$,
 $\theta _d$,
 $\beta _d$ and
 $\delta$. The equilibrium satisfies pressure balance, or
 $\eta \theta _d / \gamma _d = \sigma /2$, and Ampere's law, which requires
 $\delta = \sigma \rho _0 / (\eta \beta _d)$. Thus, the initial current sheet, though fully specified through four parameters, has only two independent degrees of freedom in this study; usually we specify
 $\eta$ and
 $\beta _d$. For reference we have listed the relevant parameters corresponding to different values of
 $\eta$ and
 $\beta _d$ in table 1.
It is useful to compare the sheet half-thickness  $\delta$ with the characteristic gyroradii of the upstream plasma and the drifting (initial current sheet) plasma. The characteristic gyroradius of the upstream plasma is
 $\rho _b=3\theta _b\rho _0=(3/4)\sigma \rho _0\sim \sigma \rho _0$; the average gyroradius of the drifting plasma is
 $\rho _d=3\theta _d\rho _0=3\gamma _d/(2\eta )$. The ratio of sheet thickness to upstream plasma scales is
 $\delta /\sigma \rho _0 = 1/(\eta \beta _d)$, and the ratio to drifting plasma scales is
 $\delta /\rho _d=2/(3\gamma _d\beta _d)$. In substudy (2D-b), below, we vary
 $\eta$ while keeping
 $\beta _d$ constant, which changes
 $\delta$ with respect to upstream scales but not with respect to drifting plasma scales. On the other hand, in substudy (2D-c), we vary
 $\beta _d\propto \eta ^{-1}$, changing
 $\delta /\rho _d$ but leaving
 $\delta /\sigma \rho _0$ constant.
Case (2D-a): varying the initial perturbation. For  $a=0$, the magnetic field lines are initially entirely parallel to
 $x$. Increasing
 $a$ perturbs the field so that there is a magnetic island and an X-point in the layer. As described in § 2, when
 $a=1$, the initial island half-height
 $s$ (the maximum height of the separatrix above the initial midplane) equals the current sheet half-thickness,
 $s=\delta$; for
 $a\lesssim 1$, the separatrix that bounds the island is contained within the initial layer. We investigate the effect of varying
 $a$ over a wide range, for two different initial current sheets: the first (
 $\beta _d=0.3$,
 $\eta =5$,
 $\delta =(2/3)\sigma \rho _0$,
 $\theta _d=0.10\sigma$) was chosen to be like most simulations in this paper, marginally resolving the initial sheet with
 $\delta /\Delta x=2$; the second (
 $\beta _d=0.3$,
 $\eta =1$,
 $\delta =(10/3)\sigma \rho _0$,
 $\theta _d=0.52\sigma$) was chosen to resolve the current sheet with
 $\delta /\Delta x=10$. In both cases we used modest system sizes with
 $L_x=320\sigma \rho _0$. To help distinguish between the effect of
 $a$ and stochastic variation, we ran two simulations for each
 $a$, identical except for random initial particle velocities (the source of randomness is discussed later in detail in § 5.2).
For the denser, thinner sheet ( $\beta _d=0.3$,
 $\eta =5$, used in most simulations here), we ran simulations with
 $a \in \{$0, 0.22, 0.55, 1.1, 2.2, 5.5, 11, 22, 55, 110
 $\}$, corresponding to
 $s/\delta \in \{$0, 0.44, 0.72, 1.1, 1.6, 3.1, 5.4, 10, 23, 43
 $\}$, respectively. For
 $a < 0.3$, we note that
 $s < \Delta x$, so the simulation can hardly tell the difference between
 $a=0$ and
 $a=0.22$; and for
 $a=110$, the separatrix extends out to
 $s=43\delta =29 \sigma \rho _0 \approx 0.1L_x$. In figure 3(a) we observe that the evolution of magnetic energy vs time is nearly the same for the two simulations with
 $a < 0.3$; it is also the same, up to stochastic variation, within the group of simulations with
 $0.55 \lesssim a \lesssim 22$. The simulations with
 $a<0.3$ exhibit slightly slower magnetic energy conversion for
 $1 \lesssim tc/L_x \lesssim 4L_x/c$ than the simulations with
 $0.55 \lesssim a \lesssim 22$, but by
 $t\gtrsim 5L_x/c$ they have all converted the same amount of energy, so while noticeable, this is a very minor difference. For
 $a\gtrsim 55$ (very large perturbations), we observe an increasingly quick onset of reconnection and more rapid magnetic depletion. The particle energy spectra in figure 3(b) are all very similar (considering that differences are enhanced by showing
 $\gamma ^4 f(\gamma )$ instead of
 $f(\gamma )$), although very large perturbations result in an almost imperceptibly harder spectrum with a slightly smaller fraction of particles reaching the very highest energies. We conclude that for all but very large perturbations, the initial perturbation does not have a very substantial effect on energy conversion or NTPA.
(a) Transverse magnetic energy vs time, and (b) electron energy spectra  $f(\gamma )$, compensated by
 $\gamma ^4$, at times
 $t$ when
 $U_{Bt}(t)=0.75U_{B0}$ – marked by the horizontal grey line in (a) – for different initial magnetic field perturbations in 2-D simulations with an initially dense, thin current sheet (
 $\eta =5$,
 $\delta /\sigma \rho _0=2/3$). Panels (c,d) show the same for a less dense, thicker layer (
 $\eta =1$,
 $\delta /\sigma \rho _0=10/3$), with spectra at
 $U_{Bt}(t)=0.77U_{B0}$.

For the less dense, initially thick current sheet, ( $\beta _d=0.3$,
 $\eta =1$,
 $\delta =(10/3)\sigma \rho _0$,
 $\theta _d=0.52\sigma$), we explored
 $a \in \{$0, 0.04, 0.11, 0.22, 0.44, 1.1, 2.2, 4.4, 11, 22
 $\}$, corresponding to separatrix heights
 $s/\delta \in \{$0, 0.2, 0.31, 0.44, 0.63, 1, 1.6, 2.5, 5.1, 9
 $\}$. The results are shown in figure 3(c,d). Here,
 $s>\Delta x$ as long as
 $a > 0.011$ (i.e. for all the non-zero
 $a$ used); for
 $a=22$, the separatrix extends to
 $s=9\delta = 30\sigma \rho _0\approx 0.1L_x$. The less dense, thicker sheet leads to a slower onset of reconnection; increasing the initial perturbation strength tends to hasten reconnection onset. However, once reconnection is triggered, the energy evolves very similarly for zero and large perturbations, as seen in figure 3(c), which shows magnetic energy vs time, shifted relative to
 $t_\textrm {onset}$, the time at which the magnetic energy has fallen by 1 per cent (cf. § 3.5). With this time shift, the magnetic energy curves are almost identical in all cases except for the largest perturbation,
 $a=22$. Not surprisingly, the particle spectra in figure 3(d) are similarly identical (within stochastic variation). We again conclude that the strength of perturbation (at least for
 $a\lesssim 20$) has negligible effect on energy conversion and NTPA – aside from having a strong effect on the time to reconnection onset.
For both overdensities  $\eta =1$ and
 $\eta =5$, the initial perturbation has significant consequences for the evolution of the plasmoid hierarchy, even though this does not seem to alter the overall energy conversion rate and NTPA. Without perturbation (figure 4a,c), a number of roughly equal-sized plasmoids form at the onset of reconnection, with sizes determined by the fastest-growing wavelength of the tearing instability. These plasmoids undergo the coalescence instability and merge in pairs, resulting in a smaller number of larger plasmoids, each of which contains a similar fraction of the initially drifting particles that made up the initial current sheet. In contrast, even a very small initial perturbation will favour one plasmoid (the ‘major’ plasmoid), which is always larger than the others (figure 4b,d); it may contain many or most of the initially drifting particles. In this case, subsequent plasmoid mergers tend to be between different-sized plasmoids; plasmoids form at the major X-point, and move toward the major plasmoid (with mergers between smaller plasmoids sometimes occurring before they reach the major plasmoid). We note that the final state has just a single monster plasmoid, regardless of initial perturbation.
Magnetic field lines superimposed over the density  $n_{de}$ of the initially drifting electrons that form the initial current sheet (i.e. excluding background electrons), for cases (a,c) without an initial magnetic perturbation (
 $a=0$), and (b,d) with a small initial perturbation
 $a=5.5$ or
 $s/\delta =3$ (cf. figure 3a), at times
 $t=0.44L_x/c$ (a,b) and
 $t=1.2L_x/c$ (c,d). In both cases, the drifting particles are well contained in plasmoid cores. With zero perturbation (a,c), the first plasmoids formed are roughly equal in size, and they generally merge in pairs so that at any time, there is some number of equal-sized largest plasmoids, each containing a similar fraction of the drift particles. In contrast, a small perturbation (b,d) favours one plasmoid, which remains always larger than all other plasmoids, and rapidly gathers most and then all of the drifting particles. Magnetic field lines in the layer (i.e. within the separatrix) are solid green, with the separatrix being solid cyan; upstream of the separatrix, field lines are dashed blue. These simulations have size
 $L_x=320\sigma \rho _0$, with an initially thin current sheet,
 $\delta =(2/3) \sigma \rho _0$.

Summarizing case (2D-a), we see that (for  $L_x\gtrsim 320\sigma \rho _0$) the initial perturbation (if not terribly large, i.e.
 $a\lesssim 20$, or
 $s/\delta \lesssim 9$) does not significantly alter global energy evolution (after reconnection onset) or NTPA. However, the initial perturbation can reduce the time it takes reconnection to start, and it can also have a significant effect on the nature of plasmoid formation and subsequent evolution. Similar differences in plasmoid evolution caused by artificial triggering with a locally reduced pressure have been previously studied in 2-D semirelativistic electron–ion reconnection (Ball et al. Reference Ball, Sironi and Özel2019); there NTPA was found to be similarly insensitive to triggering, at least for weak guide field.
Case (2D-b): varying current sheet density  $\eta$ with fixed
 $\beta _d=0.3$; i.e. varying
 $\delta /\sigma \rho _0$ for fixed
 $\delta /\rho _d=2.1$. We now look at the effects of different initial current sheets, keeping
 $\beta _d=0.3$ constant and varying
 $\eta \in \{$0.5, 1, 3.1, 5, 10
 $\}$ (considering
 $\eta < 1$ is unusual in reconnection research, but we include
 $\eta =0.5$ to show that it is not that different from
 $\eta =1$, although it does start to indicate a trend for the limit
 $\eta \rightarrow 0$). Table 1 shows how other quantities such as
 $\delta$ vary as
 $\eta$ is varied in this study. Increasing
 $\eta$ directly increases the current sheet density
 $n_{d0}$ (relative to the upstream plasma density
 $n_{b0}$, which remains the same). As
 $\eta$ increases, the temperature
 $\theta _d$ decreases to maintain pressure balance across the current sheet against the upstream magnetic field,
 $\theta _d = \gamma _d \sigma / (2\eta ) \approx 0.52 \sigma /\eta$; this reduces the fundamental length scales (and hence also time scales) of the current sheet. (We note, for context, that if background plasma with
 $n_{b0}$ and
 $\theta _b$ were adiabatically compressed with adiabatic index 4/3, appropriate for relativistically hot plasma, to a density
 $n_\textrm {ad}$ and temperature
 $\theta _\textrm {ad}$ sufficient to balance the upstream magnetic pressure
 $B_0^2/8{\rm \pi}$ as well as the upstream plasma pressure
 $n_{b0}\theta _b m_ec^2$, this would yield
 $\eta _\textrm {ad}\equiv n_\textrm {ad}/n_{b0}=2.28$ and
 $\theta _\textrm {ad}/\theta _b=1.3$.)
As  $\eta$ varies (with fixed
 $\beta _d$), we have
 $\theta _d \propto \eta ^{-1}$ and so
 $\delta$ as well as the fundamental length scales of the current sheet plasma (e.g. both the gyroradius
 $\rho _d$ and collisionless skin depth
 $d_{ed}$) all scale
 $\propto \eta ^{-1}$ (as long as
 $\gamma _d \approx 1$). Therefore,
 $\delta /\rho _d=2.1$ and
 $\delta /d_{ed}=2.7$ remain constant (see table 1), although the current sheet thickness changes with respect to upstream plasma scales (e.g.
 $\rho _b=0.75\sigma \rho _0$) as well as
 $L_x$ and
 $\Delta x$.
For this investigation we use a larger system size,  $L_x=1280\sigma \rho _0$, so that
 $L_x,L_y \gg \delta$ for all
 $\delta$ explored; other fixed parameters are:
 $\beta _d=0.3$ and
 $B_{gz}=0$. We used the exact same initial magnetic field
 $\boldsymbol {B}(x,y)$ in all cases, with the same small perturbation:
 $a \delta /L_x=0.0052$ – the dependence
 $a\sim \delta ^{-1}$ ensures that the initial field is independent of
 $\delta$ – i.e.
 $s/L_x$ is fixed (cf. (2.2)). Based on (2D-a) above, we expect our conclusions for this subsection would be the same for other small perturbations, including zero perturbation.
Figure 5 shows (a) the magnetic energy evolution and (b) NTPA spectra for simulations with a range of  $\eta =0.5$–
 $10$, corresponding to
 $\delta /\sigma \rho _0=6.7$–
 $0.33$. We first note, as above, that reconnection onset is delayed by less dense, thicker current sheets, but that once magnetic energy depletion begins, energy evolution and NTPA are very similar and almost independent of
 $\eta$. However, closer examination shows a tentative trend of decreasing NTPA efficiency with decreasing
 $\eta$; this trend is very small for
 $\eta >1$, but becomes noticeable for the
 $\eta =0.5$ case (with
 $\theta _d/\theta _b=4.2$ and
 $\delta \approx 7\sigma \rho _0$), which reconnects a little slower and generates slightly less efficient NTPA. Specifically,
 $\eta =0.5$ yields a power law
 $p=4.6\pm 0.1$, whereas denser layers with
 $\eta \geq 1$ yield
 $p=4.4\pm 0.1$. Also, denser initial sheets seem to lead to slightly more overall magnetic energy depletion. This weak
 $\eta$-dependence hints at a more severe behaviour in the limit of underdense current sheets: in a simulation (not shown here) with
 $\eta =0.1$ and
 $\delta =33\sigma \rho _0$, reconnection did not even start, despite a simulation duration longer than
 $10L_x/c$ – hence no magnetic energy was depleted.
For simulations with varying  $\eta$ (hence varying initial current sheet half-thicknesses
 $\delta$; cf. table 1): (a) transverse magnetic energy vs time (shifted by
 $t_\textrm {onset}$; cf. § 3.5), and (b) electron energy spectra times
 $t$ when
 $U_{Bt}(t)=0.75 U_{B0}$ (indicated by the horizontal grey line in the left panel). Dotted grey-on-yellow lines indicate power-law slopes of 4.1 and 4.8. All simulations have size
 $L_x=1280\sigma \rho _0$.

We thus conclude that the initial current sheet density has a negligible effect on total energy conversion and NTPA efficiency as long as  $\eta \gg 0.1$; however, for small
 $\eta$, NTPA efficiency and total energy conversion decrease as
 $\eta$ decreases, and the thick, low-density current sheet may eventually become effectively stable against tearing and reconnection.
Case (2D-c): varying  $\beta _d\propto \eta ^{-1}$; i.e. varying
 $\delta /\rho _d$ for fixed
 $\delta /\sigma \rho _0=(10/3)\sigma \rho _0$. The motivation for this particular parameter space exploration is a little complicated. Essentially, we would like to study the influence of
 $\beta _d$ on reconnection. After substudy (2D-b), which varied
 $\eta$ but not
 $\beta _d$, it would be natural to hold
 $\eta$ constant while varying
 $\beta _d$. However, we will instead vary
 $\eta \propto \beta _d^{-1}$ to keep
 $\eta \beta _d$ constant. Importantly, this fixes
 $\delta =\sigma \rho _0/(\eta \beta _d)$ with respect to upstream plasma scales. In particular,
 $\delta /\Delta x=10$ and
 $L_x/\delta =384$ will be the same in every case, so that, as
 $\beta _d$ and
 $\eta$ vary, the initial current sheet will remain well resolved but very thin compared with
 $L_y=2L_x$. Satisfying these two criteria will be important in three dimensions (§§ 5.3–5.4) when we will focus on the evolution of the current layer at early times as it undergoes large deformations due to RDKI, requiring
 $\delta /\Delta x\gg 1$ and
 $\delta /L_y \ll 1$; in addition, it will be more straightforward to compare layer deformation and its interaction with the upstream plasma for different simulations when the current sheets begin with the same thickness. Although neither RDKI nor extreme layer deformation will occur in two dimensions, this substudy provides a baseline against which to compare the 3-D simulations.
Therefore, we simultaneously vary  $\eta$ along with
 $\beta _d$ to keep the product
 $\eta \beta _d$ constant. Maintaining constant
 $\eta \beta _d$ fixes
 $\delta /\sigma \rho _0$, while essentially varying the drifting plasma length scales ( such as gyroradius
 $\rho _d=3\theta _d\rho _0$) with respect to
 $\delta$ – i.e. varying
 $\delta /\rho _d = 2/(\gamma _d \beta _d)$.
We compare five configurations with the same background plasma (with zero guide field), system size  $L_x=1280\sigma \rho _0=384\delta$ and zero initial magnetic perturbation (
 $a=0$). We vary
 $\beta _d\in \{$0.075, 0.15, 0.3, 0.6, 0.9
 $\}$; to keep
 $\eta \beta _d$ constant, the overdensities
 $\eta$ are
 $\{$4, 2, 1, 0.5, 0.33
 $\}$, yielding the same
 $\delta =(10/3)\sigma \rho _0=10\Delta x$ for all five cases. Other parameters are (see also table 1):
 $\theta _d/\theta _b \in \{0.5$, 1.0, 2.1, 5.0, 14
 $\}$ and
 $\delta /\rho _d \in \{8.9$, 4.4, 2.1, 0.89, 0.32
 $\}$, respectively.
At  $\beta _d=0.075$,
 $\eta =4$, the gyroradius and collisionless skin depth of the drifting plasma are at their smallest values of
 $\rho _d=0.38\sigma \rho _0$ and
 $d_{ed}=0.31\sigma \rho _0$, both near the grid resolution
 $\Delta x$, and the half-thickness
 $\delta$ is 10 times larger than those scales. At the other end of the parameter scan,
 $\beta _d=0.9$,
 $\eta =0.33$, the microphysical scales of the initial current sheet become somewhat larger than
 $\delta$:
 $\delta \approx 0.3 \rho _d \approx 0.6 d_{ed}$.
To characterize the effects of varying  $\beta _d$ (with
 $\eta$), we focus on the time history of magnetic and plasma energy, and on the resulting NTPA; and again, we find little variation among this set of simulations (see figure 6). All cases show very similar magnetic depletion rates and NTPA (within stochastic variation), except for the case
 $\beta _d=0.9$ (
 $\eta =0.33$), which is a little different; this case ends up with a bit more energy in plasmoids, although the rate at which upstream magnetic energy and unreconnected flux decrease is similar to the others. The
 $\beta _d=0.9$ case has significantly hotter (although lower density) drift particles (cf. table 1), which results in correspondingly hotter and less dense plasmoids cores, since the initially drifting particles, being close to the initial midplane, are among the first to be swept into plasmoids and remain near the plasmoid cores (the original drift kinetic energy may also be converted to thermal energy, contributing to even hotter cores).
(a) Transverse magnetic energy vs (shifted) time, and (b) electron energy spectra when 23 per cent of the initial magnetic energy has been converted (see the horizontal grey line in panel a), for simulations with varying initial current drift  $\beta _d$, but constant initial sheet thickness
 $\delta =(10/3)\sigma \rho _0$. (Table 1 shows how initial temperatures and gyroradii vary with
 $\beta _d$.) Dotted grey-on-yellow lines indicate power-law slopes of 4.2 and 4.6. All simulations have size
 $L_x=1280\sigma \rho _0$.

Summary of 2D-a,b,c. We have seen that in two dimensions, the details of the initial current sheet can affect the time delay before the onset of reconnection, as well as the evolution of the plasmoid hierarchy. Nevertheless, the initial current sheet configuration has relatively little effect on the long-term magnetic energy conversion and NTPA in 2-D reconnection; after a short initial stage, reconnection energetics are dominated by the upstream plasma, regardless of the very early current sheet evolution. This conclusion may seem to be at odds with that from Ball et al. (Reference Ball, Sironi and Özel2019), which found subtle but significant differences in NTPA due to initial perturbation and varying initial sheet thickness; however, Ball et al. (Reference Ball, Sironi and Özel2019) studied transrelativistic electron–proton reconnection, with low upstream plasma beta and non-zero guide magnetic field ( $B_{gz}/B_0=$0.1 and 0.3). They used a small pressure imbalance as an initial perturbation, and found that its influence diminished with diminishing guide field, potentially consistent with our zero-guide-field results here. The impact of varying sheet thickness (keeping
 $\eta$ constant) was also seen at the larger guide field,
 $B_{gz}=0.3B_0$, so there are several potentially important differences between these two studies: transrelativistic electron–proton vs ultrarelativistic pairs, low upstream plasma beta vs beta of 0.5 (
 $\sigma _h=1$), weak-to-moderate vs zero guide field, and pressure vs magnetic field perturbation.
4.3. Two-dimensional reconnection: system-size dependence
In this subsection we investigate how reconnection depends on system size  $L_x$, to estimate the applicability of our kinetic simulations to astrophysical systems, which may be much larger than even the largest supercomputers can possibly simulate while including full kinetics. We present results for system sizes ranging over a factor of 30, from
 $L_x/\sigma \rho _0=80$ to 2560. These simulations achieve a substantial scale separation between the system size
 $L_x$ and all the microphysical scales, which are of order
 $\sigma \rho _0$ (cf. § 2). Such large scale separations are feasible because, for
 $\sigma _h=1$, all the kinetic scales are comparable, hence they can all be resolved by a cell size
 $\Delta x$ only marginally smaller than
 $\sigma \rho _0$. All simulations presented in this subsection are two-dimensional with zero guide field, starting with an initial current sheet half-thickness
 $\delta =(2/3)\sigma \rho _0$,
 $\eta =5$,
 $\beta _d=0.3$ and zero perturbation.
Before discussing how  $L_x$ affects typical reconnection behaviour, we note that stochastic evolution of the plasmoid hierarchy affects energy conversion and NTPA, especially over short time scales. For example, in the
 $L_x=1280\sigma \rho _0$ simulation, the magnetic energy depletion slows (compared with earlier times) between
 $t\approx 3L_x/c$ and
 $t \approx 5L_x/c$, so that
 $U_{Bt}(t)$ is distinctly higher at
 $t=5L_x/c$ than in all the other simulations (figure 7a, inset). At
 $t\approx 3L_x/c$, the lower layer in the simulation domain for
 $L_x=1280\sigma \rho _0$ has two large, roughly equal-sized plasmoids, separated by
 $\approx L_x/2$ (while the upper layer already has only one final plasmoid at this time). In principle, one of the plasmoids could either move left to merge with the other, or (since the simulation is periodic in
 $x$) it could move right. Thus they reach a ‘Buridan's Ass’ metastable state that seems to slow reconnection evolution for a short time. However, by
 $4.4L_x/c$, the two plasmoids have decided which way to move, and by
 $4.8L_x/c$ they have started to merge, causing a burst of magnetic energy depletion; by the time the merger is nearly complete at
 $6.1L_x/c$,
 $U_{Bt}(t)$ has ‘caught up’ to all the other simulations. Over short times, the reconnection dynamics thus depends on the detailed behaviour of large plasmoids, which has an element of randomness; however, the random plasmoid behaviour does not alter the long-term behaviour of reconnection.
For different system sizes  $L_x$: (a) transverse magnetic energy vs time, with an inset showing
 $L_x=1280\sigma \rho _0$ alone, and (b) unreconnected flux vs time. The horizontal dashed lines indicate the periods over which the average reconnection rate is given in figure 8, and slopes corresponding to
 $\beta _\textrm {rec}=0.04$ and 0.02 (cf. § 3.3) are shown as grey dotted lines.

Figure 7 shows the evolution of transverse magnetic energy  $U_{Bt}(t)$ and unreconnected flux
 $\psi (t)$ for a range of
 $L_x$. Although
 $U_{Bt}(t)$ often decreases fitfully,
 $\psi (t)$ tends to decrease more smoothly. Initially,
 $\psi (t)$ falls very rapidly as reconnection is dominated by the initial current sheet, and the rate of fall slows a little as the upstream plasma begins to dominate reconnection (the larger
 $L_x/\delta$ is, the sooner this happens relative to the total duration of reconnection). Eventually, the system reaches a stable magnetic configuration and
 $\psi (t)$ approaches a constant value; therefore, the reconnection rate must decrease over time, eventually toward zero (in a closed system). The reconnection rates over two different time intervals are shown in figure 8(a), namely for the two intervals
 $0.9 > \psi (t)/\psi _0 > 0.8$ and
 $0.8 > \psi (t)/\psi _0 > 0.7$, i.e. between the horizontal dashed lines in figure 7(b). As the system size
 $L_x/\sigma \rho _0$ increases from 160 to 2560,
 $\beta _\textrm {rec}$ (cf. § 3.3) falls from
 $\approx 0.04$ to
 $\approx 0.03$ in the earlier interval, and from
 $\beta _\textrm {rec}\approx 0.03$ to
 $\beta _\textrm {rec}\approx 0.02$ in the later interval. However,
 $\beta _\textrm {rec}$ stabilizes within the uncertainty of measurement by
 $L_x\gtrsim 640\sigma \rho _0$.
(a) The average reconnection rate (normalized to  $B_0 c$ on the left scale, and to
 $B_0 v_A$ on the right scale) vs system size
 $L_x$, over the period when the unreconnected flux falls from 0.9–0.8
 $\psi _0$ (blue squares), and also from 0.8–0.7
 $\psi _0$ (red circles) – i.e. between the horizontal dashed lines in figure 7(b). (b) The fraction of initial (transverse) magnetic field energy converted to plasma energy (blue diamonds) and of upstream flux depleted (red plusses) during reconnection vs system size
 $L_x$ (for aspect ratio
 $L_y/L_x=2$, with two layers). The largest system size,
 $L_x=1280\sigma \rho _0$ had not quite finished reconnection when the simulation halted around
 $10L_x/c$; it would have depleted slightly more energy and flux if given more time.

Reconnection continues until approximately  $0.27U_{B0}$ and
 $0.42\psi _0$ have been depleted; the fractions of lost energy and flux are practically independent of
 $L_x$ (figure 8b), although we note that they are specific to the fixed aspect ratio
 $L_y/L_x=2$. The largest simulation,
 $L_x=2560\sigma \rho _0$ shows slightly less loss in
 $U_{Bt}$ and
 $\psi$, likely because it had not quite finished reconnecting when it halted around
 $10L_x/c$ (cf. figure 7).
Importantly, the upstream magnetic energy and flux are both depleted by the same amount – 42 per cent. However, of that  $0.42U_{B0}$ initially associated with magnetic field lines that eventually undergo reconnection, only
 $0.27U_{B0}$ is converted to plasma energy; the remaining
 $0.15 U_{B0}$ ends up stored in the ‘reconnected’ magnetic field around and within plasmoids.
Turning our attention to NTPA, figure 9 shows the electron energy spectra  $f(\gamma )$ at
 $t=6L_x/c$ for simulations with different
 $L_x$ (panel a shows
 $\gamma ^2 f(\gamma )$, and b shows
 $\gamma ^4 f(\gamma )$ to enhance small differences). Aside from the smallest, all simulations have a clear high-energy non-thermal power law
 $f(\gamma )\sim \gamma ^{-p}$; for the largest simulation, it extends over almost a decade in energy. At
 $t=6L_x/c$, the power-law index
 $p$ steepens slightly as
 $L_x/\sigma \rho _0$ increases from 160 to 2560, from
 $p\approx 4.0$ to
 $p\approx 4.5$ (figure 9c—cf. § 3.7). This steepening may be caused by a different acceleration mechanism that operates over long times (hence only in very large simulations), as we will discuss presently.
For different system sizes  $L_x$: (a) electron energy spectra
 $f(\gamma )$, compensated by
 $\gamma ^2$, at time
 $t=6L_x/c$, with power-law indices of 4 and 4.4 indicated by dotted grey-on-yellow lines, (b)
 $\gamma ^{4} f(\gamma )$ at
 $t=6L_x/c$, to enhance differences, (c) the median power-law index during the time period
 $5 < tc/L_x < 7$, with ‘error’ bars containing 68 per cent of the values fitted to spectra within this period. For
 $L_x/\sigma \rho _0=$256 and 320, results from two simulations are shown (slightly offset in
 $L_x$ for clarity in panel c).

The time evolution of power-law index  $p$ and high-energy cutoff
 $\gamma _c$ (cf. § 3.7), for all the
 $L_x$, are shown in figure 10(a,b). The initial development of the power law, as the first particles reach high energies, results in
 $p(t)$ rapidly falling (i.e. the power law hardens/flattens) to approach an index between 3.9 and 4.5. From its minimum value, the slope appears to steepen slowly over time, mostly notably for simulations with
 $L_x\geq 640\sigma \rho _0$, all of which show
 $p(t)$ rising by approximately 0.2 from its minimum.
For different system sizes  $L_x$, the fitted values for the power-law index
 $p$ (panel a) and high-energy cutoff
 $\gamma _c$ (b) vs time. (c) For
 $L_x=2560\sigma \rho _0$,
 $p(t)$ (blue, left axis) and
 $\gamma _c(t)$ (red, right axis) are essentially the same for two different resolutions,
 $\Delta x/\sigma \rho _0 = 1/3$ and
 $1/4$, even though for this large system size,
 $\Delta x/\sigma \rho _0=1/3$ resulted in unphysical total energy growth of 1 per cent, while
 $\Delta x / \sigma \rho_0 = 1/4$ saw a more satisfactory 0.05 per cent increase. Error bars indicate uncertainty, encompassing the middle 68 per cent of values measured over the associated time interval.

Correspondingly, the cutoff  $\gamma _c(t)$ grows rapidly as the power law develops, attaining after only 1–2
 $L_x/c$ a value ranging from
 $\gamma _c=6\sigma$ for
 $L_x=80\sigma \rho _0$ to
 $\gamma _c=15\sigma$ for
 $L_x=2560\sigma \rho _0$. For
 $L_x\geq 1280\sigma \rho _0$,
 $\gamma _c(t)$ continues to grow over time, and even the case
 $L_x=640\sigma \rho _0$ experiences some limited growth after approximately
 $t=7L_x/c$. Thus at late time
 $t=9L_x/c$,
 $\gamma _c$ ranges from
 $6\sigma$ to
 $33\sigma$ as
 $L_x$ increases by a factor of 32, consistent with
 $\gamma _c \sim \sqrt {L_x}$; importantly, although
 $\gamma _c$ increases with
 $L_x$, the increase is clearly sublinear. This is consistent with very rapid (extreme) acceleration up to
 $\gamma _c\sim 4\sigma$ (Werner et al. Reference Werner, Uzdensky, Cerutti, Nalewajko and Begelman2016; Uzdensky Reference Uzdensky2020), at which energy particles become trapped in plasmoids and cease extreme acceleration, but undergo much slower acceleration inside plasmoids (Petropoulou & Sironi Reference Petropoulou and Sironi2018; Uzdensky Reference Uzdensky2020; Hakobyan et al. Reference Hakobyan, Petropoulou, Spitkovsky and Sironi2021). Interestingly, the slow growth in
 $\gamma _c(t)$ seems to correspond to the slow steepening in
 $p(t)$, suggesting that the slower acceleration mechanism may yield a steeper power law. The increase in
 $p$ with
 $L_x$ seen in figure 9(c) may simply reflect the increasing influence of the slower acceleration mechanism after longer times (accessible in large systems).
Very large reconnection simulations sometimes suffer at late times from slow-growing instabilities. The largest case,  $L_x=2560\sigma \rho _0$, exhibited potentially troubling energy non- conservation, with the total energy growing by almost 1 per cent between
 $t=7L_x/c$ and
 $t=10L_x/c$. We find that this typically results in unphysical heating of the lowest-energy particles but does not affect the high-energy spectrum. To rule out this possibility, we compare the simulation with fiducial resolution
 $\Delta x=\sigma \rho _0/3$ to one with higher resolution,
 $\Delta x=\sigma \rho _0/4$ in figure 10(c); both show essentially similar evolution of
 $p(t)$ and
 $\gamma _c(t)$, although the higher-resolution case suffered only a 0.05 per cent increase in total energy.
In summary, the system-size dependence of 2-D reconnection with  $\sigma _h=1$ is weak but not entirely insignificant for
 $L_x \gtrsim 160\sigma \rho _0$. The reconnection rate (normalized to
 $cB_0$) is
 $\beta _\textrm {rec}\approx 0.03$ or
 $(c/v_A)\beta _\textrm {rec}\approx 0.04$. During reconnection, some particles are very rapidly accelerated into a power-law energy spectrum
 $\sim \gamma ^{-p}$ with
 $p\approx 3.9$–
 $4.4$, extending up to a cutoff around
 $\gamma _c \gtrsim 6\sigma$. This rapid acceleration presumably ends when particles become trapped in plasmoids. Over time, a much slower acceleration mechanism continues to accelerate particles trapped in plasmoids (Petropoulou & Sironi Reference Petropoulou and Sironi2018; Hakobyan et al. Reference Hakobyan, Petropoulou, Spitkovsky and Sironi2021), resulting in a slight steepening of
 $p$ (up to
 $\approx 4.6$ in our largest simulation) and slow but significant growth in
 $\gamma _c$ (up to
 $\approx 33\sigma$ in our largest simulation).
4.4. Two-dimensional reconnection: guide magnetic field
We now investigate the effect of adding an initial uniform guide magnetic field  $B_{gz}\hat {\boldsymbol {z}}$, considering
 $B_{gz}/B_0 \in \{$0, 0.25, 0.5, 0.75, 1, 1.5, 2, 3, 4
 $\}$. All simulations presented in this subsection are two-dimensional with
 $L_x=1280\sigma \rho _0$, starting with an initial current sheet half-thickness
 $\delta =(2/3)\sigma \rho _0$ (
 $\eta =5$,
 $\beta _d=0.3$), and zero perturbation (
 $a=0$).
A weak guide field  $B_{gz} \lesssim 0.25 B_0$ has very little effect on the magnetic energy evolution. A strong guide field, however, slows reconnection and inhibits overall magnetic energy conversion, as shown in figure 11. Figure 11(a) shows the transverse magnetic energy
 $U_{Bt}$ vs time, for simulations with
 $B_{gz}/B_0$ ranging from 0 to 4; as
 $B_{gz}$ increases above
 $\simeq 0.5B_0$,
 $U_{Bt}(t)$ falls more slowly, and ultimately decreases by a smaller amount. Correspondingly (cf. figure 11b), the unreconnected flux decreases more slowly, and less flux is reconnected overall.
For several guide-field strengths  $B_{gz}$: (a) transverse magnetic energy vs time, and (b) unreconnected flux vs time, with dot-dashed lines showing the slopes corresponding to
 $\beta _\textrm {rec}=$0.04 and 0.008 (cf. § 3.3). To estimate stochastic variability, two simulations are shown for
 $B_{gz}=0$, two for
 $B_{gz}=0.25B_0$ and three for
 $B_{gz}=0.5B_0$.

This slowing of reconnection has been previously attributed to the decrease in the effective component ( $x$-projection) of the Alfvén velocity (Liu et al. Reference Liu, Daughton, Karimabadi, Li and Peter Gary2014, Reference Liu, Guo, Daughton, Li and Hesse2015; Werner & Uzdensky Reference Werner and Uzdensky2017). The upstream Alfvén velocity, including
 $B_0$ and
 $B_{gz}$, is
 $v_A=c\sqrt {(B_0^2+B_{gz}^2)/(B_0^2+B_{gz}^2 + 4{\rm \pi} h)}$, where
 $h$ is the plasma enthalpy density (
 $h=4n_b\theta _b m_e c^2$ in the ultrarelativistic limit). The projection of
 $v_A/c$ along
 $B_0$ is therefore
 \begin{equation} \frac{v_{A,x}}{c} = \sqrt{ \frac{B_0^2}{B_0^2 + B_{gz}^2}} \frac{v_A}{c} = \sqrt{ \frac{B_0^2}{B_0^2 + B_{gz}^2 + 4{\rm \pi} h}} = \sqrt{ \frac{B_0^2}{B_0^2 + 4{\rm \pi} h_\textrm{eff}}}, \end{equation}
where, following Werner & Uzdensky (Reference Werner and Uzdensky2017), we define  $h_\textrm {eff}\equiv h+B_{gz}^2/4{\rm \pi}$ to be an effective enthalpy density including a contribution from the guide field. Then, defining
 $\sigma _{h,{\rm eff}}\equiv B_0^2/(4{\rm \pi} h_\textrm {eff})$, we have
 $v_{A,x} = (\sigma _{h,{\rm eff}}^{-1}+1)^{-1/2}$, which reduces to
 $v_{A}/c = (\sigma _h^{-1}+1)^{-1/2}$ for
 $B_{gz}=0$.
Figure 12 quantifies the reconnection rates (panel a) and amount of magnetic energy and upstream flux depleted (panel b). The left panel shows the reconnection rates, averaged over the time interval during which  $\psi (t)$ falls from
 $0.9\psi _0$ to
 $0.8\psi _0$. The reconnection rate, normalized to
 $B_0 c$ (blue circles) falls from roughly 0.03–0.04 for
 $B_{gz}\lesssim 0.75B_0$ to around 0.01 for
 $B_{gz} = 4 B_0$. The red squares show reconnection rates normalized to
 $B_0 v_{A,x}$. For
 $B_{gz}/B_0\gtrsim 1$,
 $(c/v_{A,x})\beta _\textrm {rec}$ is relatively constant around 0.03; however,
 $(c/v_{A,x})\beta _\textrm {rec}$ is closer to 0.04 or even 0.05 for
 $B_{gz}/B_0 < 1$. As a compromise, figure 12 shows a dashed line at
 $(c/v_{A,x})\beta _\textrm {rec}=0.038$; the dotted line shows the corresponding
 $\beta _\textrm {rec}$.
(a) Reconnection rate vs  $B_{gz}$: blue circles show the reconnection rate
 $\beta _\textrm {rec}$ (normalized to
 $B_0 c$), and red squares show
 $(c/v_{A,x})\beta _\textrm {rec}$ – cf. (4.1). The blue dotted line shows what
 $\beta _\textrm {rec}$ would be if
 $(c/v_{A,x})\beta _\textrm {rec}$ were constant at 0.038 (the red dashed line). The reconnection rates are averages over the period during which
 $\psi (t)$ falls from
 $0.9\psi _0$ to
 $0.8\psi _0$ (i.e. between the horizontal grey, dashed lines in figure 11b). (b) The fractional amount of transverse magnetic energy
 $U_{Bt}$ (blue x symbols) and upstream magnetic flux (red plusses) lost during reconnection, vs
 $B_{gz}$, along with empirical fits for both.

According to (4.1), the guide field should not significantly suppress reconnection for  $B_{gz}/B_0 \ll \sigma _h^{-1/2} = 1$. We note that a much stronger guide field would be needed to suppress non-relativistic reconnection (where
 $\sigma _h \ll 1$). On the other hand, our previous work (Werner & Uzdensky Reference Werner and Uzdensky2017) considered
 $\sigma _h \simeq 25$, and correspondingly observed that even
 $B_{gz} = B_0/2$ significantly suppressed reconnection, slowing the reconnection rate and reducing the overall magnetic depletion (although
 $B_{gz}=B_0/4$ had only a weak effect).
Figure 12(b) shows that the total fraction of  $U_{Bt}$ converted to
 $U_\textrm {plasma}$ decreases with stronger guide field – from around 27 per cent for
 $B_{gz}=0$ to only approximately 6 per cent for
 $B_{gz}=4 B_0$; similarly, the amount of flux reconnected decreases from 42 per cent to around 21 per cent. We find that the fractional loss in
 $\psi$ is fit fairly well by
 $0.86(L_x/L_y)(1+2B_{gz}^2/B_0^2)^{-1/5}$, and the loss in
 $U_{Bt}$ by
 $0.56(L_x/L_y)(1+4B_{gz}^2/B_0^2)^{-2/5}$; these functional forms are meant for convenient comparison with future results and we offer no justification for them.
Even a weak guide appears to enhance the reconnection rate slightly. However, because stochastic variability can yield different reconnection rates, more work is needed to determine whether this trend is statistically significant.
With stronger guide field, reconnection ends (or reaches a stable configuration) with a smaller amount of magnetic energy and flux depletion. This may be caused by the increased pressure of the guide magnetic field in plasmoids. The guide magnetic field pressure resists compression with adiabatic index  $\varGamma =2$, compared with only
 $\varGamma =4/3$ for relativistic plasma alone (e.g. compressing a flux tube with uniform magnetic field from volume
 $V_i$ to
 $V_f$ while preserving the magnetic flux inside requires work
 $\propto (V_i/V_f)^{\varGamma -1}-1$ where
 $\varGamma =2$; whereas compressing the plasma in the tube requires work
 $\propto (V_i/V_f)^{4/3-1}-1$). As a result, for the same amount of (transverse magnetic field) flux reconnected, the major plasmoid will be larger when the guide field is stronger. Therefore, the growth of the major plasmoid reaches the system-size scale earlier (in terms of amount of flux reconnected, not time) and shuts down reconnection.
Perhaps not surprisingly, the slowing of reconnection inhibits NTPA, as shown in figure 13, which displays the final particle energy spectra (panel a) and the fitted power-law indices (panel b). Overall, less energy is transferred from the magnetic field to the plasma, and at any given well-above-average energy, stronger guide field results in a smaller fraction of particles at that energy, hence NTPA is less efficient. As  $B_{gz}$ increases, the power law steepens from
 $p\simeq 4$ to
 $p\gtrsim 10$ at
 $B_{gz}=4B_0$. The line
 $p\approx 4.4 + 2B_{gz}/B_0$ very roughly captures this trend, although it is important to remember that the uncertainty in measuring steep power laws (
 $p\gtrsim 4$) can be quite high (our fitting method returns consistent values characterizing the spectra, but fundamentally one should question what it means to measure a steep power law, e.g.
 $\sim \gamma ^{-8}$ as
 $\gamma$ varies over just a half-decade). This general trend was also observed for
 $\sigma _h=25$ reconnection in Werner & Uzdensky (Reference Werner and Uzdensky2017), where the steepening was fairly well described by
 $p=1.9+0.7\sigma _{h,{\rm eff}}^{-1/2}$; however, this formula provides a very poor fit for the
 $\sigma _h=1$ simulations, perhaps because we are in the regime of very steep power laws that cannot be reliably measured at higher energies without orders of magnitude more simulated particles.
(a) Particle energy spectra  $f(\gamma )$ at
 $t=12L_x/c$, for different imposed guide magnetic fields, show that increasing guide field inhibits NTPA, resulting in steeper power laws. Slopes with power-law indices of 4.4, 4.8 and 7 are shown for comparison. (b) The steepening is quantified by power-law indices fit to the high-energy part of
 $f(\gamma )$, with error bars encompassing the middle 68 per cent of fitted indices over times from 4 to 10
 $L_x/c$. The line
 $4.4+2B_{gz}/B_0$ is shown as a guide, but it is important to remember that precise measurement of steep power laws is very difficult, and in fact the cases with
 $B_{gz}/B_0 \geq 1.5$ are not very different from the initial Maxwellian at
 $t=0$ (shown in dashed grey).

5. Three-dimensional reconnection with moderate magnetization
Despite many similarities between two and three dimensions in the  $\sigma _h=1$ regime (especially in NTPA), current sheet evolution in three dimensions sometimes shows substantially different behaviour. Reconnection still begins fairly rapidly in three dimensions, perhaps urged on (at very early times) by the thin tearing-unstable current sheet of the initial state, but the rate of magnetic energy conversion at early times is only about half that in two dimensions. However, while 2-D systems approach a non-reconnecting, relaxed steady state after 5–10
 $L_x/c$, 3-D systems continue to convert magnetic energy at a slower rate (by an order of magnitude or more) for many tens of
 $L_x/c$. During 2-D reconnection, part of the upstream magnetic energy is transferred to the plasma, and part is pumped into ‘reconnected fields’ – i.e. into plasmoids – where it remains in magnetic form (see, e.g. Sironi et al. Reference Sironi, Petropoulou and Giannios2015). In 3-D reconnection, plasma is also energized, but upstream magnetic energy pumped into plasmoids (or flux ropes) is subsequently converted to plasma energy (rather than building up as in two dimensions; the decay of 3-D flux ropes was also observed for
 $\sigma _h\gg 1$ in Guo et al. Reference Guo, Li, Daughton, Li, Kilian, Liu, Zhang and Zhang2020). Thus, while 2-D reconnection simulations (in a closed periodic box) end up in a relaxed steady state with substantial magnetic field stored in one large plasmoid (for each initial current sheet), 3-D reconnection results in a thickened, roughly uniform, much less structured, turbulent current layer with greatly diminished magnetic field. This thickened layer continues slowly to convert magnetic energy to plasma energy; ultimately more magnetic energy can be converted in three than in two dimensions. Despite a lower reconnection rate in three dimensions (hence lower reconnection electric field), NTPA remains robust.
While 2-D reconnection can be bursty due to stochastic creation, movement, and merging of plasmoids, these events tend to be random blips in a predetermined course of evolution toward a unique final state. In contrast, 3-D reconnection exhibits greater variability, with stochastic events leading to a thicker turbulent layer in different ways. In particular, we have often observed the following behaviour. Because of RDKI, the current layer sometimes develops large-amplitude kinking in  $z$, resulting in the layer dramatically folding over on itself like a breaking wave. This tends to deplete very rapidly almost all the magnetic energy within the original amplitude of oscillation, resulting in a thick turbulent layer. However, this behaviour is not inevitable; sometimes the kink amplitude grows but stops short of folding over on itself, resulting in much slower energy conversion and layer growth. It remains unclear – because it might require running simulations for hundreds or thousands of
 $L_x/c$ – whether a simulation that does not undergo ‘layer folding’ will ever convert as much energy or thicken the layer as much as one that does.
In the following subsection, we present an overview of differences between 2-D and 3-D current sheet evolution, using our largest simulations. To study the effect of ‘3-D-ness’ we consider four configurations that are identical but for different values  $L_z$. The two smallest
 $L_z$ behave similarly (i.e. like 2-D reconnection), whereas the two largest exhibit 3-D effects. Following the overview (§ 5.1), which will describe magnetic energy conversion and NTPA as well as plasma and field evolution, we include a brief discussion of increased stochastic variability, or sensitivity to initial conditions, in three dimensions (§ 5.2). Then, using an extensive set of slightly smaller simulations, we will specifically explore the dependence of energy conversion and NTPA on the initial current sheet configuration (§ 5.3 and § 5.4), on the aspect ratio
 $L_z/L_x$ (i.e. the ‘3-D-ness’, § 5.5), and finally on guide magnetic field (§ 5.6).
We note that the 3-D generalization of a plasmoid or magnetic island that forms in 2-D reconnection is a flux rope. However, we continue to use the term ‘plasmoid’ to refer to flux ropes or any concentrations of plasma in 3-D reconnection, both for simplicity and because we have not yet thoroughly investigated these objects to determine whether they truly have the magnetic structure of flux ropes.
5.1. Overview of 3-D reconnection with $\sigma _h=1$, and comparison with two dimensions

In this section we begin with an overview of basic 3-D current sheet behaviour for one specific configuration, namely:  $\sigma _h=1$, zero guide field (
 $B_{gz}=0$), zero initial perturbation (
 $a=0$), an initially thin current sheet
 $\delta =(2/3)\sigma \rho _0$ (
 $\eta =5$) and
 $L_x=512\sigma \rho _0 = L_y/2$ (the largest
 $L_x$ of any 3-D simulations in this paper). We will show results from simulations with
 $L_z/L_x=0$ (a 2-D simulation), 1/32, 1/8 and 1; we will show in particular that
 $L_z=L_x/32$ behaves essentially like the 2-D simulation, while the two largest simulations are similar to each other but quite different from the smaller two, presumably because of 3-D effects that appear for sufficiently large
 $L_z$.
Before looking at the evolution of 2-D and 3-D current sheets, it is helpful to see how global energies and unreconnected flux vary in time. We begin by looking at global field energies vs time, normalized to initial magnetic energy  $U_{B0}$, in figure 14(a–c). In these simulations without guide field, almost all the field energy is contained in
 $U_{Bt}$, the energy in the transverse magnetic field
 $\boldsymbol {B}_t = B_x \hat {\boldsymbol {x}} + B_y \hat {\boldsymbol {y}}$. In all cases
 $U_{Bz}(t) < 0.003U_{B0}$, and the energy in the electric field
 $\boldsymbol {E}$ (not shown) also remains below
 $0.003 U_{B0}$. The
 $B_z$ and
 $E$ field components can nevertheless be substantial within the (the small volume of) the layer. Further investigation of
 $B_z$ is left for future work, but we note that there should be no
 $B_z$ at all in a 2-D magnetohydrodynamic description (for pair plasma with no initial guide field, Zenitani, Hesse & Klimas Reference Zenitani, Hesse and Klimas2009), while 2-D PIC simulations do develop non-zero
 $B_z$ (Zenitani & Hesse Reference Zenitani and Hesse2008).
Energy in various magnetic field components vs time for 4 different  $L_z/L_x$, normalized to
 $U_{B0} \approx \int \,\textrm {d}V \, B_0^2/8{\rm \pi}$: (a)
 $U_{Bt} = \int \,\textrm {d}V \, (B_x^2+B_y^2)/8{\rm \pi}$, (b)
 $U_{Bz} = \int \,\textrm {d}V \, B_z^2/8{\rm \pi}$ and (c)
 $U_{Bt,{\rm layer}}$, the magnetic energy in the layer (cf. § 3.1). The electric field energy (not shown) is always less than
 $0.003 U_{B0}$. Finally (d), the unreconnected magnetic flux
 $\psi (t)$; dotted grey lines indicate dimensionless reconnection rates,
 $(cB_0L_z)^{-1} (\textrm {d}\psi /\textrm {d}t)$, of 0.045 and 0.015, which are roughly the rates of nearly 2-D and 3-D simulations, respectively, between the grey dashed lines, and also 0.002, roughly the 3-D rate at later times.

Figure 14(a) shows  $U_{Bt}$ decreasing over time in all cases as it is converted to plasma energy. The simulations with larger
 $L_z/L_x=1/8,1$ show similar magnetic depletion, and those with smaller
 $L_z/L_x=0,1/32$ closely resemble each other; in this and other diagnostics we will see that the former (
 $L_z/L_x=1/8,1$) exhibit 3-D behaviour, while the latter are essentially two-dimensional. We find that magnetic energy depletes roughly half as fast in three as in two dimensions, at early times up to
 $\sim 4L_x/c$ (figure 14a; see also table 2, which compares energy changes and reconnection rates). While the 2-D simulations have mostly finished reconnection by
 $t\sim 4L_x/c$ (approaching a final state a few
 $L_x/c$ later), the 3-D simulations embark upon a second stage of prolonged slow energy conversion (cf. Liu et al. Reference Liu, Li, Yin, Albright, Bowers and Liang2011), converting magnetic energy to plasma energy an order of magnitude still more slowly for many tens of
 $L_x/c$. Were these simulations to run many times longer (which they did not, because of prohibitive computational cost), the 3-D simulations would eventually convert more magnetic energy than the essentially 2-D simulations; we will see in § 5.5, using smaller simulations (
 $L_x=341\sigma \rho _0$), that 3-D simulations convert more magnetic energy over
 $\sim 50 L_x/c$ than 2-D simulations.
The fractional loss in transverse magnetic field energy  $U_{Bt}$ in the entire simulation (nearly equal to the gain in plasma energy
 $U_\textrm {plasma}$), divided into upstream and layer regions (
 $U_{Bt,{\rm up}}+U_{Bt,{\rm layer}}=U_{Bt}$), and the loss in unreconnected magnetic flux
 $\psi$, over the first
 $10L_x/c$, for simulations with
 $L_x=512\sigma \rho _0$ and
 $B_{gz}=0$. Changes are shown normalized to initial magnetic energy
 $U_{B0}$ and initial unreconnected flux
 $\psi _0$. The fully 3-D simulations would continue to deplete magnetic energy if run longer (cf. § 5.5). Also shown is
 $\beta _\textrm {rec}$ (cf. § 3.3), averaged over the time during which
 $\psi (t)$ drops from 0.95
 $\psi _0$ to 0.90
 $\psi _0$.

More magnetic energy conversion is possible in three dimensions because the magnetic energy pumped into plasmoids can be depleted in three dimensions, whereas in 2-D plasmoids remain stable. To demonstrate how little magnetic energy remains stored in plasmoids in three dimensions, we separately measure the transverse magnetic energy in the upstream and in the layer regions (cf. § 3.1):  $U_{Bt} = U_{Bt,{\rm up}} + U_{Bt,{\rm layer}}$. With no guide field and no initial perturbation, the initial magnetic energy
 $U_{B0}=U_{Bt0}$ is entirely in unreconnected transverse field. During magnetic reconnection in two dimensions, part of this gets converted into plasma energy
 $U_\textrm {plasma}$, and part into
 $U_{Bt,{\rm layer}}$ in plasmoids. Over the first
 $10L_x/c$, the (nearly) 2-D simulations take the initial upstream magnetic energy
 $U_{B0}$ and convert about
 $\Delta U_\textrm {plasma}\approx 0.27U_{B0}$ to plasma energy while building up a comparable amount,
 $\Delta U_{Bt,{\rm layer}}\approx 0.20_{B0}$, in plasmoids, where it remains trapped. Since the energized particles are also trapped in plasmoids, we estimate that the magnetic energy in plasmoids is approximately 2/3 of the plasma energy in plasmoids. Over the same time, fully 3-D simulations convert
 $\Delta U_\textrm {plasma}\approx 0.2 U_{B0}$ to plasma energy, but magnetic energy in the layer quickly decays, leaving a strikingly smaller upper bound on the amount of energy,
 $\Delta U_{Bt,{\rm layer}}\approx 0.01 U_{B0}$, that could be in plasmoids (see figure 14c and table 2). Although 3-D simulations deplete upstream energy
 $U_{Bt,{\rm up}}$ more slowly, they thus convert it more completely to plasma energy.
Along with magnetic energy, we can also measure the unreconnected magnetic flux, which decreases over time, faster in two than in three dimensions. In three dimensions, as in two dimensions, some of the upstream flux is promptly reconnected, ending up in plasmoids, as in two dimensions. Unlike in two dimensions, however, in three dimensions some upstream flux may be promptly annihilated, and also (only in three dimensions) reconnected flux is subsequently annihilated as plasmoids or flux-rope structures become unstable and decay. It is non-trivial to measure how much upstream flux is annihilated promptly without first undergoing reconnection, but we can conclude from the relatively small amount of magnetic energy in the layer that ultimately, in three dimensions, most of the lost upstream flux is annihilated (vs being stored permanently in plasmoids). Figure 14(d) shows the unreconnected flux  $\psi (t)$ diminishing as reconnection occurs for the four different values of
 $L_z/L_x$. Table 2 shows that up to
 $t=10L_x/c$, the nearly 2-D simulations lose 40 per cent of the initial unreconnected flux, and fully 3-D simulations lose approximately only 15 per cent (though, over time, they would reconnect and/or annihilate more upstream flux, whereas the 2-D simulations have essentially finished). The reconnection rate
 $\beta _\textrm {rec}$ at early times, measured between
 $\psi (t)=0.95\psi _0$ and
 $\psi (t)=0.90\psi _0$ (the horizontal dashed lines in figure 14d) and normalized to
 $B_0 c$, is approximately 0.045 for the nearly 2-D simulations, and 0.015 for three dimensions (see table 2); later, around
 $t=8L_x/c$,
 $\beta _\textrm {rec}$ is of the order of
 $\sim 0.002$ for the 3-D simulations (and fluctuating around zero for two dimensions).
Having shown significant differences (as well as qualitative similarities) between 2-D and 3-D energy and upstream flux depletion, we will describe the evolution of the current sheet. First, we will describe the kinking of the sheet, which cannot occur in two dimensions at all; then we will spend some time describing 3-D behaviour that resembles 2-D reconnection.
Perhaps the most expected (by now) new effect in three dimensions is the kinking of the current sheet in the  $z$ direction due to the RDKI (Zenitani & Hoshino Reference Zenitani and Hoshino2007, Reference Zenitani and Hoshino2008). Simulating the
 $z$ dimension enables the RDKI, which can occur because of the relative movement of electrons and positrons in the
 $z$-direction and causes rippling of the sheet. Figure 15 shows (for the case with
 $L_z=L_x$) a current sheet rippling due to RDKI with an amplitude
 $\Delta y \approx \sigma \rho _0$ at
 $t=0.3L_x/c$, growing to
 $3\sigma \rho _0$ at
 $t=0.6L_x/c$ (for comparison, the initial current sheet thickness was
 $\delta =(2/3)\sigma \rho _0$). It had originally been thought that RDKI – at least in cases with weak guide field – might out-compete the tearing instability, thereby suppressing reconnection (Zenitani & Hoshino Reference Zenitani and Hoshino2008). However, later, larger 3-D simulations (in the high-
 $\sigma _h$ regime) found that, despite active RDKI, reconnection ultimately does not seem to be inhibited, even with zero guide field (Guo et al. Reference Guo, Li, Daughton and Liu2014, Reference Guo, Liu, Daughton and Li2015; Sironi & Spitkovsky Reference Sironi and Spitkovsky2014; Werner & Uzdensky Reference Werner and Uzdensky2017).
The displacement  $\Delta y_c(x,z,t)$ of the current sheet central surface from the original midplane (cf. § 3.2), for
 $L_z=L_x$ at two different times,
 $t=0.3L_x/c$ (a) and
 $0.6 L_x/c$ (b), shows increasing rippling due to the RDKI.

Indeed, 3-D simulations do exhibit behaviour that, at least locally, shares many characteristics with 2-D reconnection. Although energy is clearly transferred from magnetic fields to plasma, determining whether and where reconnection occurs is non-trivial in three dimensions. We tentatively suggest, based on our 3-D simulations, that reconnection occurs in patches within the layer – patches that may be the analogues of elementary current sheets in 2-D reconnection (i.e. the smallest inter-plasmoid current sheets, which are not further broken up by secondary tearing). It is possible that reconnection is slower (overall) in three dimensions because the area of actively reconnecting regions (patches) is smaller, while the local reconnection rate remains as high as in two dimensions (such patchiness with locally high reconnection rates has been observed for  $\sigma _h\sim 1$ by Yin et al. Reference Yin, Daughton, Karimabadi, Albright, Bowers and Margulies2008). Our results are consistent with this hypothesis, but so far we have been unable to measure local reconnection rates with enough certainty to conclude this definitively; we leave a dedicated investigation of this problem to future studies. However, we offer evidence that reconnection does in fact occur (though in patches), and that the patches evolve over time, and continue to exhibit signatures of reconnection even at late times during the ‘slow 3-D reconnection stage’ (e.g.
 $t>4L_x/c$). Specifically, we will see that actively reconnecting regions are areas where the current sheet is thin, that they exhibit outflows (roughly) in the
 $\pm x$ directions, and that they are the areas with strongest parallel (to
 $\boldsymbol {B}$) electric fields and
 $\boldsymbol {E}\boldsymbol {\cdot }\boldsymbol {J}>0$.
Figure 16 shows the electron density  $n_e$, normalized to
 $n_{be0}=n_{b0}/2$, at five different times (
 $tc/L_x=0.3$, 0.6, 1.1, 2.3 and 4.6) in
 $x$–
 $y$ slices, at
 $z=0$ for the nearly 2-D simulation with
 $L_z=L_x/32$, and at
 $z=100\sigma \rho _0$ and
 $z=300\sigma \rho _0$ for
 $L_z=L_x$. A sample of magnetic field lines (traced while ignoring
 $B_z$) shows that
 $n_{e} \lesssim n_{be0}$ in the upstream region, where flux is unreconnected (cf. § 3.3), while
 $n_e > n_{be0}$ in most of the layer. Therefore, looking at density is a good if rough way to track the gross evolution of the shape of the layer.
A time sequence of electron density  $n_e$ in the
 $x$–
 $y$ reconnection plane, in nearly two dimensions (
 $L_z=L_x/32$, a,d,g,j,m) and three dimensions (
 $L_z=L_x$, b,e,h,k,n and c,f,i,l,o) simulations for
 $tc/L_x=0.3, 0.6, 1.1, 2.3, 4.6$. Blue lines follow magnetic field lines, ignoring
 $B_z$ (with a higher density of lines shown closer to the midplane). Panels (a,d,g,j,m) show
 $z=0$ (which looks fairly similar to all other
 $z$ values for this nearly 2-D case); (b,e,h,k,n) show
 $z=100 \sigma \rho _0\approx 0.2 L_z$ and (c,f,i,l,o) show
 $z=300 \sigma \rho _0 \approx 0.6L_z$.

For  $L_z=L_x/32$, the picture is practically the same as in two dimensions: the initial current sheet tears, small plasmoids form and merge into larger plasmoids, until there is just one plasmoid (and a monster one at that) in the layer. Between plasmoids, the layer is thin at X-points (really,
 $X$-lines extended in the
 $z$ direction) where reconnection takes place. For
 $L_z=L_x$, the picture is initially very similar to that in two dimensions, when viewed in an
 $x$–
 $y$ slice. For example, at
 $t=0.3L_x/c$, a similar number of plasmoids is visible (although a slice at any value of
 $z$ looks qualitatively similar, these structures do not appear to extend uniformly in
 $z$; i.e. at early times we do not observe long flux ropes of length
 $L_z$). Soon (by
 $t=0.6L_x/c$), however, the 3-D layer shows general thickening without the clear plasmoid structures so familiar in two dimensions. At some rare places (e.g.
 $x\approx z \approx 100 \sigma \rho _0$,
 $tc/L_x=1.1$–
 $2.3$), the layer remains very thin, as at X-points in two dimensions. In the vicinity of these thin places we still see some ballooning of the layer, resembling a larger plasmoid, but smaller (in
 $y$) than in two dimensions, and with much less distinct density structure. After
 $2.3L_x/c$, most of the layer is thick, but not as thick as plasmoids in two dimensions.
The  $L_z=L_x/32$ simulation is fairly uniform in
 $z$, consistent with its behaviour resembling 2-D reconnection. The 3-D simulation, however, is very non-uniform, as we will see in a series of plots showing various fields at time
 $t=2.3L_x/c$, at the centre of the layer, i.e. at
 $y_c(x,z,t)$ such that
 $B_x(x,y_c,z,t)=0$.
Figure 17 shows various quantities at the layer central surface,  $y_c(x,z,t)$ (cf. § 3.2), vs
 $x$ and
 $z$, for the
 $L_z=L_x$ case, at
 $t=2.3L_x/c$. We focus particularly on region
 $A$, a patch of size (at this time)
 $\simeq 100\sigma \rho _0$ located around
 $x\approx z \approx 100\sigma \rho _0$, which we believe to be an actively reconnecting region; we saw in figure 16 that it is a site where the layer is near its thinnest. Panel (a) shows the current density
 $J_z$ in the
 $z$-direction, which is indeed most prominent in this reconnecting region, consistent with the layer being thin. (We note that current sheets are locally not necessarily parallel to
 $z$, but are nearly parallel to
 $z$ in many places.) Panel (b) shows strong outflows from this region in the
 $\pm x$ directions, as one would expect from reconnection; similarly, region
 $B$, around
 $x\approx 320\sigma \rho _0$ and
 $z\approx 400\sigma \rho _0$ with size (at this time) similar to patch
 $A$, has a high current density and strong outflows. There are also smaller reconnecting regions – e.g. at
 $x\approx 260\sigma \rho _0$ and
 $z\approx 280\sigma \rho _0$. The ‘line’ between the outflows thus appears to be a stagnation line, which is commonly associated with an X-line in the classic 2-D picture of (symmetric) reconnection. Panel (c) shows
 $\|\boldsymbol {E}\|$, which is sizeable (
 $\sim 0.1 B_0$) over a significant region, especially in the neighbourhood of large, strong outflows. However, (panel d) the parallel electric field
 $|E_\||$ (parallel to the local
 $\boldsymbol {B}$) is largest only in a region much closer to the stagnation line, as expected. Panel (e) shows that
 $\boldsymbol {E}\boldsymbol {\cdot } \boldsymbol {J}$ has more strongly positive areas than negative, indicating energy transfer from electromagnetic fields to the plasma; this transfer occurs around X-lines and extended outflows, but as panel (f) shows, the region where
 $E_\| J_\|$ is most positive is limited to areas closer to the largest stagnation lines (in regions
 $A$ and
 $B$). Figure 17 thus suggests that reconnection is occurring in patches (such as regions
 $A$ and
 $B$), perhaps not with such neat geometry as in two dimensions, but exhibiting basic signatures, such as a thin layer with high current density, strong outflows, particle energization and indeed particle energization by parallel electric fields or by electric fields in a region of weak magnetic field.
Field quantities vs  $x$ and
 $z$ at the layer central surface, i.e. at
 $y=y_c(x,z,t)$ such that
 $B_x(x,y_c,z,t)=0$ (cf. § 3.2);
 $A$ and
 $B$ indicate – roughly – examples of actively reconnecting regions. (a) The current density in the
 $z$-direction,
 $J_z$, is highest in reconnecting regions, where the layer is thin. (b) Shows
 $\overline {v_x}=(v_{e,x} + v_{i,x})/c$, the average of electron and positron
 $x$-velocities, shows strong outflows from reconnection regions. (c) The electric field,
 $\|\boldsymbol {E}\|$ is largest in reconnecting regions and also in strong outflows. (d) Although small,
 $E_\|$, the magnitude of the component of
 $\boldsymbol {E}$ parallel to the local
 $\boldsymbol {B}$, is stronger in reconnecting regions. (e) Here,
 $\boldsymbol {E}\boldsymbol {\cdot } \boldsymbol {J}$ indicates dominant power transfer from fields to plasma, mostly in reconnecting and outflow regions. (f) Shows that
 $\boldsymbol {E}_\|\boldsymbol {\cdot }\boldsymbol {J}_\|$ is positive and strongest in reconnecting regions, indicating significant plasma energization by parallel electric fields (or electric fields where
 $B\approx 0$). All plotted quantities were averaged over
 $y_c-\sigma \rho _0 < y < y_c+\sigma \rho _0$.

Very early in time, the layer exhibits many small patches of active reconnection. At any point in time, a patch tends to have roughly the same size in  $x$ and
 $z$ (the
 $x$-extent can be seen in figure 16). For example, patches have size
 $\sim 20\sigma \rho _0$ at
 $t=0.3L_x/c$. It is perhaps therefore not surprising that the simulation with
 $L_z=L_x/32=16\sigma \rho _0$ – which is smaller than the patch size even at this early time – behaves like 2-D reconnection. Over time (for
 $L_z=L_x$), the number of reconnecting patches decreases rapidly, but the surviving patches grow in size, in both
 $x$ and
 $z$. By
 $2.3L_x/c$, the 3-D simulation has 2 major patches (regions
 $A$ and
 $B$), with perhaps a few much smaller, probably less active ones. By
 $4.6L_x/c$, only region
 $A$ remains, although it seems to have shrunk in the
 $z$ direction, perhaps spreading its current density a little wider in
 $x$. Importantly, region
 $A$ does continue to exhibit signs of active reconnection at these late-stage times, when the global reconnection rate is relatively slow in three dimensions. We leave a systematic investigation of the behaviour and statistics of these patches to future work.
Although the above-described patches in three dimensions locally resemble elementary reconnecting current sheets in two dimensions, important differences emerge away from these patches. As previously mentioned, we do not see the long-term storage of magnetic energy in highly structured plasmoids as in two dimensions; for example, in 3-D reconnection we do not see clear signatures of persistent, growing structures extended across the simulation in the  $z$-direction (as we would expect flux ropes to be), e.g. in figure 17. In (nearly) two dimensions, the magnetic field is somewhat diminished far upstream of major X-lines, e.g. to
 $\approx 0.7 B_0$ more than
 $100\sigma \rho _0$ upstream at
 $t=4.6L_x/c$; at the same time, the magnetic field rarely falls below
 $0.3B_0$ anywhere (figure 18a). In two dimensions, plasmoids continue to grow roughly up to the size of the simulation, when the magnetic configuration prevents further reconnection. In three dimensions, however, the current layer becomes a somewhat thickened turbulent region with relatively sharp boundaries (where most current flows) inside which the magnetic field is generally diminished. The magnetic field is practically full strength outside of the sharp boundaries, while being less than
 $0.3 B_0$ in a large fraction of the volume within the boundaries (figure 18b,c).
The magnetic field strength  $|\boldsymbol {B}|$ at
 $t=4.6L_x/c$ in the same
 $z$-planes shown in figure 16; (a) nearly two dimensions,
 $z=0$, (b) three dimensions,
 $z=100\sigma \rho _0$ and (c) three dimensions,
 $z=300\sigma \rho _0$. Contours are drawn for
 $B/B_0=\sqrt {0.1}\approx 0.32$ (dotted white),
 $\sqrt {0.3}\approx 0.55$ (dashed green) and
 $\sqrt {0.5}\approx 0.71$ (solid blue).

The evolution of current sheets in three dimensions is complicated, and demands much more study. For now, however, we will move on to consider one of the most important consequences of current sheet evolution and resulting energy conversion, namely NTPA.
Reconnection-driven NTPA is a promising candidate to explain, e.g. high-energy X-ray and gamma-ray emission from a variety of astrophysical sources. It has been previously suggested that NTPA in three dimensions might be suppressed by the RDKI interfering with reconnection (Zenitani & Hoshino Reference Zenitani and Hoshino2007, Reference Zenitani and Hoshino2008). And since the reconnection electric field responsible for accelerating particles is proportional to the reconnection rate, and we have shown here that the global reconnection rate is slower in three dimensions than in two dimensions, we have another reason to suspect that NTPA might be considerably less efficient in three dimensions. However, that is emphatically not the case here. Figure 19 shows electron energy spectra  $f(\gamma )$ (compensated by
 $\gamma ^2$) – compared both at the same time (
 $t=9 L_x/c$) and after the same amount of magnetic energy has been given to particles (
 $\Delta U_\textrm {plasma} \approx 0.17 \: U_{B0}$). Remarkably, all the spectra are pretty similar, exhibiting high-energy non-thermal behaviour with a power-law slope
 $\approx -4$ ( i.e.
 $f(\gamma )\sim \gamma ^{-4}$). However, though the difference may be small, 3-D reconnection yields more particles with very high energies than two dimensions; in addition, since ultimately 3-D reconnection can convert more magnetic energy to plasma energy than two dimensions, 3-D reconnection may accelerate more particles overall (not just at the very highest energies).
Electron energy spectra  $f(\gamma )$, compensated by
 $\gamma ^2$, where particle energy is
 $\gamma m_e c^2$, for
 $L_z/L_x=0$, 1/32, 1/8, 1, (a) at the same time,
 $t=9 L_x/c$ and (b) when the same amount of magnetic energy (
 $\simeq 17$ per cent) has been depleted. Dotted grey-on-yellow lines indicate a range of power-law slopes
 $f(\gamma )\sim \gamma ^{-3.4}$,
 $\gamma ^{-4}$ and
 $\gamma ^{-4.4}$.

NTPA continues to occur (in three dimensions) even during the second stage of reconnection, when the global rates of reconnection and magnetic energy conversion are smaller by an order of magnitude compared with the first stage. Figure 20 shows the spectra for  $L_z=L_x$ at four different times,
 $tc/L_x=1.1, 2.3, 4.3, 8.6$, chosen so that between successive times,
 $U_\textrm {plasma}$ increases by equal amounts, namely
 $0.04 U_{B0}$ – i.e.
 $\Delta U_\textrm {plasma}/U_{B0} = 0.05, 0.09, 0.13, 0.17$. Even after
 $t\simeq 3L_x/c$, when the magnetic energy is at 89 per cent and after which the reconnection rate drops significantly, we see that
 $f(\gamma )$ continues to increase at high energies. Indeed, the increase in
 $f(\gamma )$ preserves the power-law slope at high energies; the high-energy slope of
 $f(\gamma )$ does not decrease after
 $3L_x/c$, nor does the high-energy cutoff decrease (if anything, the opposite occurs, possibly indicating re-acceleration of already-energetic particles that have returned coincidentally to actively reconnecting regions).
Electron energy spectra  $f(\gamma )$, compensated by
 $\gamma ^2$, at different times for the 3-D case
 $L_z/L_x=1$: the spectra are shown at times
 $tc/L_x=1.1$, 2.2, 4.3 and 8.6, when fractions 0.05, 0.09, 0.13 and 0.17 of the initial magnetic energy
 $U_{B0}$ have been depleted. Power-law indices of 3.4, 4 and 4.4 are shown for reference, as in figure 19. Even though reconnection is much slower after
 $4L_x/c$ than before, significant NTPA occurs between
 $tc/L_x=$4.3 and 8.6.

It is possible that NTPA in three dimensions is at least as efficient as in two dimensions, despite the slower (global) reconnection rate in three dimensions, because in three dimensions the local reconnection rate is as high as in two dimensions within actively reconnecting patches. Thus NTPA may be occurring in a similar manner in two dimensions and in three dimensions, but in a relatively smaller region in three dimensions. This result is consistent with Yin et al. (Reference Yin, Daughton, Karimabadi, Albright, Bowers and Margulies2008); the global reconnection rate drops because there are fewer/smaller patches, not because local reconnection rates drop.
Furthermore, the stark contrast in plasmoid evolution in two dimensions and three dimensions might promote more efficient NTPA in three dimensions. In two dimensions, ballooning plasmoids expand deeply into the upstream, and can contain higher magnetic field than the upstream region; the magnetic fields of large plasmoids can trap high-energy particles (with Larmor radii a large fraction of the plasmoid size; Sironi et al. Reference Sironi, Giannios and Petropoulou2016; Uzdensky Reference Uzdensky2020). In three dimensions, however, any structures (flux ropes) formed from reconnected magnetic field decay (see also Zhou, Loureiro & Uzdensky Reference Zhou, Loureiro and Uzdensky2020); high-energy particles may be confined to the layer by the upstream magnetic fields, but probably not by distinct sub-structures within the current layer. The lack of trapping may result in more particle acceleration in three dimensions; whereas a particle trapped in a plasmoid does not get accelerated by reconnection (but could be accelerated by a different, slower mechanism; Petropoulou & Sironi Reference Petropoulou and Sironi2018), untrapped particles could potentially pass multiple times through reconnecting layers, thus experiencing a sort of multi-stage acceleration (Dahlin et al. Reference Dahlin, Drake and Swisdak2015; Zhang et al. Reference Zhang, Sironi and Giannios2021).
It is worth estimating, from a Hillas criterion perspective (Hillas Reference Hillas1984), the energy gain of a particle in a typical reconnection electric field  $E_\textrm {rec}\sim 0.04B_0$, traversing an entire patch of active reconnection. By
 $t=2.3L_x/c$, there is a patch (region
 $A$ in figure 17) in the simulation with
 $L_z=L_x$ that is about
 $\ell \sim 100\sigma \rho _0$ in size. Thus we estimate an energy gain
 $eE_\textrm {rec}\ell \sim 4 \sigma m_e c^2$, which is roughly consistent with the high-energy cutoff (a similar result was given for elementary current sheets in two dimensions, for high-
 $\sigma _h$ reconnection; Werner et al. Reference Werner, Uzdensky, Cerutti, Nalewajko and Begelman2016). We do not suggest this proves that all particles are being accelerated directly by the reconnection electric field; the acceleration mechanism is beyond the scope of this paper and remains under debate (see, e.g. Drake et al. Reference Drake, Swisdak, Che and Shay2006; Nalewajko et al. Reference Nalewajko, Uzdensky, Cerutti, Werner and Begelman2015; Ball et al. Reference Ball, Sironi and Özel2018, Reference Ball, Sironi and Özel2019; Guo et al. Reference Guo, Li, Daughton, Kilian, Li, Liu, Yan and Ma2019, Reference Guo, Li, Daughton, Li, Kilian, Liu, Zhang and Zhang2020; Kilian et al. Reference Kilian, Li, Guo and Li2020; Sironi & Beloborodov Reference Sironi and Beloborodov2020; Uzdensky Reference Uzdensky2020; Zhang et al. Reference Zhang, Sironi and Giannios2021), but at least for 2-D and 3-D reconnection with weak guide field, above-average-energy particles probably have gyroradii larger than the layer thickness and will experience more acceleration by the motional electric field of plasmoids,
 $\boldsymbol {E} = -(1/c)\boldsymbol {v}\times \boldsymbol {B}$ (Guo et al. Reference Guo, Li, Daughton, Kilian, Li, Liu, Yan and Ma2019, Reference Guo, Li, Daughton, Li, Kilian, Liu, Zhang and Zhang2020; Kilian et al. Reference Kilian, Li, Guo and Li2020; Uzdensky Reference Uzdensky2020). We offer this estimate simply as a way to compare system size with particle energies.
Thus we have seen both striking similarities and striking differences between 2-D and 3-D reconnection. Both convert significant amounts of magnetic energy to plasma energy, but the conversion rate is slower in three dimensions. Many of the signatures of reconnection at 2-D X-points (or X-lines) are apparent in 3-D simulations, but what happens in reconnection outflows is very different. While 2-D simulations beget a growing, highly structured hierarchy of distinct plasmoids containing energized particles and reconnected magnetic field, 3-D simulations only form small plasmoid-like features, which subsequently decay, allowing magnetic field energy in the layer to be converted to plasma energy. As a result, 3-D simulations ultimately convert more magnetic energy than in two dimensions. The decay of plasmoids in three dimensions means that the reconnected flux in those plasmoids is annihilated, while in two dimensions, flux is almost perfectly conserved, such that all the lost upstream flux ends up as reconnected flux inside plasmoids. In three dimensions, the lost upstream flux is mostly annihilated (and it is yet to be determined what fraction is directly annihilated and what fraction is first reconnected and later annihilated). Interestingly, perhaps the strongest similarity between 2-D and 3-D reconnection is NTPA; the spectrum of high-energy particles is very similar in both cases, especially if compared at times when the depleted magnetic energy is the same. With this overview finished, we will continue to examine differences between 2-D and 3-D reconnection in more depth.
5.2. Three dimensional reconnection: stochastic variability
An important difference between 2-D and 3-D current sheet simulations is the greater stochastic variability in three dimensions. When initializing the simulations, the initial electric and magnetic fields are precisely determined. However, the particle positions and velocities representing the plasma distribution in Monte Carlo fashion are chosen randomly (according to a precisely given distribution). Thus two ‘identical’ simulations will not be exactly the same, and the initial microscopic randomness can lead to variability at macroscopic scales.
In 2-D reconnection, two ‘identical’ simulations will yield different plasmoid formation, motion, and merging; this can affect the global reconnection and energy conversion rates. Smaller simulations often show greater stochastic variation in global quantities such as energy vs time, because there are fewer plasmoids overall, increasing the influence of erratic individual plasmoids. We have often observed that the process of plasmoid merging (especially in simulations without initial perturbation; cf. § 4.2) results in two monstrously large plasmoids in a layer spaced apart by nearly  $L_x/2$. These two plasmoids will ultimately merge; but by symmetry due to periodic boundary conditions, one plasmoid can either move left or right to merge with the other. This symmetry is always eventually broken to yield a lower-energy magnetic configuration, but its breaking can be ultimately traced to the initial microscopic randomness. As these plasmoids decide which way to go for the final merger, the magnetic energy often stagnates at a roughly constant level for a short time before rapidly declining during the final plasmoid merger (see, e.g. figure 7,
 $L_x/\sigma \rho _0=640$, 1280 and 2560, around 3–5
 $L_x/c$). However, due to randomness, sometimes the final two plasmoids are not created so symmetrically, and the magnetic energy decline continues smoothly. Thus we often describe reconnection as ‘bursty’; in radiative reconnection, where high-energy particles cool rapidly, e.g. via inverse Compton radiation, this burstiness is visible even in the spectrum of high-energy particles (Werner et al. Reference Werner, Philippov and Uzdensky2019).
Thus initial random particle positions and velocities lead to macroscopic variability in two dimensions at system-size scales. However, although significant, this stochastic variability is a sequence of random short detours on a path to essentially the same final state. In fact, § 4.2 showed that varying the initial current sheet configuration (varying more than just different random velocities from the same distribution) still had little effect on the overall evolution of reconnection. Looking at coarse time scales of  $O(L_x/c)$, the overall rate and amount of energy depletion are fairly independent of initial conditions (for the same upstream conditions).
In contrast, in a 3-D reconnection simulation, random initialization can lead to significant macroscopic differences that persist for long times – at least as long as we have been able to simulate. While a detailed study of random variation in large ensembles of ‘identical’ simulations is beyond the scope of this paper, we present here an anecdote of high variability in three dimensions in a case with  $L_x=256 \sigma \rho _0$ and
 $L_z=L_x/4$, which we ran three times with ‘identical’ set-ups (
 $B_{gz}=0$,
 $\eta =5$,
 $\beta _d=0.3$,
 $a=0$). The three simulations ultimately exhibit very different magnetic energy and flux evolution (figure 21) even over scales of tens of
 $L_x/c$; this variation is much greater than we see in two dimensions (although not perfectly comparable, figures 3, 5 and 7 place a rough upper bound on variability in two dimensions; also see figure 22). Nevertheless, despite these differences, the particle energy spectra are similar despite different energy evolution (figure 21c), with the exception of one case exhibiting a bump above
 $\gamma \gtrsim 10\sigma$. At early times, the evolutions of magnetic energy and flux (figure 21a,b) are reasonably similar, but they diverge after
 $\simeq 5L_x/c$. Simulation (A) starts off with the highest magnetic conversion rate but ends up converting the least amount (30 per cent) of magnetic energy after
 $30L_x/c$. Simulation (B) rapidly converts approximately 40 per cent of the magnetic energy within
 $10L_x/c$, and then continues to convert energy at a much slower rate for at least the next
 $20L_x/c$. And simulation (C) exhibits a medium-slow stage of energy conversion between 5 and 15
 $L_x/c$, followed by a stagnant or very slow final stage similar to the others.
Three-dimensional reconnection exhibits significant stochastic variability, as shown by three simulations (A, B, C) with  $L_x=256\sigma \rho _0$ and
 $L_z=L_x/4$, with otherwise identical parameters, but different initial random particle positions and velocities. Panels show: transverse magnetic energy (a) and unreconnected flux (b) vs time, and (c) particle energy spectra at
 $20L_x/c$, compensated by
 $\gamma ^4$.

In three dimensions a perturbation (which is uniform in  $z$) makes simulations behave more like 2-D simulations, especially at early times. These plots show energies and flux vs time for four simulation configurations: with perturbation (
 $s/\delta =6$, dashed lines) and without (
 $s=0$, solid), for 3-D (
 $L_z=L_x$, blue) and nearly 2-D (
 $L_z/L_x=1/16$, red) simulations. All have
 $L_x=341\sigma \rho _0$,
 $\eta =5$,
 $\beta _d=0.3$,
 $B_{gz}=0$. For two of the configurations –
 $L_z/L_x=1$,
 $s=0$ and
 $L_z=1/16,s/\delta =6$ – two runs are shown (identical except for initially randomized particles). The transverse magnetic energy,
 $U_{Bt}(t)/U_{B0}$ (a), is very similar for the 3-D simulation with perturbation and both 2-D simulations, but the 3-D simulation without perturbation converts magnetic energy much more slowly. The magnetic energy in the layer,
 $U_{Bt,{\rm layer}}(t)/U_{B0}$ (b), however, shows that the 3-D case with perturbation initially resembles the 2-D simulations, but after
 $3L_x/c$ depletes the ‘reconnected’ magnetic field energy in the layer. Similarly, the unreconnected magnetic flux
 $\psi (t)/\psi _0$ (c) shows that the 3-D case with perturbation lies between the 2-D cases and the 3-D case without perturbation.

One mechanism that can result in large random variation in three dimensions is the following. We will show in § 5.4 that in some cases RDKI causes the layer to kink to very large amplitudes (comparable to the kink wavelength). At some amplitude, the instability becomes highly nonlinear, resulting in severe distortion of the current sheet, somewhat resembling breaking waves; when this happens, magnetic energy is rapidly depleted, leaving a much-thickened layer that is much more stable against tearing and RDKI. This process rapidly transforms the layer, putting the simulation in a very different state. Some initial configurations (e.g. with higher  $\beta _d$, as we will see in § 5.4) seem to make this transformation more likely, but there appears to be a large range of conditions under which it is possible but not inevitable. Thus two ‘identical’ simulations, one that suffers this transformation and one that does not, may evolve very differently over long times (e.g.
 $50L_x/c$).
In light of this, we try to be careful in this study about not drawing conclusions from small differences between individual 3-D simulations.
5.3. Three-dimensional reconnection: dependence on initial current sheet configuration
We showed in § 4.2 that an initial magnetic perturbation barely affects energy conversion rates and NTPA in 2-D reconnection, despite some differences in the evolution of the plasmoid hierarchy (but see Ball et al. Reference Ball, Sironi and Özel2018, and our comparison with it at the end of § 4.2). Similarly, other parameters describing the initial current sheet can vary over a wide range without much affecting 2-D reconnection. Here, we explore a range of different current sheet configurations, as in § 4.2, but now in three dimensions, all the while keeping the upstream/background plasma the same. In the substudies (3D-a,b,c) below, we will vary the same parameters as in § 4.2, (2D-a,b,c). However, the range of varied parameters will be much more limited because of the increased cost of simulation in three dimensions; for instance, we examine only two different perturbation strengths in (3D-a) and two different values of  $\eta$ in (3D-b). As in § 4.2, we set
 $B_{gz}=0$. We will see that the initial current sheet has more long-term influence in three dimensions than in two dimensions.
Case (3D-a): varying the initial perturbation. In this substudy we will see that, in three dimensions, an initial magnetic field perturbation (uniform in  $z$) significantly alters the subsequent evolution – unlike in two dimensions, where the initial perturbation is relatively unimportant, as shown in § 4.2(2D-a). Perhaps the easiest way to describe the effect of a perturbation in three dimensions is that (in simulations with no guide magnetic field) the perturbation tends to make reconnection more like 2-D reconnection. Figure 22 shows energies and flux vs time, for perturbed and unperturbed initial current sheets, in a fully 3-D (
 $L_z=L_x$) simulation and – for comparison – in a nearly 2-D (
 $L_z=L_x/16$) simulation – all with
 $L_x=341\sigma \rho _0$,
 $\eta =5$,
 $\beta _d=0.3$ and
 $B_{gz}=0$. We consider only one non-zero perturbation strength,
 $a=12$, for which the initial magnetic separatrix height extends to about
 $s=6\delta = 4\sigma \rho _0\approx L_x/85$, beyond the current sheet but still very far from
 $L_y/4$. To give an idea of stochastic variability, we show two simulation runs for the nearly 2-D case without perturbation, and two for the 3-D case with perturbation. As expected from the 2-D simulations in § 4.2(2D-a), the nearly 2-D cases are almost identical in all three panels – the total transverse magnetic energy
 $U_{Bt}(t)$, the magnetic energy in the layer
 $U_{Bt,{\rm layer}}(t)$ and the upstream flux
 $\psi (t)$; the perturbation has no significant effect on energy or flux evolution in two dimensions. In contrast, the 3-D cases with
 $s=0$ and
 $s/\delta =6$ differ markedly; the
 $s=0$ case initially converts magnetic energy more slowly, with a correspondingly slower decline in unreconnected flux. Interestingly, the early energy evolution in three dimensions with perturbation (
 $s/\delta =6$) is very similar to the nearly 2-D cases (with and without perturbation). After
 $\:\sim 3L_x/c$, the initially perturbed 3-D simulation starts to exhibit slower energy conversion (compared with earlier times or with the 2-D case at times up to
 $t\lesssim 6L_x/c$), as shown in figure 22(a). Whereas the unperturbed 3-D case never has much magnetic energy
 $U_{Bt,{\rm layer}}$ in the layer, the perturbed 3-D simulation builds up energy in
 $U_{Bt,{\rm layer}}$ until
 $3L_x/c$, just as in two dimensions (figure 22b). After
 $3L_x/c$, the perturbed 3-D case continues to deplete magnetic energy by converting upstream magnetic field energy to plasma energy and also by converting
 $U_{Bt,{\rm layer}}$ to plasma energy. The amount of unreconnected flux
 $\psi (t)$ in the perturbed 3-D case also follows the 2-D cases up until
 $3L_x/c$; after that the decline of
 $\psi$ slows substantially in three dimensions but continues apace in two dimensions for another
 $~3L_x/c$. Although not shown here, the total magnetic energy continues to fall after
 $10L_x/c$ in both 3-D cases; for example it falls to 67 per cent of its initial value after
 $25L_x/c$ for the perturbed simulation and after
 $50L_x/c$ for the unperturbed 3-D case (and continues to drop further). The uniform-in-
 $z$ initial perturbation thus appears to kick-start reconnection in 2-D mode, creating long flux ropes that, being more uniform in
 $z$, are more stable; eventually 3-D effects appear, however, and the plasmoid structures decay along with their associated magnetic fields.
The electron energy spectra are fairly similar for all cases, as shown in figure 23, especially when comparing spectra at the same amount of total energy depleted ( $U_{Bt}=0.75U_{B0}$). The 3-D simulations have perhaps slightly more efficient NTPA than the nearly 2-D simulations (e.g. they have more particles with
 $\gamma \approx 10\sigma$), but this enhancement might be attributable to stochastic variation. The high-energy spectrum for the unperturbed 3-D simulation grows more slowly (than either the perturbed 3-D simulation or 2-D simulations), consistent with the slower energy conversion, and this is reflected in less NTPA at
 $t=9L_x/c$ relative to the other cases. Similarly, the perturbed 3-D simulations have converted more magnetic energy to plasma energy at
 $t=9L_x/c$ than the other cases, and they correspondingly show more particles at high energies. Differences in the high-energy spectra are magnified by plotting
 $\gamma ^4f(\gamma )$; although the perturbed 3-D cases appear to show significantly more NTPA than the 2-D or unperturbed 3-D cases, the difference is less than a 10 per cent change in power-law index
 $p\approx 4$.
Electron energy spectra (compensated by  $\gamma ^4$) for the same (perturbed/unperturbed, 2-D/3-D) simulations as in figure 22, are all fairly similar at the time when
 $U_{Bt}/U_{B0}=0.75$ (a) – the differences at high energy would hardly be remarkable were it not for the
 $\gamma ^4$. Spectra are also shown (b) at
 $t= 9L_x/c$, at which time simulations that have converted more magnetic field energy have more high-energy particles. For comparison, the grey/dashed line shows the initial spectrum at
 $t=0$ in all simulations; and a power-law segment with index
 $p=3.6$ (green/dotted) demonstrates a ten per cent (i.e. small) difference from
 $p=4$ (which would be horizontal). We note, since figure 22 shows only the first
 $10L_x/c$, that the 3-D case with
 $s=0$ does not reach
 $U_{Bt}(t)=0.75U_{B0}$ until approximately
 $t=20L_x/c$, while all the other simulations convert
 $0.25U_{B0}$ in approximately
 $5L_x/c$.

To avoid the early similarities between two and three dimensions with an initial perturbation, simulations discussed in the rest of § 5 will have zero initial perturbation.
Case (3D-b): varying current sheet density  $\eta$ with fixed
 $\beta _d=0.3$; i.e. varying
 $\delta /\sigma \rho _0$ for fixed
 $\delta /\rho _d=2.1$. Varying the overdensity
 $\eta =n_{d0}/n_{b0}$, and fixing
 $\beta _d=0.3$ while maintaining the Harris equilibrium, was seen to have relatively little effect on 2-D reconnection in large systems, as long as
 $\eta \gg 0.1$ (see § 4.2) – with the notable exception that decreasing
 $\eta$ (increasing
 $\delta /\sigma \rho _0$) merely delayed reconnection onset. As noted in § 4.2 (also see table 1), the initial gyroradius
 $\rho _d$ and skin depth
 $d_{ed}$ of the current sheet plasma, as well as its half-thickness
 $\delta$, all vary as
 $\eta ^{-1}$ when the upstream
 $n_{b0}$ and
 $\theta _{b}$ are kept constant (hence associated time scales also vary as
 $\eta ^{-1}$, explaining the onset delay). As
 $\eta$ varies, the thickness
 $\delta$ thus varies relative to upstream plasma scales, but not relative to the drifting plasma scales.
Here we examine overdensities  $\eta =1$ and
 $\eta =5$, in 3-D (
 $L_z=L_x$) simulations with
 $L_x=256 \sigma \rho _0$,
 $\beta _d=0.3$,
 $B_{gz}=0$ and zero initial perturbation. The choice of zero initial perturbation differs from § 4.2(2D-b), and is motivated by (3D-a), which showed that an initial perturbation can suppress 3-D effects, at least temporarily. Figures 24 and 25 compare energy and flux vs time, and resulting NTPA, for 3-D simulations with dense (
 $\eta =5$,
 $\delta =(2/3)\sigma \rho _0$,
 $\theta _d=0.10\sigma$) and less dense (
 $\eta =1$,
 $\delta =(10/3)\sigma \rho _0$,
 $\theta _d=0.52\sigma$) initial current sheets; for comparison, nearly 2-D simulations are shown for the same parameters as the 3-D simulations, except
 $L_z=L_x/16$. To estimate stochastic variability in three dimensions, we show the results of three simulations with
 $\eta =5$ and
 $L_z=L_x$ (but just one run each for
 $\eta =1$ and both nearly 2-D cases).
As in two dimensions, varying overdensity  $\eta$ in three dimensions does not dramatically affect the overall energy and flux evolution (differences shown here are attributable to finite system size). These plots show energies and flux vs time for four simulation configurations:
 $\eta =1$ (solid lines) and
 $\eta =5$ (dashed), three-dimensional (
 $L_z/L_x=1$, blue) and nearly two-dimensional (
 $L_z/L_x=1/16$, red). All have
 $L_x=256\sigma \rho _0$,
 $\beta _d=0.3$,
 $B_{gz}=0$, and
 $a=0$. Three different runs are shown for the three dimensional,
 $\eta =5$ case. The magnetic energy evolution
 $U_{Bt}(t)$ (a) shows slower energy conversion in three dimensions than in two dimensions as expected; but the difference between
 $\eta =1$ and
 $\eta =5$ in three dimensions is comparable to the difference in two dimensions(also it is comparable to the stochastic variation among the three three-dimensional,
 $\eta =5$ cases). The difference in two dimensions vanishes in larger systems (see § 4.2, 2D-b). The magnetic energy in the layer,
 $U_{Bt,{\rm layer}}(t)$ (b), evolves similarly in all the 3-D cases, very unlike the 2-D cases, which store significant energy in ‘reconnected’ field. Similarly, the unreconnected flux
 $\psi (t)$ (c) is similar for all 3-D cases, which differ greatly from the nearly identical 2-D cases.

Varying overdensity  $\eta$ does not have any more effect on NTPA in three dimensions than it has in two dimensions; and in two dimensions, the effect vanishes for larger system sizes (see § 4.2, 2D-b). These plots show the electron energy spectra (compensated by
 $\gamma ^4$) for the same simulations (
 $\eta \in \{1,5\}$, two dimensions/three dimensions) as in figure 24, at the time when
 $U_{Bt}(t)/U_{B0}=0.85$ (a), and at
 $t=10L_x/c$ (b). The grey/dashed line shows the initial spectrum at
 $t=0$ in all simulations.

The total transverse magnetic energy (figure 24a) shows that energy conversion is generally slower in three dimensions than in two dimensions, as expected (e.g. averaged over the first 10 $L_x/c$). Also, energy conversion is slower for
 $\eta =1$ than for
 $\eta =5$. However, the difference between the
 $\eta =1$ and
 $\eta =5$ cases is roughly the same in three dimensions as it is in two dimensions; and we saw in § 4.2 that in two dimensions this difference vanishes for larger systems. Therefore, any effect of
 $\eta$ could be entirely caused by the small system size; there is no indication that
 $\eta$ has a different effect in three dimensions than in two dimensions.
Most telling, the magnetic energy in the layer (figure 24b) is nearly independent of  $\eta$ in three dimensions; i.e. varying
 $\eta$ does not appear to enhance or inhibit 3-D effects significantly. Although we did not explore the effect of
 $\eta$ on 3-D simulations with an initial perturbation, we expect that a perturbation would make 3-D simulations more closely resemble 2-D simulations, which have at most a weak dependence on
 $\eta$.
The decay of upstream flux  $\psi (t)$ (figure 24c) also indicates no
 $\eta$-dependence in three dimensions beyond what exists in two dimensions. The 2-D cases have very similar
 $\psi (t)$;
 $\psi (t)$ is also similar for the 3-D cases, which exhibit slower decay than the 2-D cases (e.g. averaged over the first
 $10L_x/c$). As with total magnetic energy, the decay of upstream flux continues over much longer times than in two dimensions, at a slower pace than at early times.
Although it appears that  $\eta =1$ current sheets result in more efficient NTPA (figure 25), we note again that the difference in three dimensions between
 $\eta =1$ and
 $\eta =5$ is almost the same as the difference in two dimensions (a factor of
 $\sim 2$ in particle energy). This is especially clear when comparing particle energy spectra at the same amount of magnetic energy converted (namely, when
 $U_{Bt}/U_{B0}=0.85$). In fact, for each
 $\eta$, the spectra from corresponding 2-D and 3-D simulations are nearly the same, aside from a small burst of particles accelerated up to
 $\gamma \simeq 10\sigma$ for the two dimensional,
 $\eta =1$ case; however, this burst is probably the result of some randomness that would be averaged out in a larger simulation – moreover, the ‘burst’ is less than a factor of 2 in energy, and
 $f(\gamma )$ is already very low by such high energies. Thus we conclude that the effects of
 $\eta$ are no different in three dimensions than in two dimensions; and we note that the effects of
 $\eta$ diminish in two dimensions for larger systems (§ 4.2, 2D-b).
To summarize: considering energy and particle acceleration, we detect no differences between  $\eta =1$ and
 $\eta =5$ that are clearly linked to 3-D effects. However, an ensemble of larger 3-D simulations may be needed to rule out significant 3-D effects of
 $\eta$.
Case (3D-c): varying  $\beta _d\propto \eta ^{-1}$; i.e. varying
 $\delta /\rho _d$ for fixed
 $\delta /\sigma \rho _0=(10/3)\sigma \rho _0$. When we vary
 $\eta \propto \beta _d^{-1}$, we see dramatic differences in the evolution of 3-D current sheets, although NTPA will turn out to be similar in all cases. As described in § 4.2(2D-c), changing
 $\beta _d$ and
 $\eta$ together, to maintain a constant product
 $\eta \beta _d=0.3$, keeps
 $\delta =\sigma \rho _0/(\eta \beta _d)$ constant (with respect to upstream plasma scales), while
 $\delta /\rho _d=(2/3)(\beta _d^{-2}-1)^{1/2}$ varies. This allows us to study the evolution of different current sheet configurations while ensuring that the initial current sheet is always well resolved (
 $\delta /\Delta x = 10$) and of constant size relative to the simulation box (
 $(L_y/4)/\delta = 39$).
We consider cases that, in large 2-D simulations in § 4.2(2D-c), yielded essentially similar results; in three dimensions we use smaller systems,  $L_z=L_x=256 \sigma \rho _0$, but as in (2D-c),
 $B_{gz}=0$ and there is no initial perturbation. We scan over
 $\beta _d \in \{0.075$, 0.15, 0.3, 0.6
 $\}$, which implies
 $\eta \in \{4$, 2, 1, 0.5
 $\}$, respectively; corresponding parameters (see table 1) are
 $\delta /\sigma \rho _0=10/3$,
 $\delta /\rho _d \in \{$8.9, 4.4, 2.1, 0.89
 $\}$, and
 $\theta _d/\theta _b \in \{$0.50, 1.0, 2.1, 5.0
 $\}$. For comparison, we also show 2-D simulations with identical set-ups except for
 $L_z=0$.
Looking at overall characteristics, we notice first (in figure 26a) that the amount and rate of magnetic energy conversion is almost identical for the 2-D simulations, but varies drastically with  $\beta _d$ in three dimensions. Correcting for the difference in reconnection onset times, we see that over the first few
 $L_x/c$ after onset, the rate of magnetic energy conversion generally increases with
 $\beta _d$. For
 $\beta _d=0.6$, the rate is even faster than in two dimensions; for
 $\beta _d=0.3$ and
 $\beta _d=0.15$, it is a little slower than in two dimensions; and for
 $\beta _d=0.075$, the initial rate is the slowest of all. After a few
 $L_x/c$, all 3-D cases exhibit a slower stage of energy conversion; however, the behaviour becomes more complicated, depending non-monotonically on
 $\beta _d$. (It might not be useful to try to ascribe a direct
 $\beta _d$-dependence to the later time evolution. The dependence could involve an element of randomness, and it could depend on the state of the system after early evolution that did strongly depend on
 $\beta _d$. For example, it often happens that a simulation that converts more energy at early times will convert energy more slowly at later times – for example, comparing
 $\beta _d=0.6$ and
 $\beta _d=0.15$, or comparing
 $\beta _d=0.3$ and
 $\beta _d=0.075$.) The
 $\beta _d=0.6$ (3-D) case drastically slows down after
 $2L_x/c$, almost as in two dimensions, except that, being three-dimensional, it can convert somewhat more magnetic energy than in two dimensions. The
 $\beta _d=0.3$ case also slows fairly drastically (though not quite as much as
 $\beta _d=0.6$) and as a result converts much less energy over
 $20L_x/c$. In contrast, the
 $\beta _d=0.15$ case slows a bit, but maintains a more moderate magnetic energy conversion rate, and catches up to the
 $\beta _d=0.6$ case in terms of total magnetic energy conversion after
 $\simeq 15L_x/c$. The
 $\beta _d=0.075$ case goes from slow to slower, and, like
 $\beta _d=0.3$, does not convert as much energy over
 $20L_x/c$ as the other cases.
Varying  $\beta _d$ while varying
 $\eta$ (to hold
 $\eta \beta _d=0.3$ constant) dramatically alters reconnection in three dimensions, but not in two dimensions. These plots show energies and flux vs time, for eight simulations:
 $\beta _d\in \{$0.075,0.15,0.3,0.6
 $\}$ (hence
 $\eta \in \{4$,2,1,0.5
 $\}$), for both
 $L_z=L_x$ (three dimensions) and
 $L_z=0$ (two dimensions). All simulations have
 $L_x=256\sigma \rho _0$,
 $B_{gz}=0$ and
 $a=0$. The magnetic energy,
 $U_{Bt}(t)$ (a), is very similar for all 2-D cases, but the 3-D cases differ substantially in terms of rates and amounts of magnetic energy conversion. The magnetic energy in the layer,
 $U_{Bt,{\rm layer}}(t)$ (b), is again similar for all 2-D cases; the 3-D cases all exhibit the characteristic depletion of reconnected field energy, but differ by small amounts at early times. The unreconnected flux
 $\psi (t)$ (c) qualitatively resembles the magnetic energy, except that the 2-D simulations reconnect relatively more flux.

The magnetic energy in the layer (figure 26b) is again almost identical for all the 2-D cases. In three dimensions, however, we see some differences. The  $\beta _d=0.6$ case, which has such rapid energy conversion at very early times, shows a 2-D-like increase for
 $\simeq 1L_x/c$, before decaying in a characteristically 3-D manner. The
 $\beta _d=0.15$ case shows a smaller, slower rise before decaying, while the other cases (
 $\beta _d=$0.075, 0.3) never have much magnetic energy in the layer. Despite the differences, all 3-D cases strongly contrast with the 2-D cases, which store significant amounts of magnetic energy in the layer. Thus 3-D cases can convert more magnetic energy overall even while the upstream flux is less depleted.
The upstream magnetic flux evolution (figure 26c) is consistent with the overall magnetic energy depletion. As usual, more upstream flux must be reconnected in 2-D simulations to convert the same amount of magnetic energy, because in two dimensions much more of the upstream magnetic energy ends up stored in plasmoids. As we discussed above, in two dimensions, flux is very nearly conserved, with an increase in reconnected flux corresponding precisely to the decrease in upstream flux  $\psi$. In three dimensions, however, the lost upstream flux is eventually mostly annihilated (although some of it may first be reconnected before being subsequently annihilated).
Particle energy spectra are shown in figure 27 – both at times when 15 per cent of the initial magnetic energy has been lost (a), and at the same time,  $t=10\: L_x/c$ (b). All cases exhibit fairly similar NTPA, although when the spectra are compensated by
 $\gamma ^4$, differences are quite apparent. The trend is non-monotonic with the input parameters
 $\beta _d$ and
 $\eta$, which is not surprising given the non-monotonic dependence of energy conversion on these parameters. There is evidently a good deal of stochastic variation in these cases, and more work needs to be done to settle this issue. However, given that the time over which 15 per cent of the magnetic energy is converted differs by a factor of
 $\simeq 10$ for 3-D simulations with
 $\beta _d=0.6$ and
 $\beta _d=0.075$, the energy spectra are remarkably similar.
Although varying  $\beta _d$ with
 $\eta$ (holding
 $\eta \beta _d$ constant) dramatically affects energy conversion vs time, NTPA is less affected, especially when compared at the same
 $U_{Bt}/U_{B0}$. These plots show the electron energy spectra (compensated by
 $\gamma ^4$) for the same simulations (
 $\beta _d\in \{$0.075, 0.15, 0.3, 0.6
 $\}$, two dimensions/three dimensions) as in figure 26 at the time when
 $U_{Bt}/U_{B0}=0.85$ (panel a), and at
 $t=10L_x/c$ (panel b). For comparison, the grey/dashed line shows the initial spectrum at
 $t=0$; and a power-law segment with
 $p=4.6$ (green/dotted) demonstrates a 15 per cent (i.e. small) difference from
 $p=4$ (which would be horizontal).

The substantial differences in energy and flux depletion (in 3-D simulations with  $\beta _d=0.6$ and
 $\beta _d=0.075$) are very intriguing, and worthy of discussion in a separate section, § 5.4. Before that, we briefly summarize the results of this subsection.
Summary of 3D-a,b,c. In contrast to two dimensions, we have seen here and in § 5.2 (and will see in more detail in § 5.4) that current sheets in three dimensions display a greater variety of behaviours, and that the overall evolution is less inevitable, than in two dimensions. Rather, the current sheet evolution can take very different paths, depending on initial conditions and stochastic variability. For example, simulations with identical upstream conditions can convert rather different amounts of magnetic energy over  $\sim 20L_x/c$, whereas 2-D simulations with a wide variety of initial current sheets convert nearly the same magnetic energy when averaged over
 $\sim 2L_x/c$ time windows, despite some random variability on shorter time scales (e.g. figures 3, 5, 6, 7).
An initial magnetic field perturbation, uniform in the  $z$ dimension, triggers time evolution resembling 2-D reconnection at early times; however, at later times when 2-D reconnection would slow and approach a final stable magnetic configuration with substantial magnetic energy in plasmoids, 3-D simulations generally deplete the magnetic energy in the layer (as well as in the upstream). The effect of varying the overdensity
 $\eta =n_{d0}/n_{b0}$ for fixed
 $\beta _d$ (hence varying
 $\delta /\sigma \rho _0$ but constant
 $\delta /\rho _d=2.1$) is less clear, hard to distinguish amid stochastic variability and moderate system size, but our simulations did not show any effect of
 $\eta$ in three dimensions beyond what is observed in two dimensions (which is very minimal in large systems). In contrast, varying
 $\beta _d\propto \eta ^{-1}$ (hence varying
 $\delta /\rho _d$ while keeping
 $\delta /\sigma \rho _0=10/3$ fixed) had a pronounced effect on current sheet evolution, with larger
 $\beta _d$ leading to faster initial magnetic energy conversion and more conversion over
 $20L_x/c$ – and we will explore this next.
Overall, global NTPA is surprisingly consistent given the variety of behaviours evolving from different initial current sheet configurations. This is especially true if particle spectra are compared at times when the same amount of magnetic energy has been converted to plasma energy.
5.4. Three-dimensional reconnection: the effect of varying $\beta _d$ on RDKI amplitude

The linear and nonlinear stages of RDKI growth were investigated in detail in Zenitani & Hoshino (Reference Zenitani and Hoshino2007, Reference Zenitani and Hoshino2008), both in theory and in 2-D and 3-D simulation, including the effect of RDKI on NTPA. However, by exploring a range of initial parameters, specifically a range of initial drift speeds,  $\beta _d c$, we find that the evolution from the linear to the nonlinear stage can have varied and often important consequences for later evolution.
Varying  $\beta _d\propto \eta ^{-1}$, as in § 5.3(3D-c), to keep
 $\eta \beta _d=0.3$ constant, hence fixing
 $\delta /\sigma \rho _0=10/3$, leads to dramatic differences in current sheet evolution, including differences in the evolution of global quantities such as magnetic energy. Here, we show these differences in more detail, and attribute them to the maximum amplitude to which RDKI can grow before becoming nonlinearly saturated. In the following,
 $\Delta y_c$ is the amplitude of the rippling of the current sheet central surface,
 $y_c(x,z)$ (see § 3.2).
We start by looking at the same 3-D simulations run for § 5.3(3D-c), with common parameters  $L_z=L_x=256\sigma \rho _0$,
 $\eta \beta _d=0.3$,
 $\delta /\sigma \rho _0=10/3$,
 $B_{gz}=0$, and zero initial perturbation. We focus on the two extreme cases:
 $\beta _d=0.6$ (
 $\eta =0.5$,
 $\delta /\rho _d=0.89$), which shows very rapid, substantial magnetic energy conversion, followed by very slow, limited energy conversion; and
 $\beta _d=0.075$ (
 $\eta =4$,
 $\delta /\rho _d=8.9$), which shows slower energy conversion and less conversion overall after
 $20L_x/c$ (see table 1 for values of other relevant parameters).
The reason for these differences is illustrated in figure 28, which shows  $B_x(0,y,z)$ in the
 $x=0$ plane at the three different times when 0.2, 3 and 11 per cent of the initial magnetic energy has been converted to plasma energy, for the
 $\beta _d=0.6$ case (top) and
 $\beta _d=0.075$ (bottom). For
 $\beta _d=0.6$, the layer kinks with long wavelength (
 $\lambda _z \gg \delta$) and the RDKI amplitude
 $\Delta y_c$ can grow to a relatively large value,
 $\Delta y_{c*} \sim \lambda _z$, before becoming highly nonlinear; the nonlinear development causes the highly distorted layer to fold over on itself, rapidly depleting magnetic energy in a layer of thickness
 $\sim \lambda _z \gg \delta$. It is this process, and not 2-D-like reconnection (perhaps surprisingly, given that the energy conversion vs time resembles that in 2-D reconnection), that results in rapid energy dissipation at early times. In contrast, for
 $\beta _d=0.075$ (figure 28, bottom), the initial sheet kinks with short wavelength (
 $\lambda _z \lesssim \delta$); since
 $\Delta y_c$ cannot grow much beyond
 $\lambda _z$, the instability saturates before it can distort the sheet much (compared with
 $\delta$). In this case, the nonlinear RDKI can deplete magnetic energy only within a layer of thickness
 $\sim \lambda _z \lesssim \delta$.
Value of  $B_x(y,z)$ in the
 $x=0$ plane for three dimensions (
 $L_z=L_x$) for two cases, (a,b,c)
 $\beta _d=0.6$,
 $\eta =0.5$ and (d,e,f)
 $\beta _d=0.075$,
 $\eta =4$, each at three times, when the total magnetic energy
 $U_B$ has fallen to fractions 0.998, 0.97 and 0.89 of its initial value
 $U_{B0}$. For large
 $\beta _d$ (top) the kink wavelength is much longer than the current sheet thickness, and the sheet ripples with large amplitude
 $\Delta y_c$ while converting very little magnetic energy to plasma energy, until nonlinear development causes the sheet to fold over on itself, rapidly converting magnetic energy
 $0.08U_{B0}$ over a time
 $0.4L_x/c$. For small
 $\beta _d$ (bottom) the kink wavelength is short, and
 $\Delta y_c$ does not increase much beyond the original sheet thickness, resulting in slower magnetic energy conversion (
 $0.08U_{B0}$ over
 $5.4L_x/c$).

Zenitani & Hoshino (Reference Zenitani and Hoshino2007) derived the most unstable wavelength for RDKI in relativistic plasma (using two-fluid theory with an assumption that the current-carrying particles execute Speiser orbits within a sublayer of half-thickness  $\sqrt {\rho _d \delta }$, and ignoring the background plasma; an improved approximation for
 $\beta _d\gtrsim 0.8$ can be found in Hoshino Reference Hoshino2020):
 $\lambda _{z,{\rm RDKI}} = 16{\rm \pi} \gamma _d \beta _d^2 \delta = (32 {\rm \pi}/3)\beta _d \rho _d$, which can be significantly larger than
 $\rho _d$. For
 $\beta _d=0.6$,
 $\lambda _{z,{\rm RDKI}}\approx 23\delta = 75 \sigma \rho _0$ (in figure 28, we see
 $\lambda _z\approx 50 \sigma \rho _0$). For
 $\beta _d=0.075$,
 $\lambda _{z,{\rm RDKI}}\approx 0.3 \delta = \sigma \rho _0$ (in figure 28, we estimate very roughly,
 $\lambda _z\sim 7 \sigma \rho _0$). While the measured instability wavelength does not precisely match the theory, the qualitative behaviour is in agreement, and in any case, there is a strong correlation between
 $\lambda _z/\delta$ and the rate and amount of magnetic energy conversion.
In both these simulations we find that the maximum  $\Delta y_c$ is of the order of half the wavelength in the
 $z$-direction. For the
 $\beta _d=0.6$ case, the kink grows roughly to a maximum
 $\Delta y_{c*} \approx 20\sigma \rho _0 \approx 0.4 \lambda _{z}$; for the
 $\beta _d=0.075$ case,
 $\Delta y_{c*} \approx 3\sigma \rho _0 \approx 0.4 \lambda _z$. Given the uncertainty in these measurements, we might as well say
 $\Delta y_{c*} \approx \lambda _z/2$ for simplicity. We note that the largest kink amplitudes (for
 $\beta _d=0.6$) are a fraction
 $\Delta y_{c*}/(L_y/4)\lesssim 0.2$ of the global system; this fraction is sizeable, but not so close to 1 that we need to worry about the lower and upper current layers interacting.
We hypothesize that in three dimensions, RDKI at some wavelength  $\lambda _{z}$ grows linearly, without substantial magnetic energy conversion or NTPA due to RDKI, until it nears a critical amplitude,
 $\Delta y_{c*} \sim 0.5 \lambda _{z}$. If the kink mode grows beyond
 $\Delta y_{c*}$, RDKI becomes highly nonlinear and the current layer severely distorts, folding over on itself and rapidly depleting magnetic energy within
 $|y| < \Delta y_{c*}$. This yields a turbulent layer of thickness
 $\simeq 2\Delta y_{c*}$ with greatly diminished magnetic field. After this time, magnetic energy continues to be converted to plasma energy, but at a much slower rate because of the much thicker layer. Importantly, RDKI does not inevitably grow to
 $\Delta y_{c*}$; depending on the initial layer parameters and also on stochastic behaviour, it may not reach the nonlinear stage that severely distorts and rapidly transforms the initially thin current sheet.
This phenomenon of extreme nonlinear kinking can occur even in a 2-D simulation in the  $y$–
 $z$ plane, where tearing (at least in the
 $x$-direction) is forbidden and reconnection cannot occur (Zenitani & Hoshino Reference Zenitani and Hoshino2007). Although a systematic examination of RDKI without reconnection in 2-D
 $yz$ simulations is beyond the scope of this paper (but see, e.g. Zenitani & Hoshino Reference Zenitani and Hoshino2005a, Reference Zenitani and Hoshino2007, Reference Zenitani and Hoshino2008; Cerutti et al. Reference Cerutti, Werner, Uzdensky and Begelman2014b), we compare with one such 2-D simulation, identical in set-up with
 $\beta _d=0.6$ and
 $\eta =0.5$ (but lacking any
 $x$-dependence). There we see clear development of the kink instability growing to large amplitudes and developing highly nonlinear behaviour in figure 29 (which looks similar to figure 28, for
 $\beta _d=0.6$).
 $B_x(y,z)$ for 2-D (
 $y$–
 $z$ plane) simulations at two different times,
 $1.5 L_z/c$ and
 $2.3 L_z/c$, for an initial current sheet of thickness
 $\delta =(10/3)\sigma \rho _0$ with
 $\beta _d=0.6$ and
 $\eta =0.5$. Without
 $x$-dependence, tearing and reconnection are forbidden, but RDKI is allowed. The kink instability grows to large amplitudes, where the current layer becomes highly deformed (from the small-amplitude sinusoidal perturbation), folding over onto itself and depleting magnetic energy (compare with figure 28).

Indeed, this 2-D $yz$ configuration rapidly depletes magnetic energy, at least when it reaches the extreme nonlinear stage where the current layer is massively distorted. For comparison, in figure 30 we overplot results for the same set-up (
 $\beta _d=0.6$,
 $\eta =0.5$,
 $\delta /\rho _d=0.89$,
 $\delta =(10/3)\sigma \rho _0$,
 $a=0$,
 $L_y=512\sigma \rho _0$) but different dimensionalities: (i) 2-
 ${\rm D}xy$ with
 $L_x=L_y/2$ and
 $L_z=0$, (ii) 3-D with
 $L_x=L_z=L_y/2$ and (iii) 2-D
 $yz$ with
 $L_z=L_y/2$ and
 $L_x=0$. First, in panel (a), we see that magnetic energy is converted to particle energy more rapidly (presumably triggered by RDKI) in the 2-D
 $yz$ and 3-D simulations than by reconnection in 2-D
 $xy$, but that all cases exhibit rapid magnetic energy conversion (a decline in
 $U_B$) of roughly similar amounts. For example, they all convert approximately 20 %–25 % of
 $U_{B0}$ in less than 5
 $\:L_y/2c$ after onset and ultimately convert 20 %–27 % of
 $U_{B0}$ within 20
 $\:L_y/2c$ of onset; the initial energy conversion rate is somewhat slower for the 2-D
 $xy$ case than for the others, while the total energy converted to plasma energy is slightly higher for the 3-D simulation (most notably for
 $t\gtrsim 5L_y/2c$). Looking at the energy
 $U_{By}$ stored in
 $B_y$ field components (
 $U_{By}$ is a proxy for
 $U_{Bt,{\rm layer}}$ in the 2-
 $Dyz$ and 3-D cases), we see (panel b) that the 2-D
 $yz$ simulation has almost no
 $U_{By}$ (as expected), while the 3-D simulation develops a small
 $U_{By}$ that decays, and the 2-D
 $xy$ simulation stores
 $U_{By}$ permanently. Thus the 2-D
 $xy$ simulation sees a larger decrease in upstream magnetic energy than other cases, but some of that energy is transformed to ‘reconnected field’ energy rather than being converted to plasma energy.
A comparison of energy conversion and NTPA for 2-D $xy$, 3-D and 2-D
 $yz$ simulations with the same set-up and size, except for unsimulated dimensions: (a) (transverse) magnetic energy
 $U_{Bt}(t)$; (b) energy
 $U_{By}(t)$, stored in
 $B_y$ field components, a rough indicator of the amount of magnetic energy stored in the layer; (c) particle spectra (compensated by
 $\gamma ^4$) when
 $U_{Bt}$ has fallen to
 $0.84U_{B0}$ (cf. the grey dash-dotted line in a); (d) spectra at
 $t=11.4\:(L_y/2)/c$. The 2-D
 $xy$ simulations exhibit familiar 2-D reconnection but not RDKI; the 2-D
 $yz$ simulations can undergo RDKI but not reconnection.

The similarities among these three cases are striking, especially considering that the 2-D $xy$ simulation exhibits classic reconnection, which is forbidden in 2-D
 $yz$. The 2-D
 $xy$ case conserves flux, while the 2-D
 $yz$ simulation directly annihilates upstream flux. We see clear suggestions of both these 2-D behaviours in three dimensions – plasmoid formation and the growth of
 $U_{Bt,{\rm layer}}$ (as in the 2-D
 $xy$ case) and rapid magnetic energy depletion due to nonlinear kinking of the current sheet (as in the 2-D
 $yz$ case; see § 5.5 for more detail). Thus in three dimensions, we expect that classic reconnection occurs to some extent, converting upstream flux to flux around plasmoids (as in 2-D
 $xy$), and that some upstream flux is directly annihilated (as in 2-D
 $yz$); furthermore, there is a unique 3-D effect, namely the dissipation of plasmoids and annihilation of the associated ‘reconnected’ flux. Without much more extensive diagnostics, it is difficult to determine how much upstream flux is directly annihilated as opposed to reconnected and then annihilated, i.e. to determine precisely the extents to which the different 2-D-like processes occur in three dimensions.
Interestingly, all these cases exhibit similar NTPA, despite the fact that very different mechanisms come into play in (at least) the 2-D $xy$ and 2-D
 $yz$ simulations. Compensating
 $f(\gamma )$ by
 $\gamma ^4$, however, we do see some differences. If we compare the spectra at times when the magnetic energy has fallen by 16 per cent (figure 30c), we find that NTPA is strongest for 2-D
 $xy$, followed by 2-D
 $yz$, and weakest for three dimensions; here, differences in
 $f(\gamma )$ reach an order of magnitude, but this is not as significant as it might seem, considering the steepness
 $f(\gamma )\sim \gamma ^{-4}$ – the spectra are separated by less than a factor of 2 in
 $\gamma$ (or energy). Over time, the 3-D case develops stronger NTPA, and the three cases look fairly similar; differences in
 $f(\gamma )$ are less than a factor of a few, which, again, is relatively little considering the steep slope. At late times (e.g. around
 $11L_y/2c$, figure 30d), the 3-D case has the hardest spectrum (shallowest slope).
Whereas Zenitani & Hoshino (Reference Zenitani and Hoshino2007, Reference Zenitani and Hoshino2008) also observed RDKI becoming nonlinear, those works observed little NTPA due to RDKI (for zero guide field) – in the linear stage, but also specifically in the nonlinear stage. In contrast, when a long-wavelength RDKI mode ( $\lambda _{z} \gg \delta$) reaches the nonlinear stage, we observe much more rapid magnetic energy declines than in the linear stage, and the nonlinear stage generates significant NTPA.
Although we must leave a systematic exploration of 2-D $yz$ simulations to future work, we note that 2-D
 $yz$ simulations with lower
 $\beta _d$ often do not show the violent nonlinear growth of the kink instability at large amplitudes (as in three dimensions; see figure 28). In these cases, less magnetic energy is converted overall, although slow magnetic energy conversion can continue for tens of light-crossing times (as in three dimensions), and there is often no significant NTPA at all.
When looking at 3-D simulations with different  $\beta _d$, and comparing them with 2-D reconnection, the similarly rapid magnetic energy conversion in 2-D reconnection and 3-D simulations with large
 $\beta _d$ (small
 $\delta /\rho _d$) might seem to suggest that these 3-D simulations exhibit 2-D-like reconnection. This is (mostly) not the case here. The 3-D simulation with large
 $\beta _d=0.6$ has relatively long
 $\lambda _{z,{\rm RDKI}}$ and exhibits extreme nonlinear kinking that much more closely resembles the 2-D
 $yz$ simulation; it bears little resemblance to the 2-D
 $xy$ simulation in terms of magnetic field structure. While magnetic reconnection could be playing a role at small scales in the 3-D simulation with
 $\beta _d=0.6$, its strong resemblance to the 2-D
 $yz$ simulation suggests that reconnection may be unimportant at early times when magnetic energy conversion is dominated by the nonlinear RDKI.
If long-wavelength kink modes grow to large amplitudes and distort the current layer enough to suppress reconnection, in the process converting magnetic energy and producing NTPA, then we will need to understand how this extreme-kinking mechanism compares with large-scale reconnection (considering both 2-D and 3-D reconnection models). If, as the  $\beta _d=0.6$ simulation in this section suggests, extreme kinking results in similar NTPA and overall energy conversion (in terms of both rate and amount) as 2-D reconnection, then this mechanism becomes a competing candidate to explain phenomena for which reconnection has been invoked as an explanation. One important difference is that guide magnetic field is believed to curtail RDKI rather severely (Zenitani & Hoshino Reference Zenitani and Hoshino2008). Another important difference is that the layer distortion appears to be self-limiting in the following sense: it depletes magnetic energy within a thickness
 $2\Delta y_c \sim \lambda _{z,RDKI}$, resulting in a much thicker layer no longer highly unstable to RDKI. (The same might be said of the tearing instability, which would saturate when the plasmoids fed by an elementary reconnecting current sheet grow to a height in
 $y$ comparable to the elementary current sheet length in
 $x$; however, in a large reconnecting system, the plasmoids detach from the elementary current sheet before growing so large and coalesce with other plasmoids, thus always maintaining thin current sheets. Consequently tearing and reconnection do not saturate until the plasmoids become comparable to the system size.) For our 3-D simulations,
 $\lambda _{z,{\rm RDKI}}$ happens to be a significant fraction of the system size, and so this mechanism yields dramatic conversion of magnetic to plasma energy. However, if the most unstable wavelength
 $\lambda _{z,{\rm RDKI}}$ is independent of system size, then in the limit of astronomically large systems, this mechanism may convert a negligible fraction of available magnetic energy, while suppressing reconnection. In contrast, 2-D reconnection is self-limiting (in a closed system) only when plasmoids grow to a size
 $\sim L_x$ that scales with the system size. We believe reconnection would continue for an arbitrary time, given a large-enough system. (This is perhaps a remarkable property of 2-D reconnection – that the macroscopically large plasmoids do not destroy the kinetic-scale current sheets where reconnection occurs.)
On the other hand, because the maximum kink amplitude depends on the wavelength,  $\Delta y_{c*} \sim \lambda _{z}/2$, it might be a mistake to assume that the most prominent or influential wavelength corresponds to the RDKI mode with the highest growth rate. The most unstable mode might saturate without thickening the layer much, while a more slowly growing mode with a longer wavelength might eventually reach a much larger amplitude. This possibility needs further study; however, we will show in the following section that some simulations (with
 $\beta _d=0.3$) initially kink on a scale
 $\lambda _z \ll L_z$, but nonetheless over time develop large-amplitude kinking on the scale of the system,
 $\lambda _z = L_z$. Whether such behaviour can scale with system size remains an outstanding question.
If large-amplitude kink modes are not inevitable, as some of our simulations suggest, it may be that short-wavelength RDKI modes develop and rapidly saturate, before their amplitudes grow much past the current sheet thickness. In this case, RDKI may have a negligible effect on reconnection; although it appears that reconnection in this regime is slow (though perhaps locally fast, as suggested in § 5.1), this slowness may not have anything to do with RDKI.
5.5. Three dimensional reconnection: $L_z$-dependence

In this subsection, we systematically vary  $L_z$ to explore when and how 3-D effects arise with increasing
 $L_z$. We consider
 $L_z/L_x\in \{$0, 1/32, 1/16, 3/32, 1/8, 1/4, 1/2, 1, 3/2
 $\}$ (where
 $L_z=0$ means 2-D) for system size
 $L_x=341\sigma \rho _0$,
 $\eta =5$,
 $\beta _d=0.3$,
 $\delta =(2/3) \sigma \rho _0$,
 $B_{gz}=0$, and zero initial perturbation.
We begin by looking at magnetic energy vs time in figure 31 (we note that the total and transverse magnetic energy,  $U_{B}$ and
 $U_{Bt}$, are nearly the same; in all these cases,
 $U_{Bz} < 0.004U_{B0}$). In panel (a), we see that in two dimensions and nearly two dimensions (i.e.
 $L_z/L_x \ll 1$),
 $U_{Bt}(t)$ decays rapidly over
 $\sim 8 L_x/c$; after this time, reconnection releases very little additional magnetic energy. As
 $L_z$ increases, the initial rate of magnetic energy depletion slows, but ultimately more magnetic energy is converted to particle energy – the case
 $L_z=L_x/2$ is an outlier, transferring almost half the initial magnetic energy to particles (compared with less than
 $0.3U_{B0}$ for two dimensions). In these large-
 $L_z$ cases, we often see a stage of relatively fast magnetic energy conversion (
 $\lesssim 5 L_x/c$), followed by a later stage of much slower energy conversion. Even after
 $50L_x/c$, slow energy conversion continues.
Total transverse magnetic energy  $U_{Bt}(t)$ (a), magnetic energy in the layer
 $U_{Bt,{\rm layer}}(t)$ (b) and unreconnected flux
 $\psi (t)$ (c), for simulations with the same
 $L_x=341\sigma \rho _0$,
 $B_{gz}=0$,
 $\eta =5$,
 $\beta _d=0.3$,
 $a=0$, but varying
 $L_z/L_x$. Cases
 $L_z/L_x=$1/16 and 1/8 each show two simulations identical except for random initialization of particles. In the plot of
 $U_{Bt}$ (a), the horizontal grey dashed line indicates
 $U_{Bt}=0.75U_{B0}$ – NTPA spectra are shown in figure 33 when
 $U_{Bt}(t)$ crosses this line. In the flux plot (c), the intersections of the two horizontal grey, dashed lines with
 $\psi (t)$ indicate where the average reconnection rate is measured for figure 32; three grey, dotted lines show the slopes for constant reconnection rates
 $\beta _\textrm {rec}\in \{$0.04,0.004,0.0004
 $\}$ normalized to
 $cB_0$.

It is important to remember that, in the large- $L_z$ (3-D) regime, stochastic variability can be considerable (cf. § 5.2). Because of high computational costs, we were unable to run multiple simulations for each value of
 $L_z$; e.g. determining whether the dramatic energy release is caused by the special value of
 $L_z/L_x=1/2$ or is merely a statistical outlier, will have to be left to future studies. In the meantime, we can have confidence only in clear, monotonic trends with
 $L_z$. A possible reason for the increased stochastic variability in three dimensions was discussed in § 5.4, and we will explore this further at the end of this subsection.
The clearest signature of the effect of  $L_z$ is the ‘reconnected magnetic field energy’ (figure 31b), which (at any fixed time
 $t$) decreases nearly monotonically with
 $L_z/L_x$. We interpret this as follows, as discussed previously in § 5.1. In two dimensions, reconnection results in magnetic energy being stored in plasmoids; in the fully 2-D simulation, the magnetic energy in the layer (predominantly in plasmoids) thus grows monotonically. In three dimensions, reconnection can pump magnetic energy into plasmoids, but these magnetic structures are unstable (at least in the absence of appreciable guide field): they decay, converting their magnetic energy over time into plasma energy. The almost-2-D simulation with
 $L_z=L_x/32$ pumps nearly as much energy into plasmoids as the fully 2-D simulation, but after
 $10L_x/c$ this energy starts to decay slowly. As
 $L_z/L_x$ becomes larger, the peak energy stored in plasmoids decreases.
We remind the reader that our measure of ‘reconnected-field energy’ is the magnetic energy that is not in unreconnected field lines. It is thus an upper bound on the energy stored in structures formed from reconnected magnetic field; it could also contain, e.g. turbulent magnetic energy in the current layer.
The unreconnected magnetic flux (figure 31c) shows the expected overall decay over time as flux is reconnected or annihilated. At any fixed time  $t$, the remaining upstream flux tends to increase with
 $L_z/L_x$ (i.e. larger
 $L_z/L_x$ implies a slower reconnection rate) – with the striking exception of
 $L_z/L_x=1/2$, and the less striking exception of
 $L_z/L_x=3/2$. Also, at very late time (
 $\simeq 40L_x/c$) we see the
 $L_z/L_x=1/4$ case overtaking
 $L_z/L_x=1/8$ in the amount of flux decay. This may represent a trend with increasing
 $L_z/L_x$ up to some minimally 3-D value
 $L_z/L_x \sim 1/4$, above which results are independent of
 $L_z/L_x$ (but with high stochastic variability); a statistical ensemble of simulations with large
 $L_z/L_x$ will be needed to distinguish the real trend.
Normalized to  $B_0 c$, the reconnection rates
 $\beta _\textrm {rec}$ (cf. § 3.3) for all cases start out between 0.025–0.05, with larger
 $L_z/L_x$ already exhibiting slightly lower
 $\beta _\textrm {rec}$; this is at very early times, probably dominated by the initial thin Harris sheet. Within
 $10L_x/c$, the reconnection rates have all fallen below 0.01 – because reconnection has finished in nearly 2-D cases, and because 3-D cases enter a stage of much slower reconnection. Figure 32 shows reconnection rates averaged over the time for the unreconnected flux to fall from
 $0.9\psi _0$ to
 $0.8\psi _0$, as a function of
 $L_z/L_x$. (We note that, for
 $L_z/L_x \leq 1/8$,
 $\psi (t_{0.8})=0.8\psi _0$ for
 $t_{0.8}<4L_x/c$.) For 3-D simulations, the average rates should be used with caution, because the reconnection rate can change substantially during this time (cf. figure 31c). In any case, it shows clearly how much slower 3-D reconnection can be. At later times, the cases
 $L_z/L_x\geq 1/4$ eventually exhibit reconnection rates
 $\beta _\textrm {rec}\sim 10^{-3}$ (this measurement does not necessarily guarantee that 2-D reconnection is actually taking place; flux could be depleted by direct annihilation as well as 2-D-like reconnection – cf. §§ 3.1 and 5.1). It is notable that by
 $\gtrsim 30L_x/c$, e.g. the
 $L_z/L_x=1$ simulation has ‘used up’ only about half the upstream flux as the 2-D simulation, but has converted more magnetic energy to particle energy, because in two dimensions more magnetic flux and energy remains in plasmoids.
Reconnection rates, normalized to  $B_0 c$ on the left axis and to
 $B_0v_A$ on the right (cf. § 3.3), vs
 $L_z/L_x$, averaged over the period during which the upstream flux falls from
 $0.9\psi _0$ to
 $0.8\psi _0$ (between the horizontal grey dashed lines in figure 31c), for simulations with
 $L_x=341\sigma \rho _0$. N.B. For 3-D cases, the values of the instantaneous reconnection rate may vary significantly over the averaging time, and stochastic variability may also introduce significant uncertainty.

Figure 33(a) shows particle energy spectra at times when 25 per cent of the initial magnetic energy has been depleted – i.e. when  $U_{Bt}(t)=0.75U_{B0}$; the times can be estimated from the intersection of
 $U_{Bt}(t)$ and the horizontal grey dashed line in figure 31(a), and range from
 $t=$5–8
 $L_x/c$ for
 $L_z/L_x\leq 0.5$, and
 $t=15$–
 $18L_x/c$ for
 $L_z/L_x\in \{1,1.5\}$. We see first that all these spectra are fairly similar, especially for
 $\gamma \lesssim 10\sigma$; and even above
 $\gamma \gtrsim 10\sigma$, spectra vary by less than a factor of 2 in energy, with the exception of
 $L_z/L_x=1/4$, which accelerates some particles to unusually high energies (we note that a different case,
 $L_z/L_x=1/2$, is the outlier in total magnetic energy depletion). Second, however, there is a trend of increasing numbers of high-energy particles (say with
 $\gamma \simeq 10\sigma$) as
 $L_z/L_x$ increases, at least for small
 $L_z/L_x$. Looking at spectra at the same time,
 $20L_x/c$, we see differences enhanced somewhat, with competing effects: larger
 $L_z/L_x$ yields slightly more high-energy particles, but larger amounts of magnetic energy conversion also yield more high-energy particles.
Particle energy spectra (compensated by  $\gamma ^4$) for different
 $L_z/L_x$, for
 $L_x=341\sigma \rho _0$, at the time when 25 per cent of the initial magnetic energy has been depleted (a – and cf. figure 31a), and at time
 $t=20L_x/c$ (b). The spectra are rather similar (especially in a), except possibly for the
 $L_z=L_x/3$ case, but there is a rough trend of increasing numbers of high-energy particles as
 $L_z/L_x$ increases. Dotted grey lines show the slope of the power law
 $f(\gamma )\sim \gamma ^{-3.4}$; local power-law indices in the high-energy spectrum range from roughly 4.2 to 3.4.

Although the somewhat short range of the high-energy power-law section prevents us from measuring precise power-law indices in a useful way, we can roughly characterize the local power-law indices as varying between 4.2 and 3.4 (in figure 33, horizontal represents a power law  $\gamma ^{-4}$, and dotted grey lines show
 $\gamma ^{-3.4}$). Whereas simulations with
 $L_z/L_x\leq 1/8$ have power-law indices closer to 4, those with larger
 $L_z/L_x\geq 1/4$ appear to exhibit harder power laws with indices around 3.4 in the range
 $3 \lesssim \gamma /\sigma \lesssim 8$ – however, these same simulations also have slightly steeper power-law indices around 4.2 in
 $2 \lesssim \gamma \lesssim 3$. An alternative measure of NTPA efficiency is the fraction of particles accelerated beyond some high energy, e.g.
 $\gamma =10\sigma$. Figure 34 shows that this fraction increases significantly with
 $L_z/L_x$ until saturating around
 $L_z/L_x\approx 0.1$; thus 3-D simulations accelerate almost an order of magnitude more particles beyond
 $\gamma =10\sigma$.
The fraction of particles with Lorentz factor  $\gamma >10\sigma$ for the spectra shown in figure 33 – blue circles for spectra at time
 $t$ such that
 $U_{Bt}(t)=0.75U_{B0}$, and red x symbols for spectra at
 $t=20L_x/c$. Although the trend with
 $L_z/L_x$ appears fairly robust, the significance of these results must be carefully considered due to the steep power law. For example, increasing the threshold from
 $10\sigma$ to
 $12\sigma$ lowers the fraction of threshold-exceeding particles by a factor of 4–6 (for all
 $L_z/L_x$).

Enhancement of electron NTPA in 3-D, relative to 2-D reconnection, has been previously observed in subrelativistic electron–ion plasma with  $B_{gz}=0$ as well as with guide field
 $B_{gz}/B_0\leq 1.5$ (Dahlin et al. Reference Dahlin, Drake and Swisdak2015, Reference Dahlin, Drake and Swisdak2017; Li et al. Reference Li, Guo, Li, Stanier and Kilian2019), and has just recently been seen in pair plasma with
 $\sigma _h=10$,
 $B_{gz}/B_0=0.1$ (Zhang et al. Reference Zhang, Sironi and Giannios2021); high-energy electrons were trapped by plasmoids in two dimensions, but not in three dimensions, thus allowing untrapped electrons to experience more acceleration in three dimensions. In the subrelativistic case, there is some disagreement over whether the high-energy spectra in question are power laws or exponentials; a steep power law with index
 $p\gtrsim 4$ over a relatively small range in
 $\gamma$ can look very much like an exponential decay in
 $\gamma$. An apparently dramatic
 $f_{3D}(\gamma )/f_{2D}(\gamma )=10$ (measured at very high energies by Dahlin et al. Reference Dahlin, Drake and Swisdak2017) can be interpreted as particles gaining a less dramatic 20 or 30 per cent more energy in three dimensions than in two dimensions. In the more relativistic
 $\sigma _h=10$ case, the shallower/harder power law around
 $p\sim 2$ shows NTPA more clearly, and the highest-energy particles in 3-D gain approximately 2–3 times more energy than in two dimensions (Zhang et al. Reference Zhang, Sironi and Giannios2021). In our simulations we find, whether comparing 2-D and 3-D simulations at the same time or at the same
 $U_{Bt}/U_{Bt0}$, that usually
 $0.1 < f_{3D}(\gamma )/f_{2D}(\gamma ) < 10$, and the ratio is often quite close to 1, especially when comparing the spectra at the same
 $U_{Bt}/U_{Bt0}$. Although these spectra are power laws, they are steep power laws (
 $f(\gamma )\sim \gamma ^{-4}$) and so again even a substantial
 $f_{3D}/f_{2D}$ may imply only a rather modest increase in particle energy. For example, if
 $f_{2D}(\gamma )=a \gamma ^{-4}$ for some constant
 $a$, and
 $f_{3D}(\gamma ) = 10 f_{2D}(\gamma )$, we can write
 $f_{3D} \approx a (\gamma /1.78)^{-4}$ – particles in three dimensions need only gain 78 per cent more energy in three dimensions than in two dimensions to explain
 $f_{3D}/f_{2D}=10$.
Our results are not inconsistent with increased NTPA in three dimensions, but from our perspective, the differences in NTPA between two dimensions and three dimensions, compared at the same  $U_{Bt}/U_{Bt0}$, are fairly insignificant, of the order of stochastic variation (regardless of guide field, as we shall see in § 5.6). Three-dimensional simulations convert magnetic energy less rapidly than 2-D simulations, and so the building-up of the high-energy part of
 $f(\gamma )$ occurs more slowly; however, as 3-D simulations convert more magnetic energy to particle energy over long times (compared with two dimensions), they ultimately accelerate more particles than 2-D simulations. Therefore, NTPA is enhanced in three dimensions relative to two dimensions, but the shape of the high-energy power-law spectrum and cutoff (up to an overall normalization factor) does not differ significantly.
We have remarked several times on the stochastic variability in 3-D reconnection (cf. §§ 5.2 and 5.3) and have discussed a mechanism for large variability in § 5.4. When an RDKI mode grows beyond an amplitude  $\Delta y_{c*}$ of the order of its wavelength
 $\lambda _z$, it becomes extremely nonlinear, and the current layer folds over on itself and rapidly depletes magnetic energy within
 $|y|\lesssim \Delta y_{c*}$. In figure 31, the simulation with
 $L_z/L_x=1/2$ experienced particularly large energy depletion, converting significantly more magnetic energy to plasma energy in
 $20L_x/c$ than any other simulation did in
 $50L_x/c$, including simulations with
 $L_z/L_x=1/4$ and
 $1$. Indeed, this simulation (
 $L_z=L_x/2$) developed a large-amplitude RDKI mode with the largest-possible wavelength,
 $\lambda _z=L_z$, and it became highly nonlinear, rapidly depleting magnetic energy in a thick layer. Figure 35(a) shows the offset of the layer central surface (§ 3.2),
 $\Delta y_c(x,z,t) \equiv y_c(x,z,t)-y_c(x,z,0)$, at four times:
 $tc/L_x\in \{$0.9, 2.6, 7.7, 23
 $\}$; then figure 35(b) shows the Fourier spectrum (in
 $z$, averaged over
 $x$; cf. § 3.2) of this quantity for each time. At early times,
 $t=0.9L_x/c$, RDKI develops prominently at
 $\lambda _z\approx L_z/10 = 17 \sigma \rho _0$. At later times, the most prominent wavelength gets longer; at
 $t=7.7L_x/c$, rippling with
 $\lambda _z=L_z$ is the dominant component. Indeed, by this time, there are clear signs of nonlinear development and the layer folding over on itself (causing rapid magnetic energy conversion). By
 $t=23L_x/c$, the layer has become generally thick and turbulent with weak magnetic field, and the long-wavelength rippling with
 $\lambda _z=L_z$ is no longer so apparent.
(a) The layer central surface displacement from the original midplane,  $\Delta y_c(x,z)$ (cf. § 3.2), at four times,
 $tc/L_x\in \{$0.86, 2.6, 7.7, 23
 $\}$, shows low-amplitude short-wavelength RDKI modes dominating at early times, but at later times the dominant mode has
 $\lambda _z=L_z$. At
 $7.7L_x/c$ (and thereafter), abrupt spatial variation in
 $\Delta y_c$ indicates the layer folding over on itself. (b) Fourier spectra magnitudes (cf. § 3.2) of the data shown on the left, averaged over all
 $x$ (after taking the magnitudes), show that over time, longer-wavelength RDKI modes grow to larger amplitudes.

According to Zenitani & Hoshino (Reference Zenitani and Hoshino2007), the wavelength of the fastest-growing (linear) RDKI mode is  $\lambda _{z,{\rm RDKI}} = 16{\rm \pi} \gamma _d \beta _d^2 \delta = 4.7\delta = 3\sigma \rho _0$. However, this fastest-growing mode should saturate at an amplitude
 $\Delta y_{c*}\sim \lambda _{z,{\rm RDKI}}/2$ (cf. § 5.4), whereas longer-wavelength modes can grow (though possibly at a slower rate) to larger amplitudes. Indeed, figure 35 is very roughly consistent with longer-wavelength modes growing slower, but to larger amplitudes,
 $\tilde {y}_c(k_z) \sim k_z^{-1}$ (where
 $k_z=2{\rm \pi} /\lambda _z$). For some reason, in the simulation with
 $L_z=L_x/2=170\sigma \rho _0$, the mode with
 $\lambda _z=L_z$ grew sufficiently to enter highly nonlinear development; presumably in simulations with other
 $L_z/L_x$, this did not happen. Of course, for
 $L_z< L_x/2$, no mode can develop to such large amplitude; but the simulations with
 $L_z=L_x$ and
 $L_z=3L_x/2$ could have developed
 $\lambda _z=L_z/2$ as well as even longer-wavelength modes (and indeed, they did, to some extent – but for some reason the resulting magnetic energy conversion was not as dramatic). We speculate that beyond some wavelength (in sufficiently large systems), long-wavelength RDKI modes will simply not have time to grow before being disrupted by reconnection or faster-growing, shorter-wavelength RDKI modes. We leave it to future work to investigate what determines the nonlinear development of long-wavelength RDKI modes; we expect this to be a difficult task because we have already seen that stochastic variability can play a large role.
In summary, in three dimensions (i.e. for large  $L_z/L_x$), with zero guide field and zero initial perturbation, reconnection and magnetic energy conversion occur more slowly (than in two dimensions) during the first active reconnection stage; for large
 $L_z/L_x$ almost all the released upstream/unreconnected magnetic energy is converted to particle energy (whereas in two dimensions, roughly half of it is trapped in reconnected magnetic field). Whereas 2-D simulations progress to a final state limited by the magnetic field configuration, with magnetic energy and flux trapped in plasmoids, 3-D current sheet evolution does not have a clear endpoint (at least not before
 $50L_x/c$), but enters a long-lasting second stage in which gradual magnetic energy and upstream flux depletion continue at a slower pace. RDKI modes can play a dramatic role in 3-D reconnection – and perhaps it is even misleading to refer to ‘3-D reconnection’ in some cases where RDKI drives the most rapid magnetic energy conversion. The most rapid and largest magnetic energy releases seem to be related to a long-wavelength RDKI mode developing nonlinearly when its amplitude reaches the order of its wavelength, causing extreme distortion of the current layer that quickly depletes magnetic energy within the mode amplitude. Whether this happens at a given wavelength depends on
 $L_z$, but also has a random element, which explains the stochastic variability of 3-D ‘reconnection.’ If nonlinear RDKI does cause dramatic magnetic energy conversion, the resulting layer becomes thick and turbulent, and allows only much slower magnetic conversion thereafter, presumably because of its increased thickness.
Importantly, despite all the complications in three dimensions, with potentially very different mechanisms driving magnetic energy conversion to plasma energy, NTPA efficiency does not suffer in three dimensions and actually appears to be slightly enhanced, although it may occur over somewhat longer times because of the slower reconnection rate. The increase in the number of high-energy particles does depend on the rate of magnetic energy conversion, but for a fixed amount of energy gained by the plasma,  $f(\gamma )$ is remarkably insensitive to
 $L_z$ (as well as to the initial current sheet configuration, as we saw previously). However, in three dimensions, more magnetic energy can be converted to plasma energy than in two dimensions, and ultimately this leads to more particles at the highest (non-thermal) energies.
5.6. Three-dimensional reconnection: guide magnetic field
In this subsection we investigate 3-D reconnection with different initial guide magnetic fields,  $B_{gz}/B_0\in \{$0, 0.1, 0.25, 0.5, 0.75, 1
 $\}$, using system size
 $L_z=L_x=256\sigma \rho _0$. Other parameters are as usual: zero initial perturbation,
 $\eta =5$,
 $\beta _d=0.3$,
 $\delta =(2/3)\sigma \rho _0$. The dependence of 3-D reconnection on the guide magnetic field
 $B_{gz}$ is non-trivial and non-monotonic as a result of competing effects. We find that the effect of guide magnetic field in three dimensions can be roughly summarized thus: stronger
 $B_{gz}$ suppresses 3-D effects, so that reconnection becomes more 2-D-like; this may be expected, because guide field suppresses 3-D instabilities like RDKI (Zenitani & Hoshino Reference Zenitani and Hoshino2008). Stronger guide field promotes particle transport in
 $z$ (relative to perpendicular directions) by aligning
 $\boldsymbol {B}$ increasingly parallel to
 $z$, and this tends to even out variations in
 $z$ (relative to perpendicular directions). Again, however, as with
 $B_{gz}=0$, we find that NTPA continues to be very similar in two dimensions and three dimensions for
 $B_{gz} > 0$.
In two dimensions, the added inertia of the guide field, being dragged along with the plasma, slows reconnection significantly when the guide-field enthalpy density,  $B_{gz}^2/4{\rm \pi}$ becomes comparable to or larger than the upstream plasma enthalpy density,
 $h=4 \theta _b n_b m_e c^2$ (expressed here in the ultrarelativistic limit), i.e. when
 $B_{gz}^2/B_0^2 \gtrsim 1/\sigma _h$ (cf. § 4.4 and Liu et al. Reference Liu, Guo, Daughton, Li and Hesse2015). The guide-field enthalpy appears to slow reconnection in three dimensions as well. However, because other 3-D effects also slow reconnection, the fundamentally 2-D effect of guide-field enthalpy is not noticeable at low guide fields; at low guide field,
 $B_{gz}/B_0 \lesssim 1/\sigma _h$, the guide field actually promotes reconnection by suppressing 3-D effects that slow reconnection.
Figure 36(a) shows the time evolution of transverse magnetic energy  $U_{Bt}(t)$ in three dimensions, for all six guide-field values (2-D results are shown in fainter colours on the same graph, for comparison). For
 $B_{gz}=0$, results from three 3-D simulations are shown to give a rough estimate of stochastic variability, and all three exhibit relatively slow magnetic energy conversion. Increasing
 $B_{gz}$ even to
 $B_{gz}=0.1B_0$ speeds up reconnection (presumably by suppressing 3-D instabilities) and results in significantly more magnetic energy conversion over the first 20–30
 $L_x/c$; by
 $B_{gz}=B_0/4$, this trend saturates as the guide field enthalpy starts to suppress reconnection (this is more noticeable at later times). Somewhere around
 $B_{gz}\gtrsim 0.75B_0$ (and clearly for
 $B_{gz}=B_0$), the guide field is suppressing reconnection as in two dimensions, so that for
 $B_{gz}=B_0$, 3-D reconnection is slower than for
 $B_{gz}=0$ at all times. We should keep in mind, however, that without guide field, stochastic variability can significantly affect system evolution, including energy dissipation (cf. § 5.2), and further work should investigate ensembles of simulations with different guide fields.
Transverse magnetic energy  $U_{Bt}(t)$ in the entire simulation (a) and
 $U_{Bt,{\rm layer}}(t)$, restricted to the layer (b), for both 2-D (fainter, thinner lines) and 3-D (
 $L_z=L_x$, thicker lines) simulations, for a range of guide fields
 $B_{gz}$. Three 3-D simulations are shown for
 $B_{gz}=0$. On the left plot, lines are individually labelled with dimensionality (‘2d’ or ‘3D’) and
 $B_{gz}/B_0$. These simulations have size
 $L_x=256\sigma \rho _0$.

We argue that the enhancement of reconnection by moderate  $B_{gz}$ is a consequence of reconnection becoming more 2-D-like, stabilizing flux ropes and preventing 3-D instabilities from interfering. This is supported by figure 36(b), which shows the magnetic energy in the layer vs time,
 $U_{Bt,{\rm layer}}(t)$. In § 5.5 we showed (for
 $B_{gz}=0$) that for 2-D simulations,
 $U_{Bt,{\rm layer}}(t)$ increases monotonically until it saturates at a significant fraction of the initial transverse magnetic energy,
 $U_{Bt0}$; whereas, as
 $L_z/L_x$ is increased and 3-D effects become important,
 $U_{Bt,{\rm layer}}$ increases only a little before decaying away. Here we see the same thing in three dimensions: for
 $B_{gz}=0.1B_0$,
 $U_{Bt,{\rm layer}}(t)$ grows a little and then decays over time; as
 $B_{gz}$ becomes stronger,
 $U_{Bt,{\rm layer}}(t)$ becomes more 2-D-like, increasing to a larger value and (for
 $B_{gz}/B_0=1$) saturating at a roughly constant value (because the guide field stabilizes flux ropes containing the reconnected field).
The decay of upstream flux  $\psi (t)$ in three dimensions, shown in figure 37(a), is consistent with this picture.
 $B_{gz}=0$ has the slowest reconnection rate (
 $\propto -\textrm {d}\psi /\textrm {d}t$), and, after
 $30L_x/c$, has the most remaining unreconnected flux upstream. Intermediate guide fields yield faster reconnection and more ‘reconnected’ flux, but by
 $B_{gz}/B_0=1$, reconnection is slowed as the guide-field enthalpy becomes significant compared with the relativistic plasma enthalpy (as in two dimensions).
(a) Unreconnected flux  $\psi (t)$ for the same simulations shown in figure 36, with horizontal grey, dotted lines indicating
 $0.9\psi _0$ and
 $0.8\psi _0$. (b) Reconnection rates vs
 $B_{gz}/B_0$ for the simulations in the left panel, averaged over the time for
 $\psi (t)$ to fall from
 $0.9\psi _0$ to
 $0.8\psi _0$ (except, since none of the three 3-D,
 $B_{gz}=0$ cases reached
 $0.8\psi _0$, we show
 $\beta _\textrm {rec}$ for just one of them, averaged between
 $0.9\psi _0$ to
 $0.81\psi _0$). In two dimensions, increasing
 $B_{gz}$ reduces the reconnection rate; in three dimensions, a small guide field increases the reconnection rate, but eventually, strong guide field will reduce the rate. N.B. for 3-D cases, the values of the instantaneous reconnection rate may vary significantly over the averaging time, and stochastic variability may also introduce significant uncertainty.

We now compare  $U_{Bt}(t)$ and
 $\psi (t)$ for these 3-D simulations with otherwise identical 2-D simulations, for all six values of
 $B_{gz}$. Figure 36(a) shows
 $U_{Bt}(t)$. In two dimensions, increasing
 $B_{gz}$ monotonically slows magnetic energy conversion and results in less plasma energization overall. In three dimensions, the initial depletion of
 $U_{Bt}$ is generally slower than in two dimensions, but plasma energization continues for a much longer time. The
 $B_{gz}=0$ simulations reconnect so slowly in three dimensions that even after
 $30L_x/c$ they have converted less magnetic energy than their 2-D counterparts. For
 $0.1 \leq B_{gz}/B_0 \leq 0.5$, early-time conversion rates are slower in three dimensions, but after 20–30
 $L_x/c$, much more magnetic energy is converted in three dimensions than in two dimensions. For
 $B_{gz}/B_0=0.75$, the 2-D and 3-D magnetic energy conversion rates are quite similar at early times, but again the 3-D simulation eventually converts much more of
 $U_{Bt0}$ to
 $U_\textrm {plasma}$. Finally, for
 $B_{gz}/B_0=1$, the initial magnetic energy conversion rate in three dimensions is slower than in two dimensions (which, for reasons we do not yet understand, bucks the trend of becoming more 2-D-like with strong guide field), but the 3-D simulation ends up converting a roughly similar amount of energy as in two dimensions (because, like 2-D simulations, it still stores a significant amount of energy in relatively stable flux ropes – cf. figure 36b).
Figure 37(a) shows  $\psi (t)$, again for two and three dimensions, for all six
 $B_{gz}$ values. As
 $B_{gz}/B_0$ increases to
 $B_{gz}/B_0 \sim 0.75$, 2-D reconnection rates (
 $\propto -\textrm {d}\psi /\textrm {d}t$) decrease, and 3-D rates increase; correspondingly, the total amount of flux reconnected (over 30
 $L_x/c$) decreases in two dimensions and increases in three dimensions, until
 $\psi (t)$ becomes relatively similar in two and three dimensions for
 $B_{gz}/B_0\approx 0.75$. This trend suggests that for
 $B_{gz}/B_0=1$, the 2-D and 3-D cases should be even more similar, but in fact (compared with
 $B_{gz}/B_0=0.75$) reconnection for
 $B_{gz}/B_0=1$ slows dramatically in three dimensions while it slows only a little in two dimensions. We leave a full exploration of this to future work investigating 3-D reconnection with stronger guide fields, but we speculate that 3-D reconnection may not reach the 2-D limit until the purely 2-D suppression (which begins for
 $B_{gz}/B_0 \gtrsim 1/\sigma _h$ and becomes stronger with higher
 $B_{gz}$) completely dominates over the suppression due to 3-D effects. At
 $B_{gz}/B_0=1$, we may be seeing the combined effects of guide-field suppression and 3-D suppression of reconnection, while at some larger
 $B_{gz}$, we expect 3-D effects to become weaker. This is exemplified quantitatively in figure 37(b), where we graph the normalized reconnection rates, averaged over the period during which
 $\psi (t)$ falls from
 $0.9\psi (0)$ to
 $0.8\psi (0)$. The 2-D reconnection rates fall with stronger
 $B_{gz}$, and the rate for
 $B_{gz}/B_0=1$ is roughly half of the maximum rate, which is realized for
 $B_{gz}/B_0 \lesssim 0.25$. The 3-D rate at
 $B_{gz}/B_0=0$ is an order of magnitude below the maximum 2-D rate, but the 3-D rate speeds up for intermediate
 $B_{gz}$ so that at
 $B_{gz}/B_0=0.75$, the 2-D and 3-D rates differ by less than a factor of 2. As
 $B_{gz}/B_0$ increases from 0.75 to 1, the 2-D rate drops smoothly, while the 3-D rate drops more dramatically.
It appears likely that magnetic energy and flux would continue to decrease if we ran the 3-D simulations for longer times. However, we quantify the ‘final’ amounts of remaining magnetic energy and flux after a long time,  $t=30L_x/c$, in table 3 – for both 2-D and 3-D simulations, for all
 $B_{gz}$. In terms of these ‘final’ values, we see that 2-D and 3-D reconnection are most similar for
 $B_{gz}/B_0=1$, with
 $U_{Bt}$ differing by only 3 percentage points, and
 $\psi (t)$ by approximately 8 percentage points. The table also shows that 3-D simulations generally lose less upstream flux but convert more magnetic energy than 2-D simulations, because in two dimensions, energy in plasmoids is stable, whereas in three dimensions it is depleted (unless the guide field is sufficiently strong), as shown in figure 36(b).
The fractional loss in transverse magnetic field energy  $U_{Bt}$ and unreconnected magnetic flux
 $\psi$ over
 $30L_x/c$ of reconnection, for various guide fields, for simulations with
 $L_x=256\sigma \rho _0$, both two-dimensional and
 $L_z=L_x$ (for
 $L_z=L_x$, three simulations are shown with
 $B_{gz}=0$ to give some idea of stochastic variation).

We have seen that both guide field and 3-D effects can suppress reconnection, slowing the overall rates of reconnection and release of magnetic energy. We find that an initial guide field suppresses NTPA – to the same extent in both two and three dimensions – whereas 3-D effects do not suppress NTPA, despite slowing reconnection. Figure 38 shows the electron energy spectra  $f(\gamma )$ (compensated by
 $\gamma ^4$) for each
 $B_{gz}$, both at the same amount of depleted magnetic energy,
 $U_{Bt}=0.83U_{Bt0}$ (a), and at the same time,
 $t=20L_x/c$ (b), for the 3-D simulations as well as for comparable 2-D simulations. Keeping in mind that graphing
 $\gamma ^4 f(\gamma )$ enhances small differences in
 $f(\gamma )$, we consider the 2-D and 3-D spectra (for the same
 $B_{gz}$) to be fairly similar in magnitude ( separated by less than a factor of 2 in either
 $\gamma$ or in
 $f(\gamma )$), especially at
 $U_{Bt}(t)=0.83U_{Bt0}$. As the guide field increases, the spectra in two and three dimensions become even closer, until for
 $B_{gz}=B_0$ they are nearly identical. We cannot make a general statement about whether NTPA is more efficient in two or three dimensions without going into much more detail regarding the exact times and energies at which spectra are compared. However, it does appear that, because 3-D simulations can convert more magnetic energy to plasma energy, over long times 3-D simulations accelerate more particles.
Particle energy spectra compensated by  $\gamma ^4$ at a time (a) when
 $U_{Bt}=0.83U_{Bt0}$ (i.e. 17 per cent of magnetic energy has been converted to plasma energy), and (b) at
 $t=20L_x/c$, for a range of guide fields
 $B_{gz}$, for 3-D simulations with
 $L_z=L_x$ (thicker, darker lines) and, for comparison, for two dimensions(thinner, fainter). Dotted grey-on-yellow lines show the slopes of
 $f(\gamma )\propto \gamma ^{-p}$ for
 $p=5$, 5.6 and 6.5 (
 $p=4$ would be horizontal). These simulations are the same as shown in figures 36 and 37. The 2-D simulation with
 $B_{gz}=B_0$ did not reach
 $U_{Bt}=0.83U_{Bt0}$, but remained around
 $U_{Bt}=0.85U_{Bt0}$ from
 $t=7L_x/c$ to
 $t=30L_x/c$.

Dahlin et al. (Reference Dahlin, Drake and Swisdak2017) observed enhancement of NTPA in three dimensions, relative to two dimensions, in subrelativistic electron-ion reconnection at  $B_{gz}=0$, and the 3-D enhancement became stronger with increasing guide field, until this effect saturated around
 $B_{gz}/B_0 \simeq 1$ (Li et al. (Reference Li, Guo, Li, Stanier and Kilian2019) also observed enhancement in three dimensions for
 $B_{gz}/B_0=0.2$). As we discussed in § 5.5, our results are not inconsistent with these, but the differences between 2-D and 3-D spectra do not seem very significant if compared at times with the same amount of magnetic energy depletion; however, because more magnetic energy can be converted to plasma energy in three dimensions, 3-D simulation can accelerate more particles to high energies. However, as the guide field becomes stronger, we expect 3-D simulations to become essentially identical to 2-D simulations, and then we expect NTPA to be identical as well.
We have not yet investigated the strong guide-field regime,  $B_{gz}/B_0\gg 1$, because of the high computational cost associated with larger
 $L_z/L_x$ and longer simulation times; it will be important in future work to explore this regime and in particular to confirm or deny conclusively that reconnection with very strong guide field rigorously approaches the ideal 2-D limit with perfect uniformity in
 $z$.
6. Comparison with large magnetization
In this paper we have found that, for  $\sigma _h=1$, 3-D reconnection is significantly slower than 2-D reconnection, and lasts for much longer times over which it eventually converts more magnetic energy to plasma energy (but that NTPA is quite similar in two and three dimensions). However, relativistic reconnection with large magnetization,
 $\sigma _h\gg 1$, has been found to convert similar amounts of magnetic energy to plasma energy at similar rates in two and three dimensions (Guo et al. Reference Guo, Li, Daughton and Liu2014, Reference Guo, Liu, Daughton and Li2015; Werner & Uzdensky Reference Werner and Uzdensky2017; Guo et al. Reference Guo, Li, Daughton, Li, Kilian, Liu, Zhang and Zhang2020; Zhang et al. Reference Zhang, Sironi and Giannios2021).Footnote 1 It thus may appear that 3-D effects play less of a role for large-
 $\sigma _h$ reconnection. However, as we will discuss in the following, there is a possibility that the 2-D-like behaviour for 3-D reconnection might be a result of the initial simulation configuration, and not an inevitable, intrinsic consequence of larger
 $\sigma _h$.
The recent work by Guo et al. (Reference Guo, Li, Daughton, Li, Kilian, Liu, Zhang and Zhang2020) should be considered when comparing large and small  $\sigma _h$, since it studied 3-D relativistic pair reconnection with
 $\sigma _h$ ranging from around 1 to 200 (although starting from a transrelativistic temperature
 $\theta _b \sim 1$). There, high reconnection rates and magnetic energy conversion rates (similar to rates in two dimensions) were observed for the entire range of
 $\sigma _h$. However, that study focused on very early times; those rates were measured within the first
 $1\,L_x/c$. Moreover, those simulations began with an initial field perturbation, uniform in the third dimension, and used a force-free configuration – i.e. an initial magnetic field with a substantial
 $B_z$ component localized to the layer. We have shown that differences in magnetic energy conversion rates between two and three dimensions are suppressed by an initial perturbation (§ 5.3) and by an initially globally uniform guide field
 $B_{gz}$ (§ 5.6), particularly at early times. Therefore, Guo et al. (Reference Guo, Li, Daughton, Li, Kilian, Liu, Zhang and Zhang2020) does not address our particular question about whether lower energy conversion rates might be observed in three dimensions if simulations ran for long times, especially starting with no initial perturbation and no guide field.
The very recent work by Zhang et al. (Reference Zhang, Sironi and Giannios2021) studied reconnection in 3-D pair plasma with  $\sigma _h=10$ (and
 $B_{gz}/B_0=0.1$). They observed slightly slower reconnection in three dimensions (compared with two dimensions), but not substantially slower. This adds to the evidence suggesting that for larger
 $\sigma _h$, 3-D reconnection is more similar to 2-D reconnection. However, their use of an initial perturbation and outflow boundary conditions led to an X-line running down the centre of the box the entire length in
 $z$, which could conceivably be the dominant driver of 2-D-like reconnection (i.e. and not the larger
 $\sigma _h$). The guide field, though weak, might also favour 2-D-like reconnection, but the paper states that simulations with
 $B_{gz}=0$ did not differ significantly. Thus we cannot confidently attribute the 2-D-like speed of 3-D reconnection purely to the difference in
 $\sigma _h$. Zhang et al. (Reference Zhang, Sironi and Giannios2021) also found NTPA to be very similar in two and three dimensions – except that, similar to the earlier finding in subrelativistic electron–ion reconnection (Dahlin et al. Reference Dahlin, Drake and Swisdak2017), the highest-energy particles in three dimensions were accelerated to higher energies (than in two dimensions) because they escaped from flux ropes (with finite extent in
 $z$) and thus experienced additional acceleration in the reconnection electric field. Although a full comparison of this acceleration behaviour is beyond the scope of our work, preliminary analysis suggests that our
 $\sigma _h=1$ simulations show similar behaviour of high-energy particles experiencing (in three dimensions) additional direct electric-field acceleration.
Our own simulations of large- $\sigma _h$ relativistic reconnection in 3-D pair plasma from a previous work (Werner & Uzdensky Reference Werner and Uzdensky2017), with
 $\sigma _h=25$, also started with a magnetic field perturbation (
 $a=2.7$,
 $s/\delta =1.9$), but used a Harris-sheet set-up (as in this paper) and ran for approximately
 $5L_x/c$. We also ran some simulations without perturbation, but mentioned them only in passing. One of those simulations – three-dimensional (
 $L_z=L_x$), without guide field (
 $B_{gz}=0$) and without initial perturbation (
 $a=0$) – did show exceptionally slow reconnection (perhaps like our
 $\sigma _h=1$ simulations in this paper) and much-suppressed NTPA (unlike our
 $\sigma _h=1$ simulations). At the time we attributed the slow reconnection to the influence of the initial current sheet; i.e. we believed this effect would have disappeared if we could have run simulations with larger
 $L_x/\delta$. In light of our
 $\sigma _h=1$ results presented above, we revisit these
 $\sigma _h=25$ simulations.
Although the larger  $\sigma _h$ is the most fundamental physical difference between the
 $\sigma _h=1$ simulations in this paper and those in Werner & Uzdensky (Reference Werner and Uzdensky2017) with
 $\sigma _h=25$, practical considerations necessitated other differences. Large
 $\sigma _h$ required higher grid resolution (
 $\Delta x = \sigma \rho _0/12$, to resolve the Debye length of the colder upstream plasma), so the
 $\sigma _h=25$ simulations were significantly smaller, with
 $L_x=80\sigma \rho _0 = 120\delta$; whereas, our
 $\sigma _h=1$ simulations with
 $\Delta x=\sigma \rho _0/3$ are 4–6 times larger, with some parameter scans using
 $L_x=341 \sigma \rho _0=512\delta$ (e.g. § 5.5) and the largest 3-D simulation reaching
 $L_x=512\sigma \rho _0=768\delta$ (cf. § 5.1). Because the same overdensity
 $\eta =5$ was used in the large-
 $\sigma _h$ regime, the
 $\sigma _h=25$ simulations required a much hotter initial current sheet,
 $\theta _d=10.5\theta _b$, to balance the relatively strong upstream magnetic pressure; whereas for
 $\sigma _h=1$, the initial current sheet is cooler than the upstream plasma,
 $\theta _d=0.4\theta _b$. The initial current sheet for
 $\sigma _h=25$ thus had, at its peak density, approximately 50 times the energy and inertia density of the upstream plasma; for
 $\sigma _h=1$, this ratio is only 2. It is therefore reasonable to expect the initial current sheet to exert greater influence for
 $\sigma _h=25$ than for
 $\sigma _h=1$, especially considering that
 $L_x/\delta$ was several times smaller for
 $\sigma _h=25$.
The relatively high enthalpy of the initial current sheet plasma for  $\sigma _h=25$, relative to the background plasma, may play a critical role in slowing down reconnection in three dimensions (with
 $a=0$ and
 $B_{gz}=0$). Here is what we believe may be happening in that case. When reconnection starts, the initial current sheet plasma is not trapped and swept away from reconnecting X-points, which ultimately control the reconnection rate (Uzdensky, Loureiro & Schekochihin Reference Uzdensky, Loureiro and Schekochihin2010), but rather is dispersed widely in the vicinity of the layer. Some of that hot, dense plasma recirculates into X-point inflows, where its high inertia – 50 times higher than the background plasma's inertia – significantly lowers the Alfvén velocity and slows reconnection. Either an initial perturbation, or a weak guide field, or 2-D-ness will facilitate the trapping of the initial current sheet plasma in plasmoids, sweeping it away from X-points and preventing this scenario. Specifically, the 2-D/3-D difference disappeared either with a perturbation of
 $a=2.7$ or with a guide field of
 $B_{gz}\geq B_0/4$ – where, importantly,
 $B_{gz}=B_0/4$ was strong enough to suppress 2-D/3-D differences but weak enough that it did not substantially affect reconnection rates or NTPA in either two or in three dimensions.
We now review the evidence that the 3-D simulation with  $B_{gz}=0$ and
 $a=0$ was an outlier with slow reconnection and limited NTPA. When we compare the transverse magnetic energy vs time,
 $U_{Bt}(t)$, for eight configurations with
 $\sigma _h=25$ – all combinations of (i) dimensionality: two and three dimensions(
 $L_z=L_x$), (ii) guide field:
 $B_{gz}=0$ and
 $B_{gz}=B_0/4$, (iii) perturbation:
 $a=2.7$ and
 $a=0$ – we see three rough groups of similar
 $U_{Bt}(t)$ (figure 39a). First, there is a group of all four simulations with
 $B_{gz}=B_0/4$, which have similar
 $U_{Bt}(t)$, regardless of dimensionality or perturbation. Second, there is a group of all simulations with
 $B_{gz}=0$ – except for the outlier (i.e. 3-D,
 $a=0$). Comparing these two groups, we see, as expected, that the small guide field slows/suppresses reconnection by a modest amount. Within each group, we see that the 3-D simulations can ultimately convert a bit more magnetic energy to plasma energy than the 2-D simulations (cf. § 5.5), but this effect is not very significant, at least in the first
 $5L_x/c$. The third group contains just the single outlier – three dimensions,
 $B_{gz}=0$,
 $a=0$ – with much slower plasma energization.
Magnetic energy vs time (a) in  $B_x$ and
 $B_y$ components, and (b) in
 $B_y$ components only (as a proxy for
 $U_{Bt,{\rm layer}}$), for eight different configurations of
 $\sigma _h=25$ simulations from Werner & Uzdensky (Reference Werner and Uzdensky2017). Shown are all combinations of two dimensions (thin, red/yellow lines) or three dimensions(thicker, blue-ish),
 $B_{gz}/B_0=0$ (no symbols) or
 $1/4$ (‘
 $B_g$’, symbols), without initial perturbation (solid lines) or with a perturbation such that the separatrix initially extends to
 $s=1.8\delta$ (‘pert’, dashed lines). Results for three different 2-D simulations with
 $B_{gz}=0$ and no perturbation are shown. A dashed grey line marks the energy at which spectra are shown in figure 40.

Interestingly, this grouping falls apart when we look at  $U_{By}(t)$, the energy in magnetic field components
 $B_y$ (figure 39b). Here,
 $U_{By}$ is a proxy for the magnetic energy
 $U_{Bt,{\rm layer}}$ in the layer, and we have seen (for
 $\sigma _h=1$, e.g. § 5.5) that 2-D reconnection stores magnetic energy in plasmoids, whereas plasmoids tend to decay in three dimensions. Here, there is a distinct difference between two and three dimensions, although the 3-D case with
 $B_{gz}=0$ and
 $a=0$ is still an outlier with the lowest overall
 $U_{By}$. Both guide field and initial perturbation make 3-D simulations behave more – but not entirely – like 2-D simulations, something that we have seen for
 $\sigma _h=1$ (cf. §§ 5.3 and 5.6). This suggests, even for
 $\sigma _h=25$, 3-D simulations may be more different from 2-D simulations than previously suspected. However, it is important to remember that 2-D and 3-D simulations with
 $\sigma _h=25$ have rather similar total magnetic energy evolution (unlike with
 $\sigma _h=1$), apart from the one outlier case.
Looking at NTPA for these same simulations, we again see that the 3-D case with  $B_{gz}=0$,
 $a=0$ is a clear outlier. Particle energy spectra are shown in figure 40 – at times when 15 per cent of the initial magnetic energy has been depleted, i.e.
 $U_{Bt}(t)=0.85U_{B0}$ (a), and also at
 $t\approx 4L_x/c$ (b). All the simulations, except the outlier, have similar energy spectra, especially for
 $U_{Bt}(t)=0.85 U_{B0}$. (When compared at the same,
 $t=4L_x/c$, one sees that, since even a weak guide field slows reconnection a little, NTPA for
 $B_{gz}=B_0/4$ has not quite caught up to NTPA for
 $B_{gz}=0$.)


We further observe that that this outlier – in reconnection rate and NTPA, as shown above – is also an outlier in the behaviour of the initially drifting plasma (i.e. the initial current sheet plasma). In all simulations but the outlier – e.g. 2-D or  $B_{gz} > 0$ or
 $a>0$ – the initially drifting particles are rapidly swept away from X-points and trapped within plasmoids (see our discussion of plasmoid formation with and without perturbation in § 4.2, and also Ball et al. Reference Ball, Sironi and Özel2018). This can be clearly seen in figure 41, which shows
 $n_{de}(x,y_c,z)$, the density of initially drifting electrons, as well as the density
 $n_{be}(x,y_c,z)$ of background electrons, in the original midplane,
 $y=y_c$. With
 $a=2.7$ (
 $s=1.8\delta$, top row) or with
 $B_{gz}=B_0/4$ (middle row), it takes only a short time to evacuate most of the initially drifting plasma from large areas (e.g. large areas with
 $n_{de}<0.2n_{be0}$ are outlined –
 $0.2n_{be0}$ is a very small density compared with the initial peak density
 $n_{de}=5n_{be0}$). However, with no perturbation and no guide field (bottom row), the initially drifting particles remain scattered roughly uniformly about the layer, while spreading in
 $y$, including in the vicinity of X-points. With 50 times the enthalpy density of the background plasma, the initially drifting plasma can thus significantly load the inflows upstream of X-points, in this case lowering the effective
 $\sigma _h$ and hence Alfvén velocity, and thereby slowing reconnection.
In 3-D simulations with  $\sigma _h=25$, either an initial perturbation or a guide field can cause the drift particles to be trapped and cleared out of large areas, as shown by the density
 $n_{de}$ of initially drifting electrons in the original reconnection midplane (a,c,e), roughly
 $0.4L_x/c$ after reconnection onset when the magnetic energy has declined by approximately 10 per cent, for: (a,b)
 $B_{gz}=0$ and perturbation,
 $a=2.7$ or
 $s/\delta =1.8$; (c,d)
 $B_{gz}=B_0/4$ and zero perturbation; (e,f) the outlier case with
 $B_{gz}=0$ and zero perturbation. Panels (b,d,f) show the density
 $n_{be}$ of background electrons for reference. Green contours outline areas where
 $n_{de} < 0.2 n_{be0}$. The time
 $t'$ since onset and the fraction of remaining magnetic energy are noted on the right-hand side.

Let us quickly review. In ( $\sigma _h=25$) simulations that have
 $B_{gz}>0$ or have
 $a>0$ or are two-dimensional,
(a) the initial current sheet plasma is quickly swept away from the vicinity of X-points,
(b) so that the plasma near X-points flows in from the upstream plasma with
$\sigma _h \gg 1$,(c) and fast reconnection and NTPA ensue as in 2-D simulations.

In the (outlier) 3-D simulation with  $B_{gz}=0$ and
 $a=0$,
(a) the initial current sheet plasma is dispersed about the layer and can flow back into X-points,
(b) reducing the
$\sigma _{h,X}$ of the plasma immediately upstream of X-points (since, for large $\sigma _h$, the initial current sheet plasma has much higher enthalpy and inertia than the upstream plasma),(c) and reconnection is slow and NTPA is substantially diminished.


When the initial current sheet plasma can flow back into X-points, we estimate the hot magnetization  $\sigma _{h,X}$, which controls reconnection rate and NTPA, as follows. From pressure balance, the pressure of the initial current sheet plasma is
 $p_d\equiv n_{d0}\theta _d m_e c^2/\gamma _d = B_0^2/8{\rm \pi}$; since the enthalpy density is
 $h\sim 4 p_d$,
 $\sigma _{h,d} \equiv B_0^2/(4{\rm \pi} h) \sim O(1)$. Even if the upstream has
 $\sigma _h \gg 1$,
 $\sigma _{h,X}\sim [\sigma _{h}^{-1} + \sigma _{h,d}^{-1}]^{-1}$ may be
 $O(1)$, roughly independent of the upstream
 $\sigma _h$.
Lowering  $\sigma _h$ is known both to slow reconnection and to suppress NTPA (Sironi & Spitkovsky Reference Sironi and Spitkovsky2014; Guo et al. Reference Guo, Liu, Daughton and Li2015; Werner et al. Reference Werner, Uzdensky, Cerutti, Nalewajko and Begelman2016; Werner & Uzdensky Reference Werner and Uzdensky2017; Werner et al. Reference Werner, Uzdensky, Begelman, Cerutti and Nalewajko2018; Guo et al. Reference Guo, Li, Daughton, Li, Kilian, Liu, Zhang and Zhang2020). In contrast, our 3-D simulations with (asymptotic upstream)
 $\sigma _h=1$, in which the initial current sheet plasma had only twice the enthalpy density of the background plasma, showed slow reconnection but no reduction in NTPA (compared with two dimensions; cf. § 5.5). This suggests that the suppression of reconnection (and NTPA) in the outlier
 $\sigma _h=25$ simulation may not be caused directly by 3-D effects (as manifested for
 $\sigma _h=1$), but rather may be a consequence of the initial current sheet plasma behaviour, enabled indirectly by 3-D effects (as long as
 $B_{gz}=0$ and
 $a=0$).
This raises the important question: in a much larger simulation, or in a simulation with open outflow boundary conditions, would the initial current sheet plasma continue to load the upstream plasma at X-points for arbitrarily long times? That is, is this an artificial effect of the initial and boundary conditions of an idealized simulation that might not be important in realistic astrophysical systems, or is it an inevitable consequence of 3-D reconnection in some regimes? In a much larger simulation, or if particles could escape the simulation, the loading of the upstream plasma (by hot, dense plasma from the initial current sheet) might conceivably be a brief, transient phenomenon. Eventually, the initially drifting particles might escape or be trapped or become so diluted by background plasma that they cannot effectively continue to increase the plasma inertia at X-points. Indeed, it was this reasoning that led us to present only results from simulations with  $a>0$ in Werner & Uzdensky (Reference Werner and Uzdensky2017); the perturbation appeared to minimize the influence of the initial current sheet, allowing us to access the large-system regime,
 $L_x\gg \delta$, with computationally feasible simulations.Footnote 2 On the other hand, the upstream plasma is heated and compressed as it flows through a reconnecting X-point, and – if that plasma can recirculate back into the X-point inflows – that could provide long-term suppression or self-regulation of reconnection. Unfortunately we cannot conclusively answer this question with our previously run
 $\sigma _h=25$ simulations and must leave it to future research.
Even if upstream loading by the initial current sheet plasma explains the suppressed reconnection and NTPA in three dimensions, and even if this effect vanishes for larger systems, this second look at  $\sigma _h=25$ simulations suggests that we may still need to investigate whether and how 3-D reconnection differs from 2-D reconnection for much larger systems with
 $\sigma _h\gg 1$. Figure 39 shows that, despite similar
 $U_{Bt}(t)$ and NTPA in two and three dimensions (for
 $L_x=80\sigma \rho _0$), 3-D reconnection with
 $\sigma _h=25$ nevertheless exhibits one very clear signature of fundamentally 3-D effects – namely that magnetic energy stored in plasmoids (flux ropes) decays in three dimensions, but not in two dimensions. This could significantly affect the long-term evolution of a reconnection current sheet; for example, if plasmoids disintegrate in three dimensions (even for
 $\sigma _h\gg 1$), that might potentially kill the acceleration mechanism (due to conservation of magnetic moment in a compressing plasmoid) for particles trapped in plasmoids (Petropoulou & Sironi Reference Petropoulou and Sironi2018; Hakobyan et al. Reference Hakobyan, Petropoulou, Spitkovsky and Sironi2021).
In summary, a definitive answer to the question of whether 3-D reconnection with  $\sigma _h\gg 1$ and weak or zero guide field can be slow compared with 2-D reconnection (as is the case for reconnection with
 $\sigma _h=1$) will require more investigation. We can at least say that
 $\sigma _h\gg 1$ reconnection shows some distinctive 3-D effects, most notably the decay of flux-rope structures, resulting in more magnetic energy release in three dimensions than in two dimensions. However, in some regimes with
 $\sigma _h \gg 1$, simulations have nevertheless shown substantial similarities between 2-D and 3-D reconnection in terms of magnetic energy evolution and NTPA. It is possible that, in sufficiently large systems (larger than has been explored to date),
 $\sigma _h\gg 1$ reconnection is inevitably slow in three dimensions (compared with two dimensions), just as for
 $\sigma _h=1$. Alternatively, it is possible that the slowing of reconnection and the less efficient NTPA for
 $\sigma _h=25$ (with zero guide field and no perturbation) is the result of a transient influence of the initial current sheet and that in more realistic astrophysical systems (at long times after transients effects have died away) 3-D reconnection would eventually and inevitably resemble 2-D reconnection.
7. Summary
Before a final discussion of the significance and some impacts of this study, we briefly summarize the most important results for magnetic reconnection in 2-D and 3-D ultrarelativistically hot collisionless pair plasma with  $\sigma _h=1$ (i.e.
 $\beta _\textrm {plasma}=1/2$). We remind the reader that we define
 $\sigma _h\equiv B_0^2/(16{\rm \pi} n_b \theta _b m_e c^2)$ with respect to the upstream (ambient) plasma, excluding any guide magnetic field (here,
 $\theta _b m_e c^2$ is the temperature, and
 $\theta _b\gg 1$). Thus the magnetic energy and thermal energy are comparable, and both greatly exceed the plasma rest-mass energy. The results are organized in three subsections: (7.1) major qualitative differences between two and three dimensions, (7.2) 2-D-specific results, and (7.3) 3-D-specific results.
7.1. Qualitative similarities and differences in two and three dimensions
Our observations of general, qualitative aspects of current sheet evolution for (upstream)  $\sigma _h=1$ are summarized below, emphasizing similarities and differences in two and three dimensions. (We describe 2-D behaviour here primarily to facilitate comparison with three dimensions; the qualitative 2-D behaviour is familiar from previous works studying this and
 $\sigma _h\gg 1$ regimes.)
(a) In two and three dimensions, the initial current sheet breaks up into smaller current sheets because of the tearing instability and starts reconnecting. Small plasmoids – structures of higher plasma density contained by magnetic field (possibly magnetic islands or flux ropes) – grow, fed by reconnection outflows from elementary reconnecting current sheets. (§§ 4.1 and 5.1).
(b) In three dimensions, the current sheet ripples due to RDKI – but this can be suppressed by guide magnetic field. (§§ 5.1 and 5.6).
(c) In two and three dimensions, reconnection pumps plasma and magnetic energy from the upstream region through X-points (or X-lines) into plasmoids; in the process, some upstream magnetic energy is converted to plasma energy and some remains in magnetic form in plasmoids. (§§ 4.1 and 5.1).
(d) In two dimensions, plasmoids (magnetic islands) are distinct structural units; they have closed (eventually circular), reconnected magnetic field lines that permanently trap plasma and magnetic energy from reconnection outflows. They are essentially stable in two dimensions and can move about along the layer. Two colliding plasmoids will merge into one (while mostly conserving the trapped flux and energy). As reconnection continues (in a closed system), a single large plasmoid eventually engulfs (i.e. merges with) all other plasmoids, growing (and never shrinking) as long as reconnection continues. (§§ 4.1 and 5.1).
(e) In three dimensions, plasmoids (flux ropes) can decay, not only losing their individual integrity but also converting their magnetic energy to plasma energy. Importantly, this means that upstream magnetic energy is more completely converted to plasma energy in three dimensions (because 2-D reconnection hoards some magnetic energy in plasmoids). Strong guide field inhibits flux-rope disintegration. (§ 5.1, 5.5)
(f) An indication of plasmoid decay – and the clearest signature of novel 3-D behaviour that we have observed – is the magnetic energy
$U_{Bt,{\rm layer}}$ in the plasmoid-containing current layer (defined in § 3.1). In two dimensions, $U_{Bt,{\rm layer}}$ rises until reconnection ceases; in three dimensions, it rises at the onset of reconnection, but then declines as plasmoids decay faster than reconnection can inflate them. $U_{Bt,{\rm layer}}$ is more sensitive to 3-D effects than other measures, and it also exhibits less stochastic variation from simulation to simulation and more closely correlates with $L_z/L_x$ (figure 31). As a rough indicator of 3-D effects, the (much easier to calculate) magnetic energy in $B_y$ components can be substituted for $U_{Bt,{\rm layer}}$. (§ 5.1, 5.5)(g) In 2-D reconnection, flux is conserved in a precise sense: the total upstream flux plus the flux around the largest plasmoid is almost constant, equal to the initial upstream flux. In 3-D reconnection, flux may be outright annihilated. The small amount of magnetic energy
$U_{Bt,{\rm layer}}$ left in the layer in three dimensions shows that upstream flux is eventually, if not directly, annihilated. It is unclear how much upstream flux is annihilated directly without undergoing any sort of reconnection, and how much first undergoes reconnection to be annihilated later as plasmoids decay. The resemblance between 3-D simulations and 2-D simulations in both the $x$–$z$ and $y$–$z$ planes suggests that both these processes occur in three dimensions, but the precise extents cannot be estimated without additional diagnostics. (§§ 3.3, 5.1, 5.4, 5.5)(h) We speculate that, in three dimensions, for weak guide field, small plasmoids may decay faster than large, long plasmoids, and that the decay of plasmoids may disrupt reconnection in nearby X-lines in thin current sheets. Thus, if something (such as guide magnetic field) can cause reconnection to build up plasmoids faster than they decay, that may prevent interference with X-points, maintaining reconnection in a more 2-D-like fashion.
(i) Whereas 2-D reconnection yields a highly structured plasmoid hierarchy, in which large (system-size-scale), highly magnetized plasmoids do not obliterate nearby thin (kinetic-scale) elementary current sheets, 3-D reconnection tends to develop a thick, turbulent layer, throughout which the magnetic field is greatly diminished. (§§ 4.1, and 5.1)
(j) In three dimensions, with weak guide field, the depletion of upstream magnetic energy and flux may start rapidly (as in two dimensions, or perhaps a little more slowly), but then continue at an order-of-magnitude slower rate for an order-of-magnitude longer time than in two dimensions. This may be due to the thickened layer, and/or to reconnection occurring only in sparse, small areas of the layer. Alternatively, true reconnection may operate to a lesser extent in three dimensions, with other, slower mechanisms (perhaps turbulent diffusion) depleting magnetic field. (§§ 5.3 and 5.5)
(k) In two dimensions, the current sheet evolution from initial to final state (in a closed system) is in a broad sense inevitable, despite stochastic plasmoid behaviour. In three dimensions, however, stochastic variability in the early current sheet evolution can lead to substantially different states at much later times (e.g. different layer thicknesses with different amounts of magnetic energy converted to plasma energy and different continuing rates of energy conversion). (§§ 5.2 and 5.4)
(l) Two-dimensional reconnection (in a closed system) ceases when the major plasmoid becomes large (of the order of the system size) and a stable magnetic configuration is realized. In three dimensions, we have not observed the cessation of magnetic energy depletion, even after 30–50 light-crossing times; the final 3-D state may depend strongly on the early evolution. (§§ 4.1, 4.3, 5.5)
(m) In three dimensions, increasing the initial guide magnetic field suppresses 3-D effects, and 3-D reconnection becomes increasingly similar to 2-D reconnection. (§ 5.6)
(n) In two dimensions, guide magnetic field suppresses both reconnection and NTPA. This is also true in three dimensions; however, because guide field also suppresses 3-D effects (which suppress reconnection), increasing the guide field enhances reconnection up to a point where 3-D effects are effectively suppressed; beyond that point, stronger guide field has the same suppression effect as in two dimensions. (§§ 4.4 and 5.6)
(o) Despite differences in 2-D and 3-D current sheet evolution, NTPA is robust and remarkably similar in two and three dimensions as well as in initially similar 3-D simulations with manifestly different current sheet evolution. This is the case regardless of guide field. (§§ 5.5 and 5.6)
(p) Moreover, NTPA is robust in a way that depends on the upstream
$\sigma _h=1$ and $B_{gz}/B_0$; particle energy spectra are steeper than those in simulations with larger $\sigma _h$, and stronger guide field results in steeper power-law particle spectra. (§ 6)


7.2. Current sheet evolution in two dimensions
Besides providing a baseline against which to compare the 3-D simulations, our 2-D simulations constitute the first systematic study across a broad swath of the multidimensional parameter space describing 2-D,  $\sigma _h=1$ (ultrarelativistic pair-plasma) reconnection, which is of interest in its own right. Here we summarize the most important 2-D results.
(a) Current sheet evolution depends significantly on the ambient
$\sigma _h$ and guide field strength $B_{gz}/B_0$ (§§ 4.4 and 6).(b) The evolution of magnetic and plasma energy, and resulting NTPA, is relatively (but not completely) insensitive to the initial current sheet configuration, including the initial magnetic field perturbation, the density, temperature and thickness of the initial current sheet, and the drift speed of the current sheet plasma. Thus reconnection is governed mostly by the ambient background plasma as described below (§ 4.2).
(c) For zero guide field (and, importantly,
$\sigma _h=1$), reconnection rates (normalized to $B_0c$) are typically around $\beta _\textrm {rec}\approx 0.02$–$0.03$, or (normalized to $B_0v_A$), $(c/v_A)\beta _\textrm {rec}\approx 0.03$–$0.04$, the same order of magnitude but still significantly less than the often-assumed value of 0.1 (Cassak et al. Reference Cassak, Liu and Shay2017) (values of $(c/v_A)\beta _\textrm {rec}\approx 0.1$ are actually realized in 2-D reconnection in relativistic pair plasma with $\sigma _h \gg 1$ (e.g. Sironi & Spitkovsky Reference Sironi and Spitkovsky2014; Guo et al. Reference Guo, Liu, Daughton and Li2015; Werner et al. Reference Werner, Uzdensky, Begelman, Cerutti and Nalewajko2018; Sironi & Beloborodov Reference Sironi and Beloborodov2020)) (§ 4.3).(d) The magnetic energy evolution in systems with
$L_x \gtrsim 160\sigma \rho _0$ already appears to depend only very weakly on system size $L_x$ (for $B_{gz}=0$, up to $L_x=2560\sigma \rho _0$), although larger simulations experience slightly slower reconnection rates than smaller simulations (§ 4.3).(e) For
$B_{gz}=0$ (and, importantly, $\sigma _h=1$), we observe NTPA (for $\sigma _h=1$) with a steep power-law slope of roughly $f(\gamma )\sim \gamma ^{-4}$. (§ 4.3)(f) NTPA also has a fairly weak dependence on
$L_x$ for $L_x\gtrsim 160\sigma \rho _0$; although precise measurement of steep power laws is difficult, our results (for $B_{gz}=0$) suggest that the power-law index varies within only approximately 10 per cent for $80 \lesssim L_x/\sigma \rho _0 \lesssim 2560$. The maximum particle energy (or the high-energy cutoff of the particle power-law energy spectrum) clearly increases sublinearly with $L_x$, from around $7\sigma$ for $L_x=80\sigma \rho _0$ to perhaps $33\sigma$ for $L_x=2560\sigma \rho _0$. That is, for a 32X increase in system size, the particle cutoff energy increases by $\sim$5X, consistent with a $\sim \sqrt {L_x}$ scaling (cf. Petropoulou & Sironi Reference Petropoulou and Sironi2018; Hakobyan et al. Reference Hakobyan, Petropoulou, Spitkovsky and Sironi2021) (§ 4.3).(g) Guide magnetic field slows reconnection. Increasing the guide field from zero to
$B_{gz}=4B_0$ reduces the reconnection rate (normalized to $B_0c$; cf. § 3.3) from $\beta _\textrm {rec}\approx 0.03$ to $0.007$. This is roughly (within 30 per cent) consistent with $\beta _\textrm {rec} \approx 0.04 v_{A,x}/c$ where $v_{A,x}^2/c^2=\sigma _{h,{\rm eff}}/(1+\sigma _{h,{\rm eff}})$ and $\sigma _{h,{\rm eff}}\equiv (1/\sigma _h + B_{gz}^2/B_0^2)^{-1}$ (§ 4.4).(h) Guide magnetic field inhibits NTPA, yielding steeper power-law spectra. The power-law index steepens from
$\sim \gamma ^{-4}$ at $B_{gz}=0$ to $\sim \gamma ^{-6}$ at $B_{gz}=B_0$, and it continues to be steeper for higher $B_{gz}$. Keeping in mind the difficulty of measuring steep power laws, we find that the power-law index is roughly $p\approx 4.4 + 2B_{gz}/B_0$; this should be taken as a rough guide and not confirmation of a linear dependence on $B_{gz}$. For $B_{gz}/B_0 \gtrsim 1.5$, we measure $p\gtrsim 8$ and it is debatable whether the spectra are significantly non-thermal (§ 4.4).


7.3. Current sheet evolution in three dimensions
Our most important results for 3-D simulations with  $\sigma _h=1$ (with system sizes in the range
 $256 \leq L_x/\sigma \rho _0\leq 512$):
(a) Three-dimensional effects can be introduced gradually by increasing the length
$L_z$ of the system in the third dimension. We find that, for $B_{gz}=0$ and the range of system sizes considered, simulations with $L_z\gtrsim L_x/8$ can exhibit fairly obvious departures from 2-D reconnection, while those with $L_z\lesssim L_x/16$ almost always closely resemble two dimensions (§ 5.1, 5.5).(b) As
$L_z/L_x$ is increased, 3-D effects first appear in the time evolution of the magnetic energy in the layer, $U_{Bt,{\rm layer}}(t)$. (The rest of this point applies to $B_{gz}=0$ and $a=0$.) In two dimensions or very small $L_z/L_x \ll 1/32$, $U_{Bt,{\rm layer}}(t)$ increases as long as reconnection continues (up to around 25 per cent of $U_{B0}$), and does not decrease. In three dimensions, $U_{Bt,{\rm layer}}(t)$ increases at very early times, but then starts to decrease because plasmoids can disintegrate in three dimensions. Even when $L_z/L_x$ is small enough to avoid other departures from 2-D reconnection, $U_{Bt,{\rm layer}}$ may be significantly less than in two dimensions. The larger $L_z/L_x$ is, the smaller $U_{Bt,{\rm layer}}(t)$ is (at any given $t$), up to around $L_z/L_x\lesssim 1$. For $L_z/L_x \gtrsim 1$, $U_{Bt,{\rm layer}}$ may rise to just a couple per cent of $U_{B0}$ before falling to lower values (§§ 5.1 and 5.5).(c) Random variability is substantially greater in three dimensions than in two dimensions; identical simulations, aside from different random particle initialization, can yield very different behaviour (e.g. in terms of magnetic energy vs time) and very different states even after long times. This contrasts strongly with the variability in two dimensions, where similarly identical simulations will still yield the same magnetic energy release vs time (when measured over long time scales) and end up in nearly the same final state after the same amount of time. Although more familiar, it is the 2-D case that is more remarkable here – the stable plasmoids trap energetic plasma from reconnection outflows and prevent it from interfering with regions upstream of thin elementary current sheets even though the plasmoids are orders of magnitude larger (§ 5.2).
(d) Three-dimensional effects increase the sensitivity to the details of the initial current sheet configuration (§ 5.3).
(e) An initial magnetic field perturbation, uniform in
$z$, can suppress 3-D effects on reconnection (at least for $B_{gz}=0$), especially at earlier times. For this reason, our 3-D simulations were initialized with no perturbation (i.e. $a=0$) except when specifically studying the effect of $a$ (§ 5.3).(f) For
$B_{gz}=0$, increasing the initial current sheet overdensity $\eta$ (while maintaining pressure balance) might weakly increase the early-time reconnection rate and make reconnection more 2-D-like, but a larger ensemble of simulations will be needed to measure this effect beyond stochastic variation (§ 5.3).(g) For weak guide field, RDKI modes cause the current sheet to ripple. In the linear phase of the instability, a mode grows to a rippling amplitude comparable to its wavelength, without releasing much magnetic energy. The mode may subsequently enter the nonlinear phase of the instability, during which the current sheet becomes highly distorted, folding over on itself and rapidly releasing magnetic energy within the rippling amplitude. This can occur even in a 2-D
$y$–$z$-plane simulation (but not in the 2-D $x$–$y$ geometry used to study reconnection), and the magnetic energy depletion can occur as fast as in 2-D reconnection, even though driven by a manifestly different large-scale mechanism. (§ 5.4, especially figure 28).(h) For
$B_{gz}=0$, varying the initial current sheet drift speed, $\beta _d c$ (while keeping $\eta \beta _d$ hence $\delta /\sigma \rho _0$ fixed), has a dramatic effect on current sheet evolution due to its influence on the RDKI. Increasing $\beta _d$ increases the growth rate of longer-wavelength RDKI modes, which can release more magnetic energy (than shorter-wavelength modes) if they grow fast enough to enter the nonlinear stage – simply because they can grow to larger amplitude (§§ 5.3 and 5.4).(i) The influence of
$\beta _d$ is only partly explained by its effect on the linear-phase growth rate. A slower-growing, longer-wavelength mode may overtake a faster-growing, shorter-wavelength mode because the latter saturates nonlinearly at smaller amplitude. The most influential mode may have much longer wavelength than the (linearly) most unstable RDKI mode. (§§ 5.4 and 5.5)(j) The nonlinear development of RDKI may play a key role in the stochastic variability of 3-D current sheet evolution (for weak guide field). Although in some cases an RDKI mode with long wavelength
$\lambda _{z,{\rm RDKI}}\gg \delta$ will grow to a large amplitude and enter nonlinear development, rapidly and dramatically changing the layer structure while converting magnetic energy to plasma energy, growth to the nonlinear stage is not inevitable. Nonlinear RDKI development may be triggered, e.g. in only a fraction of an ensemble of identically initialized simulations (up to random particle initialization), thus putting them on very different evolutionary tracks (§§ 5.4, 5.5, figure 35).(k) For
$B_{gz}=0$, the reconnection rate (normalized to $B_0 v_A$; cf. § 3.3) in the early stage of 3-D development (typically $\lesssim 10L_x/c$) varies from at most $(c/v_A)\beta _\textrm {rec}\sim 0.05$ (at small $L_z/L_x$, the same as two dimensions) to as little as $(c/v_A)\beta _\textrm {rec}\sim 0.005$ for large $L_z/L_x$; however, stochastic evolution results in large variability, and even for large $L_z/L_x$, higher rates may sometimes be observed (§ 5.5).(l) (For
$B_{gz}=0$.) For $L_z/L_x\gtrsim 1/8$, most simulations exhibit an early stage of fast magnetic energy release (but nonetheless slower than in two dimensions) lasting tens of $L_x/c$, followed by a slower stage with reconnection rates (or more precisely, upstream flux depletion rates) an order of magnitude lower, i.e. $(c/v_A)\beta _\textrm {rec}\sim 0.0005$. The slower stage can last at least up to $50L_x/c$, and perhaps much longer (§ 5.5).(m) Our results are consistent with the suggestion of Yin et al. (Reference Yin, Daughton, Karimabadi, Albright, Bowers and Margulies2008) that local reconnection rates are as high as in two dimensions, but in three dimensions only a relatively small area of the layer undergoes active reconnection, resulting in a low global reconnection rate (however, we did not measure local reconnection rates) (§ 5.1).
(n) NTPA is nearly the same in three dimensions as in two dimensions, if compared at times when the same amount of magnetic energy has been converted to plasma energy. It is equally remarkable that NTPA is nearly the same in different 3-D simulations that, despite being macroscopically identical at
$t=0$, undergo very different current sheet evolution (and 2-D $y$–$z$ simulations that suffer large-wavelength nonlinear RDKI also yield similar NTPA) (§§ 5.4, 5.5, 5.6).(o) For
$B_{gz}=0$ (and, importantly, $\sigma _h=1$), particle energy spectra show power laws $f(\gamma )\sim \gamma ^{-p}$ with $p \in [3.4,4.6]$. NTPA actually appears to be slightly more efficient in three dimensions than in two dimensions, sometimes yielding slightly harder power laws (e.g. $\gamma ^{-3.4}$), and with the fraction of particles attaining $\gamma >10\sigma$ increasing by almost an order of magnitude from two dimensions (or $L_z/L_x \ll 1/8$) to three dimensions ($L_z/L_x \gtrsim 1/8$). Enhanced NTPA in three dimensions has been previously supposed to result from the weaker trapping of particles in plasmoids which, in two dimensions, ends particle acceleration (Dahlin et al. Reference Dahlin, Drake and Swisdak2015, Reference Dahlin, Drake and Swisdak2017; Li et al. Reference Li, Guo, Li, Stanier and Kilian2019; Zhang et al. Reference Zhang, Sironi and Giannios2021). However, because of the steep power law, these differences in NTPA between two and three dimensions may be ultimately unimportant relative to other effects and uncertainties (§ 5.5).(p) Weak guide field can enhance 3-D reconnection because it suppresses 3-D effects (that slow reconnection); this is noticeable in reconnection rates and the evolution of magnetic energy even for weak guide field,
$B_{gz}/B_0\gtrsim 0.1$. However, as the guide field becomes strong enough to suppress 3-D effects substantially, reconnection behaves as in two dimensions, where increasing the guide field slows reconnection and inhibits NTPA. We believe that, for $\sigma _h=1$, guide field causes 3-D reconnection to resemble 2-D reconnection strongly around $B_{gz}/B_0 \gtrsim 1$ (but see the parenthetical caveat in the next point) (§ 5.6).(q) Stronger guide field therefore raises the reconnection rate as long as 3-D effects are more suppressive than guide-field effects. The reconnection rate rises from
$\beta _\textrm {rec}\approx 0.002$ at $B_{gz}=0$ to a maximum around $\beta _\textrm {rec}\approx 0.02$ for $0.25 \lesssim B_{gz}/B_0 \lesssim 0.75$. For even stronger guide field the reconnection rate falls (however, because of system-size limitations, we explored only up to $B_{gz}/B_0=1$ in three dimensions, with just a single simulation for each value of $B_{gz}/B_0$, and so this conclusion needs to be confirmed by future studies with better statistics and higher $B_{gz}$). (§ 5.6).(r) For each value of
$B_{gz}/B_0$ investigated ($0\leq B_{gz}/B_0 \leq 1$), NTPA is practically the same in three dimensions as in two dimensions (§ 5.6).


8. Discussion
8.1. Differences between two and three dimensions: comparison with previous works
Perhaps the most important general observation of this work is that, in the  $\sigma _h=1$ regime, thin current sheets can evolve very differently in two and in three dimensions. However, they do not always evolve differently. In particular, a guide field – possibly even
 $B_{gz}/B_0\gtrsim 0.25$ – can suppress 3-D effects, and so can a small initial perturbation that is uniform in the third dimension.
Especially in cases with very weak guide field, 3-D systems might not be well modelled by 2-D simulations. Important consequences or signatures of 3-D effects include slower rates of magnetic-to-plasma energy conversion and disintegration of plasmoid or flux-rope structures (which releases additional magnetic energy). Moreover, magnetic energy can be converted to plasma energy via a completely different mechanism – the nonlinear development of the RDKI (see § 8.2). Nevertheless, despite these 3-D effects, NTPA remains essentially the same in three dimensions as in two dimensions.
As pointed out in § 6, the dramatic differences in three dimensions might be a bit of a surprise because they were much less evident in reconnection in the  $\sigma _h\gg 1$ regime, despite clear presence of RDKI. However, some of these effects have been previously observed in
 $\sigma _h\sim 1$ pair-plasma PIC simulations. Of particular interest for their close relevance and identification of similar 3-D effects, are: Yin et al. (Reference Yin, Daughton, Karimabadi, Albright, Bowers and Margulies2008) – hereafter, Yin08; Liu et al. (Reference Liu, Li, Yin, Albright, Bowers and Liang2011) – Liu11; and Kagan et al. (Reference Kagan, Milosavljević and Spitkovsky2013) – K13.
Yin08, Liu11 and K13 all used PIC simulation to study 3-D reconnection in pair plasma with  $\sigma _h\sim 1$; simulation parameters are compared in . Yin08 initialized subrelativistic plasma with
 $\theta _b=0.016$ and
 $\sigma _h\approx 0.2$ in simulations of size
 $L_x=240\sigma \rho _0$ and
 $L_z\leq L_x$, while Liu11 and K13 both used transrelativistic plasma with
 $\theta _b=1$ and
 $\sigma _h \in [0.5, 1.5]$; Liu11 had
 $L_x=60\sigma \rho _0$ and
 $L_z\leq L_x$, and K13 studied two configurations, one with
 $L_x=52\sigma \rho _0$ and
 $L_z=1.6L_x$ and another with
 $L_x=110\sigma \rho _0$ and
 $L_z=1.1L_x$. None of these simulations used any initial perturbation. K13 was the only one that did not use a standard Harris-sheet set-up; it was also the only one to study the effect of guide field.
Approximate (ranges of) parameters for the largest 3-D simulations of Yin08, Liu11 and K13 (with two series of simulations, S1 and S2), translated to the terminology of this paper; values for 3-D simulations of this paper are also shown. Parameters not defined in § 2 or table 1 are as follows:  $v_A$ is the upstream Alfvén velocity;
 $\beta _\textrm {plasma} \equiv 8{\rm \pi} n_b \theta _b m_e c^2 / B_0^2$ is the upstream plasma beta;
 $d_{e}^\textrm {NR}\equiv (m_e c^2/4{\rm \pi} n_b e^2)^{1/2}$ and
 $d_{e,d}^\textrm {NR}\equiv (m_e c^2/4{\rm \pi} n_d e^2)^{1/2}$ are the non-relativistic collisionless background and drifting plasma skin depths (these non-relativistic scales are not applicable to this paper);
 $\ell _y$ is
 $L_y$ divided by the number of layers simulated;
 $t_\textrm {run}$ is the final simulation time.

 $^{{\dagger}}$K13 referenced lengths to
 $\lambda _p \equiv d_{e}$.
 $^{\ddagger}$Yin08 referenced lengths to
 $d_i\equiv d_{e,d}^{\textrm {NR}}$.
 $^{*}$K13 used a uniform density
 $n_b$ with varying
 $\beta _d=\beta _d(y)$ to satisfy Ampere's law (without a separate drifting component), but pressure balance was not initially satisfied, resulting in an immediate compression of the current sheet by a factor
 $\simeq \eta$ (and unknown temperature increase).
All these previous  $\sigma _h\sim 1$ studies observed tearing and reconnection as well as an initial linear growth and later nonlinear growth of RDKI modes. Yin08 and Liu11 report similar reconnection rates with no clear/significant difference between two and three dimensions, measuring
 $(c/v_A)\beta _\textrm {rec}\approx 0.06$–0.08 (with respect to the magnetic field
 $B$ averaged over the ‘inflow surface’ rather than the asymptotic upstream
 $B_0$); K13 reports 3-D rates of
 $(c/v_A)\beta _\textrm {rec}\approx 0.05$–0.08. These reconnection rates for
 $\sigma _h\sim 1$ are all roughly half of
 $(c/v_A)\beta _\textrm {rec}$ measured for
 $\sigma _h\gg 1$, and they are consistent with our results for
 $L_z\ll L_x$. However, for
 $L_z\sim L_x$ we measured significantly lower values with
 $(c/v_A)\beta _\textrm {rec} \lesssim 0.02$ (see figure 32). This may be because the previous works measured the rates in smaller systems at earlier times, or because (for Yin08 and Liu11) they normalize to a local magnetic field smaller than
 $B_0$. In addition to calculating similar reconnection rates in two and three dimensions, Yin08 shows very similar magnetic energy evolution in two and three dimensions while hinting that the energy depletion appeared to be ‘somewhat slower’ in the simulation with largest
 $L_z$ because of the limited size of the reconnecting patch.
Of these three, Liu11 is the only one that (like us) specifically reports an early stage of faster magnetic energy depletion (attributed to tearing/reconnection) followed by a stage of slower depletion (attributed to nonlinear RDKI development). In Liu11, the slower stage results in significantly more release of magnetic energy in three dimensions than in two dimensions – a signature of flux-rope disintegration (in contrast, Yin08 sees similar magnetic depletion in two and three dimensions; K13 shows  $U_{B}(t)$ only for
 $B_{gz}=B_0/4$, and not for a very long time, but if anything, the rate of magnetic depletion speeds up at later times).
Both Yin08 and Liu11 (and possibly K13) appear to observe more growth and merging of flux ropes in three dimensions than we do; however, Liu11 and K13 run long enough to see the end of the ‘period’ of flux rope merging, leaving a much less structured, more turbulent layer (which we have also observed). Apparent qualitative differences among the various simulations may have more to do with simulation size than any fundamental difference; in fact, K13 reports (for  $B_{gz}=B_0/4$) that in a smaller simulation flux ropes merge into a final, single flux rope (as in two dimensions), while in a larger simulation this merging is disrupted before reaching a single, large flux rope. Although these simulations all ran in somewhat different regimes with different initial current sheet configurations (which, we have shown, can make a difference – see §§ 5.3–5.4), the combined results appear consistent with the notion that as systems become increasingly larger, the stage of 2-D-like reconnection becomes increasingly transient. This may suggest that the later, slower stage – with significant 3-D effects – is more relevant for astrophysically large systems.
All these papers also observe nonlinear RDKI in some form, but always following a stage of tearing and reconnection (whereas we have shown that for some initial current sheet configurations, RDKI may drive the earliest stage of rapid magnetic energy release; see § 5.4). Interestingly, in Yin08, a long (in  $z$) current sheet forms between growing flux ropes, undergoes extreme distortion and folding via nonlinear RDKI (which Yin08 calls ‘secondary’ kinking), and subsequently reforms as a thin, reconnecting current sheet, suggesting such behaviour may be cyclic. Liu11 also observes ‘self-organization’ of initially patchy reconnecting regions into a ‘highly elongated’ current sheet between growing flux ropes, although this sheet appears to be permanently disrupted by nonlinear RDKI (i.e. it does not reform as in Yin08).
Both Liu11 and K13 investigated particle acceleration and report non-thermal particle energy spectra. The spectra are consistent with power laws  $\gamma ^{-p}$ with (very roughly), for Liu11,
 $p\approx 2.5$ up to a cutoff
 $\gamma _c\sim 4\sigma$, and for K13,
 $p\approx 3.5$ up to
 $\gamma _c\sim 7\sigma$ (for the largest simulation, labelled S2K025L, with
 $\sigma =4$,
 $B_{gz}/B_0=0.25$, and
 $L_x=110\sigma \rho _0$; for a smaller simulation,
 $L_x=55\sigma \rho _0$, the spectra were nearly identical for
 $B_{gz}/B_0=0$ and
 $0.25$). Because the cutoffs of power laws can be misleading to compare for different power-law slopes, we also note a more straightforward measure of the (high) energy at which
 $f(\gamma )$ becomes small, namely the value
 $\gamma _{-4}$ for which
 $f(\gamma _{-4})\equiv 10^{-4} \max _\gamma f(\gamma )$; for Liu11,
 $\gamma _{-4}=7.1\sigma$ and for K13 (S2K025L),
 $\gamma _{-4}=7.8\sigma$; for our 3-D simulations with
 $L_x=512\sigma \rho _0$,
 $\gamma _{-4}=10\sigma$.
Considering the somewhat different parameters, including system size and run time, these results seem reasonably consistent. Liu11 and (to a lesser extent) K13 might measure less steep spectra than we do, but the cause of this could easily be the larger  $\sigma _h$ in Liu11 and/or the sub- or transrelativistic upstream plasma, and/or the smaller system sizes and different initial current sheet configurations. K13 investigated the effect of guide field, running simulations with
 $B_{gz}/B_0=0,$ 0.25 and 1. Although K13 does not report on relative reconnection or magnetic energy depletion rates, there is a suppression of NTPA for
 $B_{gz}/B_0=1$ relative to the weaker guide fields, also consistent with our results.
Thus it appears that the most important 3-D effects that we have observed in an evolving current sheet are consistent with previous observations in similar parameter regimes, although the 3-D effects have generally become clearer with our larger system size and scan over a broader range of simulation parameters. Importantly, we have studied 3-D effects with respect to different current sheet configurations, which can dramatically alter the strength of these effects, especially at early times. In particular, we have highlighted the importance of (sufficiently fast-growing) long-wavelength RDKI modes – namely that they can grow to large amplitudes before entering the nonlinear stage in which the current layer can be dramatically transformed while rapidly releasing magnetic energy (see § 5.4 and § 8.2). In addition, we have shown that NTPA can be driven by 2-D-like reconnection, or the slower stage of reconnection (and possibly RDKI), or by rapid nonlinear RDKI, yielding very similar particle energy spectra in all cases.
Having discussed the  $\sigma _h\sim 1$ regime, we briefly comment on differences between 3-D reconnection in the
 $\sigma _h=1$ regime compared with the
 $\sigma _h \gg 1$ regime, where 3-D reconnection has been observed to be quite similar to 2-D reconnection (e.g. Sironi & Spitkovsky Reference Sironi and Spitkovsky2014; Guo et al. Reference Guo, Li, Daughton and Liu2014, Reference Guo, Liu, Daughton and Li2015; Werner & Uzdensky Reference Werner and Uzdensky2017; Guo et al. Reference Guo, Li, Daughton, Li, Kilian, Liu, Zhang and Zhang2020) – more details were given in § 6. Based on these
 $\sigma _h\gg 1$ studies, it is likely that large
 $\sigma _h$ tends to enhance reconnection and/or suppress 3-D reconnection-disrupting effects. However, most of the large-
 $\sigma _h$ studies have used an initial perturbation of some kind, which we have shown can suppress 3-D effects, especially at early times. The extent of the role of the initial perturbation requires further study; regardless of the results, however, what is really needed is a better understanding of system-size dependence in three dimensions. In the
 $\sigma _h\sim 1$ regime, a 2-D-like reconnection stage may be very transient in larger simulations; and due to resolution requirements, feasible simulations with
 $\sigma _h\sim 1$ can be relatively larger than those with
 $\sigma _h \gg 1$. It may be, therefore, that larger 3-D simulations with
 $\sigma _h\gg 1$ begin to show distinctly 3-D effects – such as the slowing of reconnection and disruption by RDKI, as well as the possibility of magnetic energy release through RDKI – at much larger sizes than anyone has yet simulated.
8.2. Another magnetic energy release mechanism: nonlinear RDKI
We have found that, in at least some cases, a thin 3-D current sheet can release magnetic energy by a mechanism that may have nothing to do with magnetic reconnection – namely the nonlinear RDKI, which causes a highly kinked (or rippled) current sheet to fold over on itself (see § 5.4; Zenitani & Hoshino Reference Zenitani and Hoshino2007). This mechanism can operate in 2-D  $y$–
 $z$ geometry (perpendicular to the magnetic field), where large-scale magnetic reconnection is impossible and upstream flux is directly annihilated, and it can release magnetic energy as fast as 2-D reconnection while generating similar NTPA. Importantly, the earlier linear development of RDKI releases little magnetic energy and does not yield significant NTPA (and it might not even interfere with reconnection). Because the nonlinear RDKI causes the rippling to saturate at an amplitude of the order of the instability wavelength, longer-wavelength RDKI modes can reach larger amplitudes and thus have greater impact, even if they grow more slowly; but of course they still have to grow enough to reach the nonlinear stage to trigger rapid magnetic energy release. While it is possible that, in the nonlinear RDKI development, small-scale reconnection (or, alternatively, turbulence-enhanced magnetic diffusion) plays a role in releasing magnetic energy, it is clearly RDKI at large scales that drives the process of energy conversion.
As an alternate channel for releasing magnetic energy, RDKI may offer a neat solution to the ‘triggering’ or ‘onset’ problem faced by reconnection (e.g. Ji et al. Reference Ji, Alt, Antiochos, Baalrud, Bale, Bellan, Begelman, Beresnyak, Blackman and Brennan2019). This is the problem of reconciling the slow time scale of current sheet formation and magnetic energy build-up with the fast time scale of magnetic energy release; the current sheet must be relatively stable as it slowly forms, until at some point it suddenly becomes unstable – e.g. reconnection is triggered and releases energy rapidly (e.g. Pucci & Velli Reference Pucci and Velli2014; Tenerani et al. Reference Tenerani, Velli, Pucci, Landi and Rappazzo2016; Uzdensky & Loureiro Reference Uzdensky and Loureiro2016; Comisso et al. Reference Comisso, Lingam, Huang and Bhattacharjee2017; Huang, Comisso & Bhattacharjee Reference Huang, Comisso and Bhattacharjee2017, Reference Huang, Comisso and Bhattacharjee2019). With reconnection, solving this problem likely requires understanding the mechanism behind current sheet formation. With RDKI, there is a simpler explanation: the current sheet may form and RDKI (at sufficiently long wavelength) may grow slowly, because the linear stage of RDKI does not release much magnetic energy. The trigger occurs when the RDKI amplitude becomes comparable to its wavelength, and nonlinear development begins.
However, to understand its potential astrophysical importance, it will be critical to determine the dependence of the nonlinear RDKI on system size. For any given wavelength, the nonlinear RDKI cannot continue forever; it dissipates magnetic energy within a layer of thickness (at most) comparable to the wavelength. It might not continue to release upstream magnetic energy in the way that 2-D reconnection does (as discussed in § 5.4, one might suppose 2-D reconnection would saturate after plasmoids grow to the size of the elementary current sheet; however, simulations show that plasmoids detach and move away without disrupting the elementary current sheets, so that reconnection does not saturate until plasmoids grow to the system-size scale). However, RDKI could potentially continue to develop at different, longer wavelengths.
For instance, an RDKI mode with wavelength  $\lambda _{z,{\rm RDKI}}$ may grow in a current sheet of thickness
 $\sim \delta$; if
 $\lambda _{z,{\rm RDKI}}\gg \delta$ and the mode reaches an amplitude of order
 $\lambda _{z,{\rm RDKI}}$, nonlinear development may release the magnetic energy within a layer of thickness
 $\delta ' \sim \lambda _{z,{\rm RDKI}}$, resulting in a new current sheet of greater thickness,
 $\delta ' \gg \delta$. Because shorter-wavelength modes are limited to smaller amplitudes, longer-wavelength modes tend to be more influential. Indeed, in some of our simulations, current sheet evolution was eventually dominated by the RDKI mode with the longest-possible wavelength,
 $\lambda _{z,{\rm RDKI}}\sim L_z$; if this behaviour continues up to systems of arbitrary size, nonlinear RDKI could potentially release astrophysically large amounts of energy. This could occur in one fell swoop, or in a series of stages (bursts) cascading up to the system size: the thickened layer with
 $\delta '$ might subsequently be destabilized by a new mode with
 $\lambda _{z,{\rm RDKI}}' \gg \delta '$, which might grow enough to enter the nonlinear phase, suddenly releasing energy in a layer of thickness
 $\delta '' \sim \lambda _{z,{\rm RDKI}}'$, etc., until the entire system is substantially depleted of magnetic energy. Alternatively, this process could slow to an effective halt well before reaching the system size, with further energy release requiring other processes to thin out the layer (e.g. the processes responsible for the current sheet formation in the first place). Whether and how fast nonlinear RDKI, operating in sufficiently large systems, can release astrophysically large amounts of energy, are important questions that we leave to future research.
8.3. Observable astrophysical consequences
In this paper we have investigated the plasma dynamics of current sheet evolution as well as resulting NTPA, which are unlikely to be directly observable in any astrophysical source; however, synchrotron and inverse Compton emission from high-energy particles may be observable. Although we must leave a detailed study of radiation to future work, we can infer some observable consequences under simplifying assumptions. Synchrotron and inverse Compton emission from high-energy electrons and positrons will depend on the shape and normalization of the distribution of accelerated particles. Importantly, we have shown that the magnetization  $\sigma _h$ and guide field strength
 $B_{gz}/B_0$ strongly affect both energy conversion rates and the NTPA spectrum; on the other hand, the dimensionality (two vs three dimensions) and initial current sheet configuration can affect energy conversion rates but, at most, weakly affect the NTPA spectrum. This is a double-edged sword. On one hand, we may be able to infer
 $\sigma _h$ and
 $B_{gz}/B_0$ from observations conveniently without knowing other details. On the other hand, we may not be able to determine less influential details of the current sheet or even the effective dimensionality of astrophysical current sheets from observations. Here we say ‘effective dimensionality’ because we have seen that, under some circumstances – e.g. strong guide field, small
 $L_z/L_x$, or perhaps some sort of perturbation that encourages uniformity in
 $z$ – a 3-D current sheet can evolve as if it were in two dimensions.
The most basic observable signatures are simply the radiation intensity and (for a flaring event) duration. For this reason the study of astrophysical reconnection has been justifiably obsessed with measuring and understanding the reconnection rate to determine whether reconnection can explain rapid magnetic energy releases. We have observed that the reconnection rate in 2-D simulations is about what would be expected for ‘fast’ reconnection, i.e.  $(c/v_A)\beta _\textrm {rec}\sim 0.1$. If more precision is desired, we have shown that the actual value is somewhat less than 0.1 for
 $\sigma _h=1$ and
 $B_{gz}=0$, and guide field can slow the rate even more, up to about a factor of 3 for strong guide field. The reconnection rate in three dimensions can be substantially lower, leading to lower radiated power and longer duration (for a given source size); depending on precisely how 3-D reconnection is triggered, it may yield two stages (as in our simulations), an initial flare somewhat less bright than one would expect from 2-D simulations, following by a much longer, much dimmer afterglow. Observed intensity could thus be an important diagnostic of effective dimensionality. Unfortunately, it is complicated by the sensitivity to initial current sheet configurations, and also the difficulty of relating the total radiated power to the observed intensity at a particular viewing angle (discussed below).
The next most basic signature is probably the spectral energy distribution of observable radiation. The photon spectra are a consequence of the particle spectra and should therefore depend on  $\sigma _h$ and
 $B_{gz}/B_0$, but may be fairly insensitive to dimensionality and initial current sheet details. For instance, for
 $\sigma _h=1$ and
 $B_{gz}/B_0= 0$, we have seen that the particle energy power-law index is around
 $p\approx 4$, and we can infer (assuming a steady-state, uniform, isotropic, weakly radiative system) that the emitted photon energy power-law index would be around
 $\alpha = (p-1)/2 \approx 1.5$. For stronger
 $B_{gz}$, the photon spectrum would steepen accordingly.
However, more detailed computation of emitted radiation from self-consistent PIC simulations is needed to determine whether these conclusions are valid outside of a much-simplified radiation emission model. In particular, we need to consider the spatial and angular dependence of accelerated particles. In addition, if radiation is very strong/efficient, the radiation reaction force will alter the high-energy particle distributions and possibly even the current sheet evolution.
Because ultrarelativistic particles emit synchrotron and inverse Compton emission narrowly beamed around their directions of motion, the angular dependence of particle spectra may have important consequences for observation of radiation along a particular line of sight (see, e.g. Jaroschek & Hoshino Reference Jaroschek and Hoshino2009; Cerutti et al. Reference Cerutti, Uzdensky and Begelman2012a,Reference Cerutti, Werner, Uzdensky and Begelmanb, Reference Cerutti, Werner, Uzdensky and Begelman2013, Reference Cerutti, Werner, Uzdensky and Begelman2014a,Reference Cerutti, Werner, Uzdensky and Begelmanb; Kagan et al. Reference Kagan, Milosavljević and Spitkovsky2013; Christie et al. Reference Christie, Petropoulou, Sironi and Giannios2018; Werner et al. Reference Werner, Philippov and Uzdensky2019; Mehlhaff et al. Reference Mehlhaff, Werner, Uzdensky and Begelman2020; Sironi & Beloborodov Reference Sironi and Beloborodov2020). For example, kinetic beaming – i.e. a strong energy-dependent anisotropy of particle spectra and hence radiation – observed in high- $\sigma _h$, 2-D reconnection (Cerutti et al. Reference Cerutti, Werner, Uzdensky and Begelman2012b; Mehlhaff et al. Reference Mehlhaff, Werner, Uzdensky and Begelman2020) may be sensitive to 3-D effects and/or the current sheet configuration, even if the isotropically averaged spectra are not. Indeed, kinetic beaming has previously been observed to be present but weaker in three dimensions (Kagan et al. Reference Kagan, Milosavljević and Spitkovsky2013; Cerutti et al. Reference Cerutti, Werner, Uzdensky and Begelman2014b); however, this issue needs systematic study over a range of
 $\sigma _h$, current sheet configurations, guide fields and radiation strengths.
Since we have seen that the spatial distribution of magnetic field can be quite different in two and three dimensions(cf. figure 18), the spatial dependence of particle distributions may also be important in determining synchrotron emission. For example, in three dimensions the nonlinear RDKI can result in a thickened current layer – a relatively large volume with greatly diminished magnetic field. As a result, particles accelerated by the nonlinear RDKI may radiate very little within the layer, emitting and cooling only as they exit the layer, when they suddenly experience nearly the full ambient magnetic field. This could affect both the average radiated power (because radiation is suppressed in the layer) and the spectrum (because the magnetic field is mostly either full strength or low strength). In contrast, there is less reason to believe that overall inverse Compton radiation would be different in two and three dimensions, unless the spectrum of soft photons (to be upscattered by high-energy electrons and positrons) is different – e.g. for synchrotron self-Compton, where the ‘soft’ photons may be a result of synchrotron radiation.
If radiative cooling of particles is strong (compared with accelerating forces), the radiation reaction force can alter the spectra of accelerated particles. This is especially interesting in the case of synchrotron radiation, because particles accelerated by 2-D reconnection may experience significant acceleration in regions of low magnetic field, allowing them to exceed the synchrotron burnoff limit (i.e. to exceed the energy at which the radiation reaction force in the ambient/upstream magnetic field would cancel electric-field acceleration, Uzdensky, Cerutti & Begelman Reference Uzdensky, Cerutti and Begelman2011; Cerutti et al. Reference Cerutti, Uzdensky and Begelman2012a,Reference Cerutti, Werner, Uzdensky and Begelmanb). The different geometry of 3-D current sheet evolution, not to mention different large-scale driving mechanisms (e.g. nonlinear RDKI vs 2-D reconnection), might affect whether and how particles can exceed the burnoff limit. In Cerutti et al. (Reference Cerutti, Werner, Uzdensky and Begelman2014b), particles accelerated by RDKI in 2-D $yz$ geometry did not exceed the burnoff limit, although particles accelerated by a 3-D evolving current sheet did (although not nearly as much as in 2-D
 $xy$ reconnection); however, that was for one particular current sheet configuration and
 $\sigma _h$ (though multiple guide-field strengths were investigated). It is possible that this conclusion would change for other systems, especially considering that we have shown that nonlinear RDKI is dramatically affected by the initial current sheet configuration (see §§ 5.3 and 5.4).
By showing that 3-D effects as well as the initial configuration can substantially affect current sheet evolution, we have demonstrated the need to simulate radiation from these systems to determine observable signatures. Although the insensitivity of NTPA spectra to these details may result in photon spectra that depend primarily on  $\sigma _h$ and
 $B_{gz}/B_0$, this cannot be determined until we also understand the spatial and angular dependence of NTPA spectra and the emitted photon spectra.
9. Conclusion
Magnetic reconnection is a plasma process that is important in large part because it converts magnetic energy to plasma (particle) energy. It may play a key role in relativistically hot plasmas (including electron–positron pair plasmas) in a variety of astrophysical sources, accelerating particles to very high energies where they can emit observable radiation. In general, but especially for astrophysical applications, we seek to understand the rate and amount of magnetic energy conversion as well as the development of non-thermal particle energy distributions that can be correlated with emitted radiation. The primary way in which we can infer the role of reconnection in astrophysical sources, which cannot be directly probed, is to connect observable consequences of reconnection (i.e. radiation) with the source plasma conditions (such as magnetic field and plasma density), which can be inferred therefrom. Most of the systematic studies of the effects of varying reconnection parameters in astrophysically relevant relativistically hot plasma have focused on highly magnetized regimes. We add to the literature this study focusing on the moderately magnetized regime,  $\sigma _h=1$, in which the ambient magnetic energy is roughly in equipartition with the ambient plasma energy. It is especially important to understand the effect of different values of the ‘hot’ magnetization
 $\sigma _h$ because it exerts a substantial influence on reconnection: not only does it place an upper bound on the relative energy gain of particles, but it also determines the Alfvén velocity, which controls the rate of reconnection.
This paper presents the first study that systemically investigates energy conversion and NTPA in reconnection across a wide variety of parameters in the ultrarelativistic  $\sigma _h=1$ pair plasma regime. Specifically, we explore the effects of different initial current sheet configurations, system-sizes (in two dimensions), guide magnetic fields, and (in three dimensions) aspect ratios
 $L_z/L_x$. To compare simulations we look particularly at the rates at which magnetic energy is converted to plasma energy, as well as the resulting NTPA. An extensive summary of briefly stated important results can be found in § 7.
Our 2-D simulations show that reconnection with  $\sigma _h=1$ qualitatively resembles relativistic reconnection in the
 $\sigma _h\gg 1$ regime; however, they also measure significant quantitative differences – differences that could ultimately allow one to constrain
 $\sigma _h$ in an astrophysical source based on observed radiation.
In contrast, our 3-D simulations reveal substantially different qualitative behaviours, as well as (in many cases) significantly slower conversion of magnetic to plasma energy. We find that in three dimensions there are other mechanisms besides large-scale (2-D-like) reconnection that can drive current sheet evolution and plasma energization. It would therefore be more precise to say that we are studying the evolution of a thin current sheet in three dimensions rather than 3-D reconnection. Fascinatingly, regardless of the large-scale driver, NTPA remains robust, very similar in two and three dimensions – when compared at equivalent fractions of converted magnetic energy.
Results characterizing reconnection and energy conversion rates and NTPA in two dimensions for  $\sigma _h=1$ are described in § 4 and compared with the
 $\sigma _h\gg 1$ regime in § 6. By comparing with other works studying
 $\sigma _h\gg 1$, we see that
 $\sigma _h$ strongly influences these key outcomes. In two dimensions, for
 $\sigma _h=1$ and zero guide field, we find that the dimensionless reconnection rate (i.e. normalized to
 $B_0 v_A$) is around 0.03, which is somewhat less than the
 $\sim 0.1$ observed for
 $\sigma _h \gg 1$. Reconnection with
 $\sigma _h=1$ clearly yields NTPA, but generates a high-energy power-law energy spectrum
 $f(\gamma )\sim \gamma ^{-4}$, significantly steeper than for
 $\sigma _h\gg 1$. Increasing the guide field
 $B_{gz}$ slows reconnection and suppresses NTPA, yielding still steeper power-law spectra. We believe the guide field slows down reconnection by reducing the effective Alfvén speed in the outflow direction, while the reduced compressibility of the guide-field-threaded plasma causes reconnection to end with more unreconnected flux remaining (in a closed system). We expect these guide field effects to become significant for
 $B_{gz}/B_0 \gtrsim 1/\sigma _h$ (thus they should become evident only for much stronger guide field in non-relativistic reconnection, where
 $\sigma _h\ll 1$ because
 $\sigma _h$ includes rest-mass enthalpy). Moreover, we find that these outcomes in two dimensions are relatively insensitive to the details of the initial current sheet, indicating that the primary results of 2-D reconnection (energy conversion and NTPA) may be robust functions of the ambient plasma, as hoped (to connect observations with astrophysical source conditions).
In three dimensions, the story is much different. Unlike relativistic reconnection with  $\sigma _h\gg 1$, 3-D effects substantially alter reconnection with
 $\sigma _h=1$. In fact, true reconnection may have a much diminished role in the 3-D evolution of thin current sheets, with other processes (likely driven by the RDKI) competing to convert magnetic energy to plasma energy. As a result, the morphology of the current sheet does not feature the intricately hierarchical plasmoid structure familiar from 2-D reconnection simulations. In three dimensions, plasmoids can decay, and instead of storing magnetic energy as in two dimensions, they release their magnetic energy to the plasma. Thus 3-D ‘reconnection’ can convert upstream magnetic energy more completely to plasma energy. However, the rate of energy conversion may be significantly (an order of magnitude) slower in three dimensions, even at early stages, and still slower at later stages.
Reconnection simulations in both two and three dimensions evolve stochastically or chaotically, following different paths from the initially random particle distributions. However, the competition among different magnetic-energy-releasing mechanisms leads to a variety of long-term behaviours in three dimensions, in contrast to the relative inevitability with which 2-D reconnection evolves to a common final state (despite unpredictable chaotic plasmoid behaviour along the way). In three dimensions, current sheet evolution is significantly more sensitive to the initial current sheet configuration than in two dimensions. For example, an initial magnetic field perturbation (relatively inconsequential in 2-D simulations) tends to force 3-D evolution to resemble 2-D-like reconnection. The main competition to reconnection appears to come from the RDKI; importantly, we find that it might not be the fastest-growing RDKI mode that presents the stiffest competition, but rather the longest-wavelength, ‘sufficiently fast-growing’ mode. While the linear stage of the RDKI does not deplete much magnetic energy, its nonlinear development – especially in large-amplitude modes – competes with reconnection to convert significant amounts of magnetic energy to plasma energy. In particular, we have observed the RDKI-induced rippling of the current sheet grow to an amplitude comparable to its wavelength (without depleting much magnetic energy) and subsequently fold over on itself, rapidly converting most of the magnetic energy within the rippling amplitude to plasma energy. Because longer-wavelength modes reach larger amplitudes, they can have a larger impact; whereas short-wavelength modes, though they may grow faster, saturate at small amplitudes without obstructing reconnection. We find that a completely different mechanism can thus deplete magnetic energy as fast as reconnection. However, whereas reconnection results in a highly structured chain of plasmoids that – despite monstrously large plasmoids – preserves thin (kinetic-scale) inter-plasmoid current sheets, this RDKI-triggered process results in a turbulent, generally thickened current layer, which seems to disrupt reconnection.
Despite sometimes very large differences between 2-D and 3-D current sheet evolution – and even between different 3-D evolutions – the resulting NTPA is remarkably similar in all cases (with the same guide magnetic field).
The presence of a guide magnetic field tends to suppress 3-D effects, causing current sheet evolution to behave more like 2-D reconnection. This leads to an interesting non-monotonic trend in three dimensions with increasing guide field, since both 3-D effects and guide field suppress reconnection. A weak guide field tends to enhance the 3-D reconnection rate by diminishing 3-D effects; but once the guide field is strong enough to suppress 3-D effects nearly completely, further increase suppresses reconnection in three dimensions as in two dimensions. Again, even with guide field, NTPA is very similar in two and three dimensions. Increased guide field (unlike 3-D effects) suppresses NTPA, leading to steeper power-law energy distributions.
This investigation shows that 3-D current sheet evolution is not necessarily a perturbation or modification of 2-D reconnection, but rather involves a complicated interaction of linear and nonlinear stages of multiple instabilities. This leads to a range of possible behaviours and an accompanying sensitivity to initial conditions that motivates further exploration of initial configurations and construction of parameter-space phase diagrams; these possibilities and sensitivities must then be considered in astrophysical modelling. It also increases the urgency of understanding the current sheet formation process in the first place. On the other hand, the diversity of behaviour highlights universalities in magnetic energy dissipation and resulting NTPA that could find important use in astrophysical models. While the rate of magnetic energy dissipation can vary significantly depending on the details of the current sheet, all configurations yield, though by different means, ‘fast’ magnetic energy release in the sense that it is tremendously faster than naive magnetic diffusion; and the non-thermal particle spectra are even more universal, determined primarily by the ambient  $\sigma _h$ and
 $B_{gz}/B_0$. These universalities will be invaluable for astrophysical modelling and may be important clues to a deeper understanding of magnetic energy dissipation and particle acceleration in plasmas.
Funding
We would like to thank NSF, DOE and NASA for supporting this work. This work was supported by grants NSF AST-1806084, NSF AST-1903335, NASA ATP NNX16AB28G, NASA ATP NNX17AK57G, NASA ATP 80NSSC20K0545. In addition, this work would not have been possible without substantial supercomputing time. An award of computer time was provided by the Innovative and Novel Computational Impact on Theory and Experiment (INCITE) program; for the 3-D simulations, this research used resources of the Argonne Leadership Computing Facility, which is a DOE Office of Science User Facility supported under contract DE-AC02-06CH11357. This work also used the Extreme Science and Engineering Discovery Environment (XSEDE), which is supported by National Science Foundation grant number ACI-1548562 (Towns et al. Reference Towns, Cockerill, Dahan, Foster, Gaither, Grimshaw, Hazlewood, Lathrop, Lifka and Peterson2014); in particular, the large 2-D simulations were run at the Texas Advanced Computing Center (TACC) at The University of Texas at Austin.
Declaration of interests
The authors report no conflict of interest.
Data availability
The data that support the findings of this study can be made available upon reasonable request for at least one year after publication.
Appendix. Grid resolution
Throughout this paper, we use a grid resolution of  $\Delta x = \sigma \rho _0/3$. For
 $\sigma _h=1$, this
 $\Delta x$ resolves the fundamental plasma scales: the (upstream) Debye length
 $\lambda _D=(1/2)\sigma _h^{-1} \sigma \rho _0$ is marginally resolved, while the (upstream) collisionless skin depth
 $d_e = \sqrt {3}\lambda _D$ and the Larmor radii of typical upstream particles,
 $\rho _b \approx 3\theta _b \rho _0 = (3/4)\sigma _h^{-1} \sigma \rho _0$, are slightly better resolved. Although we explore different values of the initial current sheet half- thickness
 $\delta$, most simulations presented here use
 $\delta = (2/3) \sigma \rho _0$ (corresponding to
 $\eta =5$), giving 4 cells over the initial current sheet thickness
 $2\delta$.
The main motivation to study the  $\sigma _h \sim 1$ pair-plasma regime is its astrophysical application; however, it is also of interest because the small scales (
 $\lambda _D$,
 $d_e$,
 $\rho _b$) are nearly the same, allowing maximum dynamic range (between the kinetic scales and system size) with minimum computation.
We naturally want to use the coarsest resolution possible that captures the desired plasma physics and yields stable simulation, so that we can reach the largest possible system sizes with the least computation. Figure 42 demonstrates the effect of changing resolution for 2-D simulations of size  $L_x=320\sigma \rho _0$, showing that the two most telling diagnostics, magnetic energy evolution and NTPA spectra, are the same (up to inherent stochasticity) for resolutions ranging from
 $\Delta x = \sigma \rho _0/2$ to
 $\Delta x = \sigma \rho _0/24$; simulations were only run for
 $4.5L_x/c$ to save computation time. For the rest of the paper, we use
 $\Delta x=\sigma \rho _0/3$. This resolution becomes insufficient for very large systems (
 $L_x\gtrsim 2560 \sigma \rho _0$), which begin to exhibit poor energy conservation, where the total simulation energy, which should be conserved, increases by more than a fraction of a per cent. However, we can show that even when the total energy grows by
 $O$(1 per cent), it does not significantly affect the results, aside from a small amount of extra heating (cf. figure 10(c), where we compare
 $\Delta x=\sigma \rho _0/3$ and
 $\Delta x=\sigma \rho _0/4$ for a very large simulation).
(a) Transverse magnetic energy vs time, and (b) particle energy spectra  $f(\gamma )$, compensated by
 $\gamma ^4$, at
 $t=4.5L_x/c$ (with the initial spectra at
 $t=0$ shown for comparison in dashed grey), for the same 2-D simulation with resolutions from
 $\Delta x=\sigma \rho _0/2$ to
 $\Delta x=\sigma \rho _0/24$. These simulations have
 $L_x=320\sigma \rho _0$,
 $B_{gz}=0$,
 $\eta =5$ (
 $\delta /\sigma \rho _0=2/3$) and an initial perturbation
 $a=11$ (
 $s/\delta =5.4$), with 40 background particles per cell and 40 initially drifting particles per cell.

We note that another relevant length scale is the most unstable wavelength of the RDKI (in the absence of guide magnetic field),  $\lambda _\textrm {RDKI} = 2{\rm \pi} /k_{z,{\rm RDKI}} \simeq 2{\rm \pi} (8\gamma _d \beta _d^2) \delta$ (Zenitani & Hoshino Reference Zenitani and Hoshino2007). For
 $\beta _d=0.3$,
 $\lambda _\textrm {RDKI} \simeq 5 \delta$; thus this most unstable mode is resolved somewhat better than the initial current sheet (of half-thickness
 $\delta$) – which is marginally resolved for
 $\Delta x = \sigma \rho _0/3$.
In (2-D)  $y$–
 $z$ simulations, we do see that, when the initial current sheet is marginally resolved, as for
 $\delta /\sigma \rho _0=2/3$ (
 $\eta =5$) and
 $\Delta x = \sigma \rho _0/3$, that RDKI is suppressed and, e.g. greater instability and magnetic depletion occurs for higher resolution, e.g.
 $\Delta x = \sigma \rho _0/6$. However, such a thin initial current sheet requires initially drifting particles with a temperature below that of background particles (
 $\theta _d/\theta _b = 2\gamma _d/\eta \approx 0.4$). In a 3-D simulation, tearing and reconnection rapidly moves (hotter) background particles into the current sheet, thickening it. Moreover, in § 5.3, where we specifically study the initial current sheet evolution in three dimensions, we include cases where the current sheet and linear RDKI modes are much better resolved.