


Introduction
Human infection with T. solium remains a major public health concern, particularly in endemic regions where it is a leading cause of cysticercosis and associated neurological disease. Accurate identification of T. solium intestinal infection is essential for both clinical management and epidemiological surveillance. However, discrimination of T. solium from other human-infecting Taenia species, including T. saginata and T. asiatica, remains challenging because their eggs are morphologically indistinguishable (Garcia et al. Reference Garcia, Nash and Del Brutto2014).
Molecular approaches have improved species identification within the genus Taenia, with PCR-based assays targeting mitochondrial and nuclear loci, including genes such as cox1 and other conserved genomic regions (Yamasaki et al. Reference Yamasaki2004). These include species-specific and copro-PCR assays developed to differentiate T. solium and T. saginata in clinical and field samples (González et al. Reference González2010; Mayta et al. Reference Mayta2008; Nkouawa et al. Reference Nkouawa2016). While these methods have enabled more accurate detection, limitations remain, including potential cross-reactivity and reliance on a limited number of genomic regions.
Identifying robust, species-specific molecular targets is therefore critical for developing reliable diagnostic tools. This study aims to identify and analytically validate a species-specific molecular target for the discrimination of T. solium. Using comparative sequence analysis, we selected a candidate locus containing diagnostic polymorphisms and evaluated its performance using quantitative PCR. Our results provide evidence for a specific and sensitive molecular marker that may support the development of improved diagnostic approaches for T. solium detection.
Materials and methods
Sequence retrieval and comparative analysis
Genomic and coding sequences for Taenia solium and other cestodes were retrieved from WormBase ParaSite; Caenorhabditis elegans and Homo sapiens sequences were retrieved from GenBank. Sequences corresponding to the T. solium gene TsM_001199400 and homologous regions in T. saginata (TSAs00053g06643), T. multiceps (Tm1G000043), and T. asiatica (TASs00049g05486) were aligned using Clustal Omega. Phylogenetic analysis was performed in MEGA v12 using the Neighbor-Joining method with 10,000 bootstrap replicates.
Target selection and primer design
A candidate locus within the T. solium gene TsM_001199400 was selected based on the presence of species-specific polymorphisms identified through comparative sequence analysis. Primers were designed using Primer-BLAST to amplify a 198 bp fragment. To enhance specificity, the 3′ end of the reverse primer was positioned over a polymorphic site unique to T. solium. Primer specificity was initially assessed in silico against available cestode sequences.
DNA samples
Genomic DNA from T. solium, T. saginata, and H. sapiens samples was used for assays. Parasite DNA was obtained from cysts (T. solium) and proglottids (T. saginata) collected for previous studies and stored in RNAlater at −80°C prior to extraction. DNA from samples was extracted using the Quick-DNA™ Miniprep Plus Kit (Zymo Research), and concentrations were measured using a NanoDrop spectrophotometer (Thermo Fisher Scientific), later adjusted to 100 ng/μl.
Quantitative PCR (qPCR)
qPCR was performed using PowerUp SYBR Green Master Mix (Thermo Fisher Scientific) in 10 μl reactions containing 500 nM of each primer and 1 μl of template DNA. Amplification was carried out on a qTOWERReference Mayta 3 real-time PCR system (Analytik Jena) under the following conditions: 50°C for 2 min, 95°C for 2 min, followed by 40 cycles of 95°C for 15 s and 60°C for 1 min. Melting curve analysis was performed to confirm amplification specificity.
Analytical sensitivity and specificity
Analytical sensitivity was assessed using 10-fold serial dilutions of T. solium genomic DNA. Analytical specificity was evaluated by testing genomic DNA from T. saginata and human samples under identical conditions. All reactions were performed in triplicate. qPCR products were resolved by electrophoresis on 3% agarose gels run at 100 V for 60 min, stained with SYBR Safe DNA Gel Stain (Thermo Fisher Scientific), and visualised under UV illumination.
Data analysis
qPCR data were analysed using GraphPad Prism v8. Standard curves were generated from 10-fold serial dilutions, and amplification efficiency was calculated from the slope using the equation E = 10−1/slope−1, expressed as a percentage. The coefficient of determination (R2) was used to assess linearity. Genome equivalents were estimated based on the haploid genome size of T. solium, approximated at ~120 Mb. The mass of a single haploid genome was calculated assuming 1 bp ≈ 660 Da, corresponding to ~1.32 × 10⁻¹³ g (0.132 pg) per genome. Genome equivalents were then derived by dividing the input DNA mass by this value.
Results and discussion
Comparative sequence analysis identified a candidate locus within the T. solium genome corresponding to the gene TsM_001199400, encoding an actin protein. Phylogenetic analysis based on the selected locus confirmed the expected clustering of Taenia species, with T. solium grouping closely with T. saginata, T. asiatica, and T. multiceps, while remaining distinct from other cestode genera, including the other taeniid Echinococcus, and Hymenolepis, from a different family, as well as from the selected outgroup sequences (C. elegans and human) (Figure 1a). This topology supports the suitability of the selected locus for species-level discrimination.
Identification and analytical validation of a molecular target for Taenia solium detection.
Phylogenetic tree generated from aligned sequences of the selected locus across representative Taenia species, other cestode genera, and selected outgroup sequences. The tree was constructed using the Neighbor-Joining method with 10,000 bootstrap replicates. Accession numbers and database sources are indicated adjacent to each corresponding species.

Figure 1(a) Long description
The figure contains two elements side by side: a phylogenetic tree on the left and a reference table on the right.
Tree structure
The tree displays 10 taxa across four main groupings, arranged from top to bottom as follows:
The highlighted clade, enclosed in a shaded rectangle, contains the four Taenia species. Within this group, T. asiatica and T. saginata form a sister pair at the tips; T. multiceps is their nearest relative; and T. solium occupies the most basal position, branching off before the other three diverge. Branch lengths within this clade are notably short relative to those separating the major groups. The scale bar represents 0.10 substitutions per site.
Immediately outside the highlighted rectangle, E. multilocularis and E. granulosus form a pair, sister to the Taenia clade. Further out, H. nana and H. diminuta form a separate pair. C. elegans and H. sapiens are the most distantly positioned taxa, at the base of the tree.
Reference table
| Species | Accession number | Database |
|---|---|---|
| T. asiatica | TASs00049g05486 | WormBase ParaSite |
| T. saginata | TSAs00053g06643 | WormBase ParaSite |
| T. multiceps | Tm1G000043 | WormBase ParaSite |
| T. solium | TsM_001199400 | WormBase ParaSite |
| E. multilocularis | EmuJ_000061200 | WormBase ParaSite |
| E. granulosus | EgrG_000703300 | WormBase ParaSite |
| H. nana | HNAJ_0000506001 | WormBase ParaSite |
| H. diminuta | WMSIL1_LOCUS7292. | WormBase ParaSite |
| C. elegans | BX284605.5 | GenBank |
| H. sapiens | NM_001101.5 | GenBank |
Multiple sequence alignment of the selected locus corresponding to the gene TsM_001199400 across representative Taenia species. Forward and reverse primer-binding regions are indicated. Polymorphic sites within the primer-targeted region are highlighted.

Figure 1(b) Long description
The alignment is presented in four consecutive horizontal blocks, spanning nucleotide positions 256 to 653. Each block contains four rows in the same order from top to bottom: T. solium, T. saginata, T. asiatica, and T. multiceps. Position numbers appear at the left and right margin of each block.
Color coding
The vast majority of positions carry a dark background, indicating shared nucleotides across all four species. A small number of positions in the T. solium row are rendered in a font of a different color, marking sites where T. solium differs from the other three species. The sequences of T. saginata, T. asiatica, and T. multiceps are visually uniform throughout, showing no highlighted differences relative to one another.
Block-by-block description
Block 1, positions 256 to 356: The highlighted T. solium positions appear near the left end of this block, spanning a short stretch of nucleotides at the start of the displayed region. The other three species show uninterrupted background color across this entire block.
Block 2, positions 357 to 456: The forward primer sequence is shown in highlighted text above the T. solium row, positioned over the left portion of this block. The primer sequence reads: TTGCCCACTCTGTCTCCTAAAGTTGCCATATT.
Block 3, positions 457 to 556: The reverse primer sequence is shown in highlighted text above the T. solium row, positioned toward the right portion of this block. The primer sequence reads: GCTATATAAGAGGTAAAGAATGGTGGAGGTTC.
Block 4, positions 557 to 653: No primer annotations are present. All four species show uniform dark background coloring throughout this block.
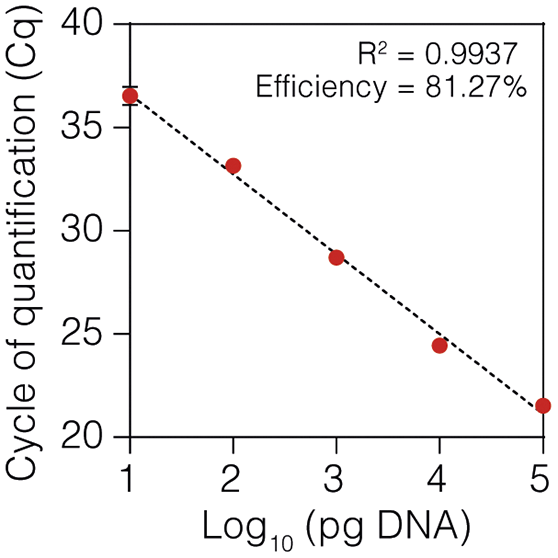
Standard curve generated from 10-fold serial dilutions of T. solium genomic DNA showing the relationship between quantification cycle (Cq) values and log-transformed DNA input. Amplification efficiency and coefficient of determination (R2) are indicated.

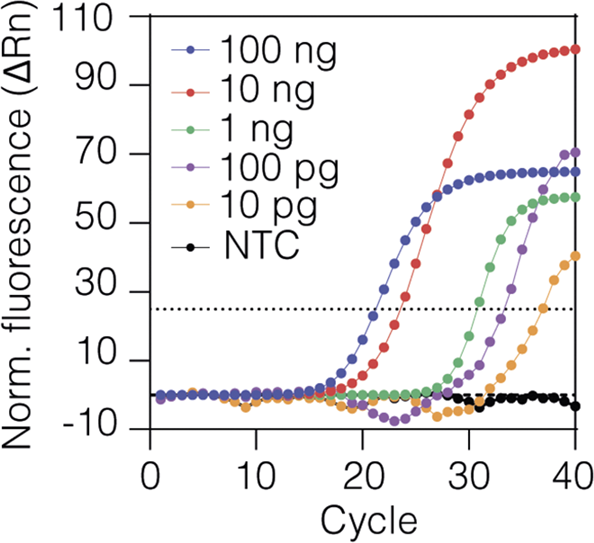
Representative qPCR amplification plots obtained from the dilution series shown in (c). DNA input concentrations are indicated. NTC, non-template control.

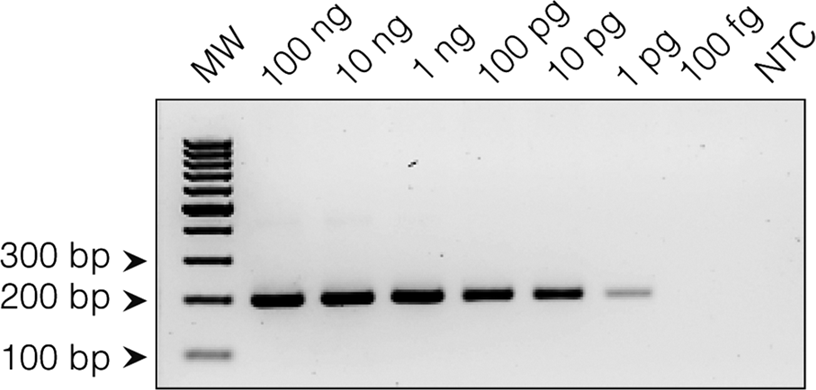
Agarose gel electrophoresis of qPCR products obtained from serial dilutions of T. solium genomic DNA. The expected 198-bp amplification product is shown for the indicated DNA inputs. MW, molecular weight marker.

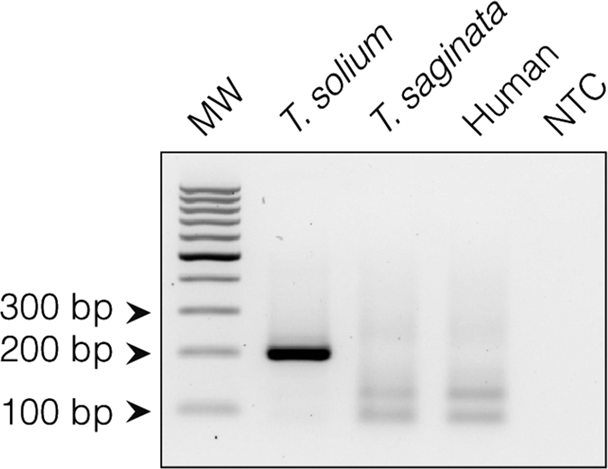
Agarose gel electrophoresis of qPCR products obtained using genomic DNA from T. solium, T. saginata, human DNA, and non-template controls (NTC). Band sizes are indicated in base pairs (bp).

Although actin genes are highly conserved across cestodes, alignment of homologous sequences from Taenia species revealed species-specific polymorphisms unique to T. solium within a region suitable for primer design (Figure 1b), supporting its selection as a candidate molecular target for species discrimination. Notably, mismatches were observed within the primer-binding regions in non-target species, including T. saginata and T. asiatica, while conservation was maintained in T. solium. These differences provide a molecular basis for species-specific amplification, consistent with previously described PCR-based approaches for Taenia species discrimination (Naqvi et al. Reference Naqvi2026; Ng-Nguyen et al. Reference Ng-Nguyen2017; Yamasaki et al. Reference Yamasaki2004).
The performance of the selected target was evaluated by quantitative PCR, showing a linear relationship between Cq values and input DNA concentration across serial dilutions of T. solium genomic DNA (Figure 1c). The assay demonstrated acceptable amplification efficiency (81.27%) and a strong correlation coefficient (R2 = 0.9937), indicating consistent performance across the tested range. Representative amplification profiles further confirmed reproducible detection across the dilution series (Figure 1d).
Analytical sensitivity assays showed consistent detection down to approximately 10 pg of input DNA, corresponding to ~70–80 genome equivalents (estimated as described in Methods), whereas amplification became faint at lower inputs (Figure 1e). These results indicate that the assay enables detection of T. solium DNA at low input levels under the conditions tested.
Analytical specificity was assessed using genomic DNA from T. saginata and human DNA. No amplification was observed in non-target samples under the same experimental conditions (Figure 1f), consistent with the mismatches identified in the primer-binding regions. The absence of amplification from human DNA further supports the suitability of this target for molecular detection approaches in complex biological samples.
While validated only in purified DNA, this study shows how a genome-guided approach can define species-specific targets by exploiting SNPs and subtle sequence divergence within conserved genes. The identified actin target supports the development of multiplexed qPCR and isothermal assays to critically distinguish T. solium, T. saginata, and T. asiatica in co-endemic regions. Validation with clinical samples and adaptation to alternative amplification platforms remain important next steps for strengthening diagnostic capacity in areas affected by neurocysticercosis.
Acknowledgements
The authors thank J. Calla (UNMSM, Peru) for useful discussions and the Laboratory of Developmental Neurobiology at UPCH for sharing equipment.
Financial support
CBP was supported by grant PE501089641-2024 from Peru’s Consejo Nacional de Ciencia, Tecnología e Innovación tecnológica, CONCYTEC, through its Programa Nacional de Investigación Científica y Estudios Avanzados, Prociencia (https://prociencia.gob.pe).
Competing interests
The authors declare none.
Ethical standards
The study protocol that included obtaining T. solium cysts from naturally infected pigs was reviewed and approved by the Animal Care and Use Committee (CIEA, in Spanish) at Universidad Peruana Cayetano Heredia (UPCH), which states details for the proper housing, feeding, and handling of animals used in research, including euthanasia. The CIEA is registered with the Office of Laboratory Animal Welfare of the Department of Health and Human Services of the National Institutes of Health (NIH – USA) with Assurance Number F16-00076 (A5146-01). The human saliva samples used in this study were provided voluntarily by the authors, without the involvement of other participants. The protocol was exempted from review by the Institutional Research Ethics Committee (CIEI, in Spanish) at UPCH, which is accredited by the National Institute of Health of Peru with indefinite validity.



 Open access

