1 Introduction
Internal solitary and solitary-like waves (ISW) are commonly observed in stratified fluids, such as lakes, estuaries and coastal oceans. These waves are typically generated in deep waters in the form of waves of depression and shoal into shallow waters as they propagate shoreward (Duda et al. Reference Duda, Lynch, Irish, Beardsley, Ramp, Chiu, Tang and Yang2004; Farmer et al. Reference Farmer, Alford, Lien, Yang, Chang and Li2011). As the waves shoal, they may either fission into a packet of waves of elevation over mild slopes (Orr & Mignerey Reference Orr and Mignerey2003; Shroyer, Moum & Nash Reference Shroyer, Moum and Nash2009) or break over steep slopes (Aghsaee, Boegman & Lamb Reference Aghsaee, Boegman and Lamb2010; Lamb Reference Lamb2013). While an ISW adjusts as it moves over the entire slope, the fissioning process occurs as the wave passes through the turning point, located where the pycnocline crosses the mid-depth of the water column (assuming there is no background shear current). During this process, the back of the wave steepens, producing a packet of dispersive waves. Eventually, one or more solitary waves of elevation may emerge from this wave packet. The fissioning is expected to extend over a considerable geographical area. For example, Shroyer et al. (Reference Shroyer, Moum and Nash2009) observed the fissioning process on the New Jersey shelf over a transect running approximately 35 km.
The ISW interact with the bottom boundary and induce bottom stress as they propagate. This can lead to the onset of instability and provide potential for significant mixing and transport across the bottom boundary layer (BBL) (Boegman & Stastna Reference Boegman and Stastna2019). Over a flat no-slip bottom boundary, there exist several instability mechanisms, depending on the polarity of the wave and the presence of a background current. Both waves of depression and elevation induce an adverse pressure gradient in the BBL. For waves of depression, this occurs beneath the trailing edge of the wave, and results in a jet along the BBL oriented against the direction of wave-induced current. For large enough waves, or an appropriate background shear current, the separation bubble undergoes a complex instability (Diamessis & Redekopp Reference Diamessis and Redekopp2006), with recent results suggesting that it is inherently three-dimensional in at least some cases (P. Diamessis, personal communication). Wave shoaling enhances the instability by focusing wave energy and inducing stronger, more concentrated near-bottom currents (Aghsaee et al. Reference Aghsaee, Boegman, Diamessis and Lamb2012). For waves of elevation, the adverse pressure gradient occurs over the front half of the wave, and instability is observed when a background current oriented against the direction of wave propagation is present (Stastna & Lamb Reference Stastna and Lamb2008). The presence of such a background current is a necessary condition for the onset of instability (Carr & Davies Reference Carr and Davies2010).
While wave shoaling has been studied by a number of authors, the majority of past work adopted relatively steep slopes (e.g. Sutherland, Barrett & Ivey Reference Sutherland, Barrett and Ivey2013; Arthur & Fringer Reference Arthur and Fringer2014), which are suitable for studying and classifying wave breaking but do not afford the spatial and temporal extent necessary to study the fissioning process. In the present work, we focus on wave shoaling over a gentle slope that is relevant to a broad cross-section of field situations (see Boegman & Stastna (Reference Boegman and Stastna2019) for a more complete discussion). Using high-resolution direct numerical simulations performed in a rectangular domain representing a tilted tank, we show that it is possible for separation bubbles to form beneath shoaling ISW of elevation following a fissioning process, even when there is no background current present. This results in strong cross-boundary-layer transport, making the fissioning process as efficient in this respect as wave breaking over steeper slopes. The remainder of this paper is organized as follows. The model set-up, governing equations and numerical method will be presented in § 2. The simulation results will be discussed in § 3, where effects of Reynolds number variation will also be addressed. Finally, findings of this work will be concluded in § 4.
2 Problem formulation
2.1 Model set-up
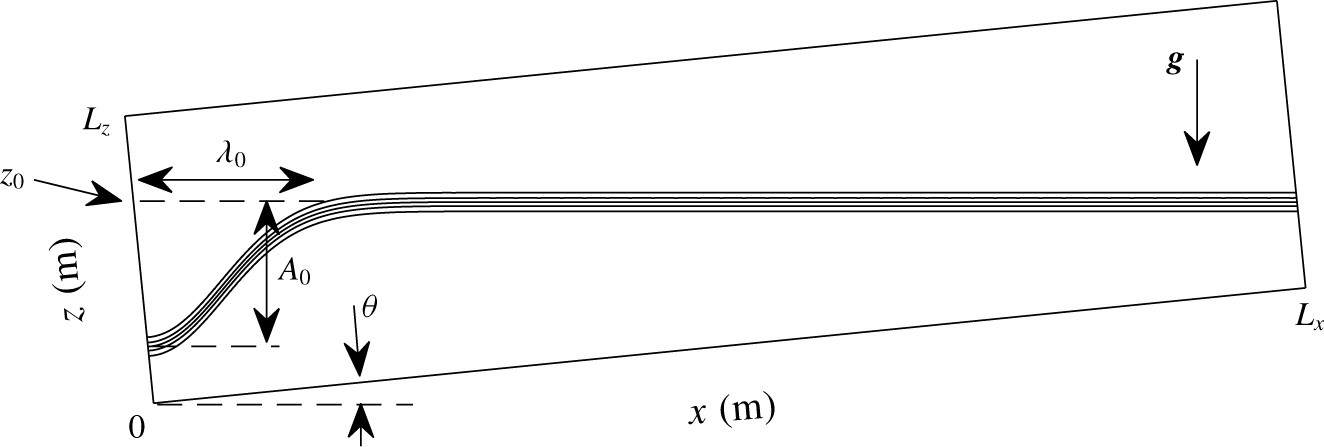
Schematic diagram of the initial density field in a tilted tank. Note that in the simulations  $L_{x}\gg L_{z}$.

A schematic diagram of the model set-up is given in figure 1. The numerical simulations are performed in a rectangular tank gently tilted so the rightward end is elevated. The length and depth of the tank are labelled as  $L_{x}$ and
 $L_{z}$, respectively. The angle between the bottom of the tank and the horizontal plane is denoted by
 $\unicode[STIX]{x1D703}$, while the slope of the bottom boundary is given by
 $$\begin{eqnarray}s=\tan \unicode[STIX]{x1D703}.\end{eqnarray}$$
Following this set-up, the  $x$-axis is directed to the right along the tilted bottom boundary, and the
 $z$-axis points up along the left boundary. The tank has a rigid lid and is completely filled with fluid, so that no free surface is present.
We focus on flows in a quasi-two-layer stratification with a dimensionless density difference denoted by  $\unicode[STIX]{x0394}\unicode[STIX]{x1D70C}$, which is small enough for the Boussinesq approximation to be safely adopted. The initial density profile, non-dimensionalized by the reference density
 $\unicode[STIX]{x1D70C}_{0}=1000~\text{kg}~\text{m}^{-3}$, is given by
 $$\begin{eqnarray}\unicode[STIX]{x1D70C}(x,z)=1-0.5\unicode[STIX]{x0394}\unicode[STIX]{x1D70C}\tanh \left\{\frac{z-z_{0}+sx+A_{0}\exp [-(x/\unicode[STIX]{x1D706}_{0})^{2}]}{d}\right\},\end{eqnarray}$$
where  $z_{0}$ is the height of the undisturbed pycnocline at the left boundary,
 $A_{0}$ is the amplitude of the initial depression of the pycnocline at the left boundary,
 $\unicode[STIX]{x1D706}_{0}$ is the length of initial depression and
 $d$ is the half-width of the pycnocline. In all simulations, the initial velocity field is identically zero.
We emphasize that, throughout a particular experiment, the tank does not change its tilted position (as it would for an internal seiche generation experiment) so that the background state is constant. Thus, waves generated near the left boundary will shoal into shallow waters as they propagate to the right. The tilt of the upper surface means that the present set-up differs from the oceanic situation in which the upper surface (to the extent the rigid lid applies) is horizontal. However, since the evolution of the shoaling wave is controlled by the bottom boundary, which is closer to the pycnocline in the fissioning region, we believe the tilted tank is a reasonable approximation.
2.2 Governing equations
The governing equations for our time-dependent simulations are the incompressible Navier–Stokes equations under the Boussinesq and rigid-lid approximations (Kundu, Cohen & Dowling Reference Kundu, Cohen and Dowling2012), given in the tilted Cartesian coordinate system by
 $$\begin{eqnarray}\displaystyle & \displaystyle \frac{\text{D}\boldsymbol{u}}{\text{D}t}=-\unicode[STIX]{x1D6FB}p-\unicode[STIX]{x1D70C}\boldsymbol{g}+\unicode[STIX]{x1D708}\unicode[STIX]{x1D6FB}^{2}\boldsymbol{u}, & \displaystyle\end{eqnarray}$$
 $$\begin{eqnarray}\displaystyle & \displaystyle \unicode[STIX]{x1D735}\boldsymbol{\cdot }\boldsymbol{u}=0, & \displaystyle\end{eqnarray}$$
 $$\begin{eqnarray}\displaystyle & \displaystyle \frac{\text{D}\unicode[STIX]{x1D70C}}{\text{D}t}=\unicode[STIX]{x1D705}\unicode[STIX]{x1D6FB}^{2}\unicode[STIX]{x1D70C}, & \displaystyle\end{eqnarray}$$
 $\boldsymbol{u}$ is the velocity field,
 $\unicode[STIX]{x1D70C}$ is the density field,
 $p$ is the pressure field,
 $\boldsymbol{g}$ is the acceleration due to gravity,
 $\unicode[STIX]{x1D708}$ is the kinematic viscosity and
 $\unicode[STIX]{x1D705}$ is the molecular diffusivity. In particular,
 $\boldsymbol{u}=(u,w)$, where
 $u$ and
 $w$ are the components tangential and normal to the bottom boundary, respectively. They will be referred to as the ‘along-tank velocity’ and ‘normal velocity’, respectively, in the remainder of this paper. The gravitational acceleration in the tilted coordinate system is defined by
 $$\begin{eqnarray}\boldsymbol{g}=-g(\sin \unicode[STIX]{x1D703},\cos \unicode[STIX]{x1D703}).\end{eqnarray}$$
As is common practice under the Boussinesq approximation, equations (2.3) are in dimensional form, except that the density  $\unicode[STIX]{x1D70C}$ and pressure
 $p$ are scaled by the reference density
 $\unicode[STIX]{x1D70C}_{0}$. Free-slip boundary conditions are applied at the left and right boundaries, while no-slip boundary conditions are applied at the top and bottom boundaries. The effect of the Earth’s rotation is neglected.
We note that variables in (2.3) are related to their counterparts in the regular, untilted Cartesian coordinate system through the rotation matrix
 $$\begin{eqnarray}\unicode[STIX]{x1D64D}(\unicode[STIX]{x1D703})=\left[\begin{array}{@{}cc@{}}\cos \unicode[STIX]{x1D703} & -\sin \unicode[STIX]{x1D703}\\ \sin \unicode[STIX]{x1D703} & \cos \unicode[STIX]{x1D703}\\ \end{array}\right].\end{eqnarray}$$
Let tilde ( $\,\tilde{\,}\,$) denote variables in the untilted coordinate system. The horizontal displacement
 $\tilde{x}$ and vertical displacement
 $\tilde{z}$ can be computed as
 $$\begin{eqnarray}(\tilde{x},\tilde{z})^{\text{T}}=\unicode[STIX]{x1D64D}(x,z)^{\text{T}},\end{eqnarray}$$
while the horizontal velocity  $\tilde{u}$ and vertical velocity
 $\tilde{w}$ can be computed as
 $$\begin{eqnarray}(\tilde{u} ,\tilde{w})^{\text{T}}=\unicode[STIX]{x1D64D}(u,w)^{\text{T}}.\end{eqnarray}$$
In the remainder of this paper, all figures are presented in the untilted coordinate system. When the angle  $\unicode[STIX]{x1D703}$ is small,
 $\sin \unicode[STIX]{x1D703}\ll \cos \unicode[STIX]{x1D703}$ such that
 $(\tilde{u} ,\tilde{w})\approx (u,w)$.
2.3 Numerical method
Numerical simulations presented in this paper were performed using the numerical model described and validated in Subich, Lamb & Stastna (Reference Subich, Lamb and Stastna2013). The model employs a spectral collocation method (Trefethen Reference Trefethen2000), which yields highly accurate results. By maintaining a rectangular configuration of the entire domain, as opposed to an explicit slope region with a flat upper boundary, the scaling of the model with number of processors is nearly linear (Subich et al. Reference Subich, Lamb and Stastna2013), and allows for efficient computation even for large grid sizes. As appropriate for the boundary conditions, the Fourier sine or cosine transform is used in the along-tank direction, depending on the variable of interest, while the Chebyshev discretization is used in the direction normal to the top and bottom boundaries. The Chebyshev discretization naturally clusters grid points near the top and bottom boundaries, so that instabilities developed near the bottom boundary can be well resolved. The model employs an adaptive third-order multi-step method, where viscous and diffusive terms are solved implicitly, and pressure is computed via operator splitting.
3 Simulation results
3.1 Parameter space
List of simulations and their parameters. Here,  $c_{lw}$ is the two-layer, linear long-wave speed,
 $Re$ is Reynolds number,
 $N_{x}$ and
 $N_{z}$ are the grid sizes in
 $x$ and
 $z$-directions,
 $\unicode[STIX]{x0394}\,x$ and
 $\max (\unicode[STIX]{x0394}z)$ are the horizontal and maximum vertical grid spacings,
 $\unicode[STIX]{x1D6FF}$ is Stokes boundary-layer thickness and
 $N_{bbl}$ is the number of vertical grid points within the BBL.

Numerical simulations presented in this paper are listed in table 1. For all simulations, the length and depth of the model domain are set to be  $L_{x}=20~\text{m}$ and
 $L_{z}=0.5~\text{m}$, respectively. While these dimensions are perhaps beyond the limit of a reasonable laboratory setting, they do allow us to study the entire fissioning process over a gentle slope with
 $s=0.02$. To ensure that the undisturbed pycnocline intersects the left (right) boundary above (below) the mid-depth, we let
 $z_{0}=0.45~\text{m}$, so that the initial wave of depression will always experience a fissioning process as it shoals. Additional parameters for the initial density profile given in (2.2) are set to be
 $d=0.01~\text{m}$,
 $A_{0}=0.3~\text{m}$ and
 $\unicode[STIX]{x1D706}_{0}=0.35~\text{m}$, in order to ensure that the initial depression in the density profile is able to evolve into a solitary-like wave well before it reaches the turning point, and that once a solitary-like wave forms, there is no wave trailing behind it.
The Reynolds number in table 1 is defined by
 $$\begin{eqnarray}Re=\frac{c_{lw}A_{0}}{\unicode[STIX]{x1D708}},\end{eqnarray}$$
where  $c_{lw}$ is the two-layer, linear long-wave speed, defined by
 $$\begin{eqnarray}c_{lw}=\sqrt{\unicode[STIX]{x0394}\unicode[STIX]{x1D70C}g\frac{h_{1}h_{2}}{h_{1}+h_{2}}},\end{eqnarray}$$
where  $h_{1}$ and
 $h_{2}$ are the upper and lower layer thicknesses. As a rough estimate, we let
 $$\begin{eqnarray}h_{1}=0.5(z_{0}+0.5L_{z})=0.35\text{ (m)}\quad \text{and}\quad h_{2}=L_{z}-h_{1}=0.15\text{ (m)}\end{eqnarray}$$
for the present model set-up, though the actual layer thicknesses vary throughout the entire domain. While Reynolds numbers reported in table 1 are on the laboratory scale, effects of Reynolds number variation will be addressed in § 3.3 in order to provide some insights on how results of our simulations might scale up to the field scale. To ensure that small-scale flow structures are properly resolved, we employ high resolution and adjust the grid sizes based on the Reynolds number. Also in table 1, the Stokes boundary-layer thickness is defined following Arthur & Fringer (Reference Arthur and Fringer2014) by
 $$\begin{eqnarray}\unicode[STIX]{x1D6FF}=2\sqrt{\frac{\unicode[STIX]{x1D708}\unicode[STIX]{x1D706}_{0}}{c_{lw}}}.\end{eqnarray}$$
We note that in the vertical direction, the Chebyshev discretization naturally clusters grid points near the bottom boundary, so that the BBL is well resolved. For all simulations, the Schmidt number, defined by
 $$\begin{eqnarray}Sc=\frac{\unicode[STIX]{x1D708}}{\unicode[STIX]{x1D705}},\end{eqnarray}$$
is fixed at  $Sc=5$ by setting the diffusivity
 $\unicode[STIX]{x1D705}$ according to the viscosity
 $\unicode[STIX]{x1D708}$. The Iribarren number, defined by
 $$\begin{eqnarray}Ir=\frac{s}{\sqrt{A_{0}/\unicode[STIX]{x1D706}_{0}}},\end{eqnarray}$$
is approximately 0.02. While this value only provides a rough estimate as the wave properties change throughout the shoaling process, it is at least one order of magnitude smaller than the typical Iribarren number associated with breaking internal waves.
3.2 Base case
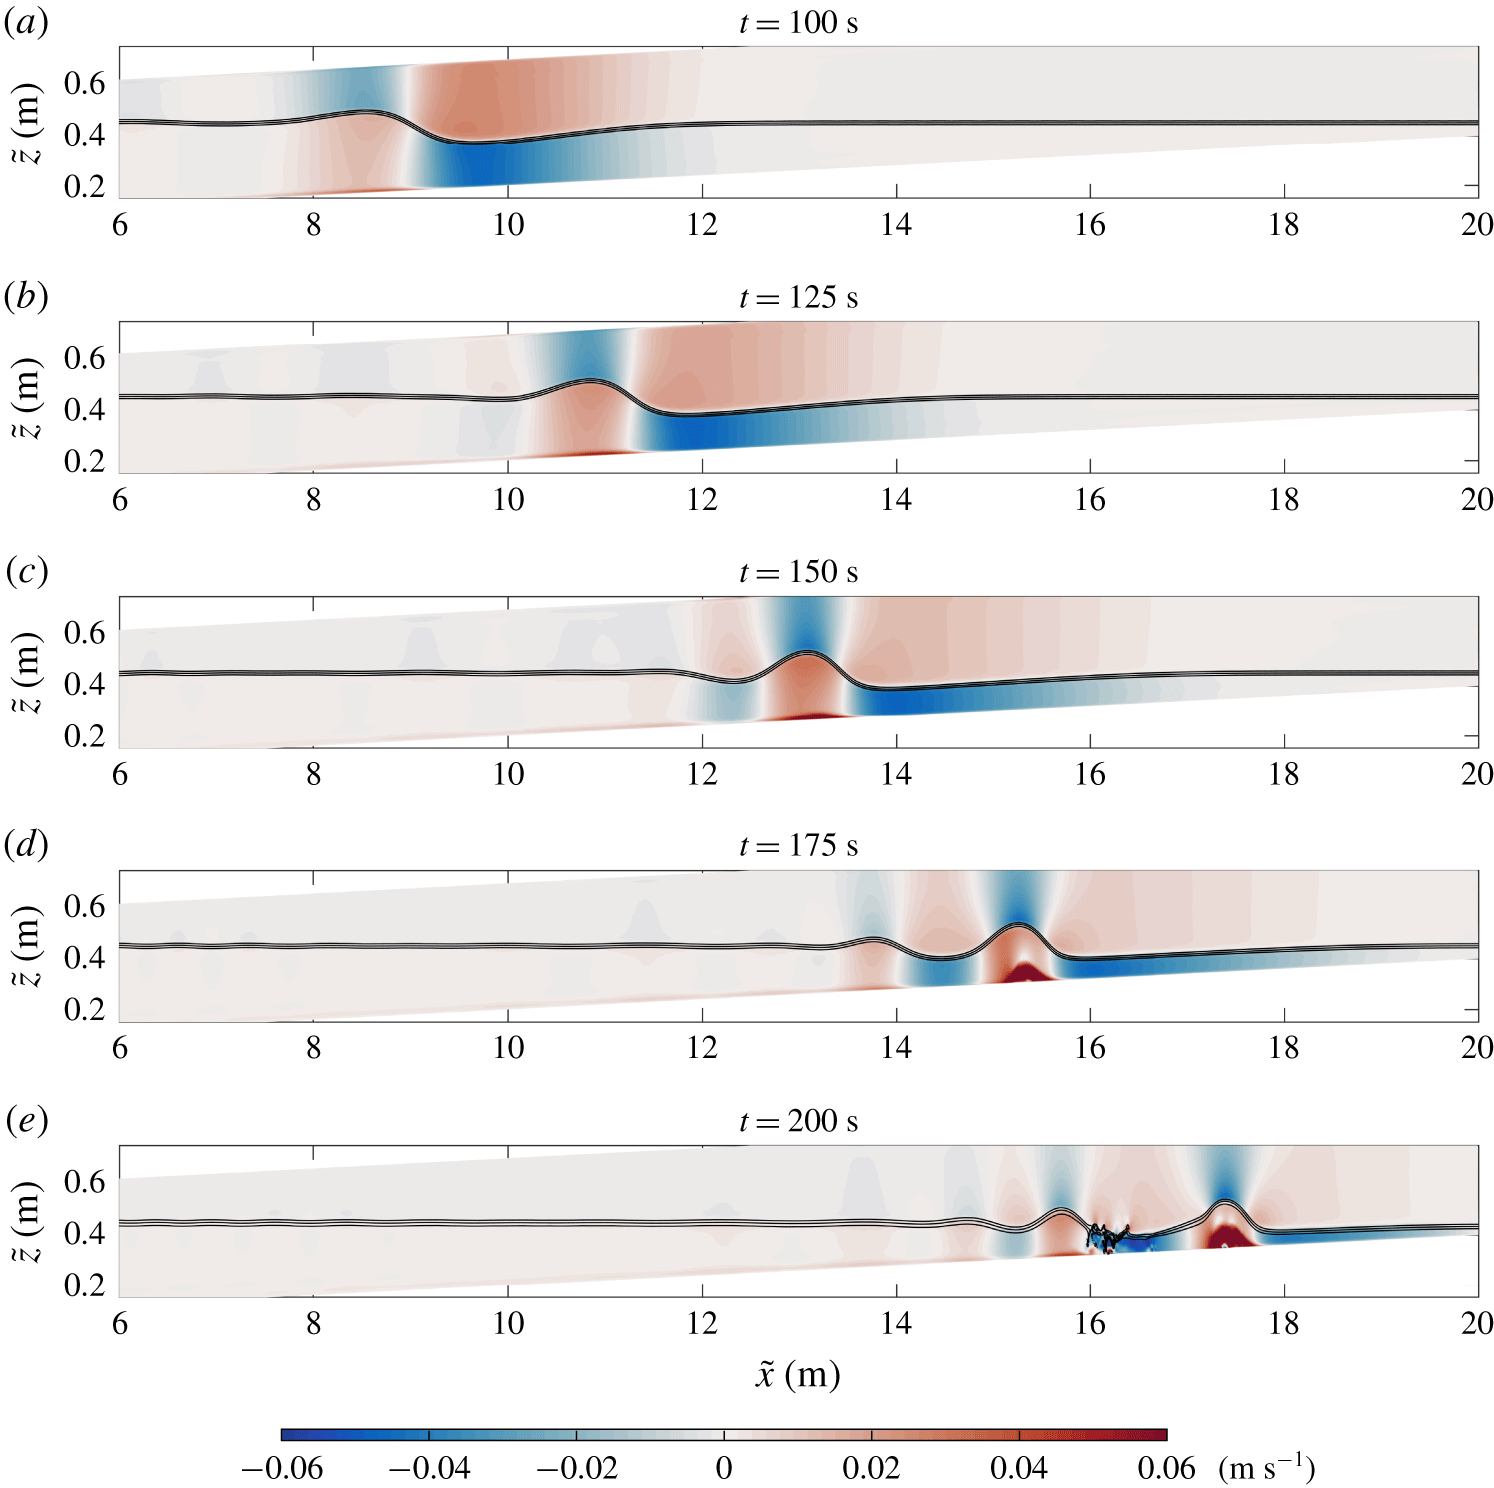
Shaded contour plots of the along-tank velocity  $u$ for the ‘Base’ case from
 $t=100~\text{s}$ to
 $200~\text{s}$, showing the fissioning process of the wave and the formation of the separation bubble. Solid contours indicate the location of the pycnocline. Note that the axes are not to scale and that the maximum along-tank velocity observed at
 $t=200~\text{s}$ is
 $0.163~\text{m}~\text{s}^{-1}$.

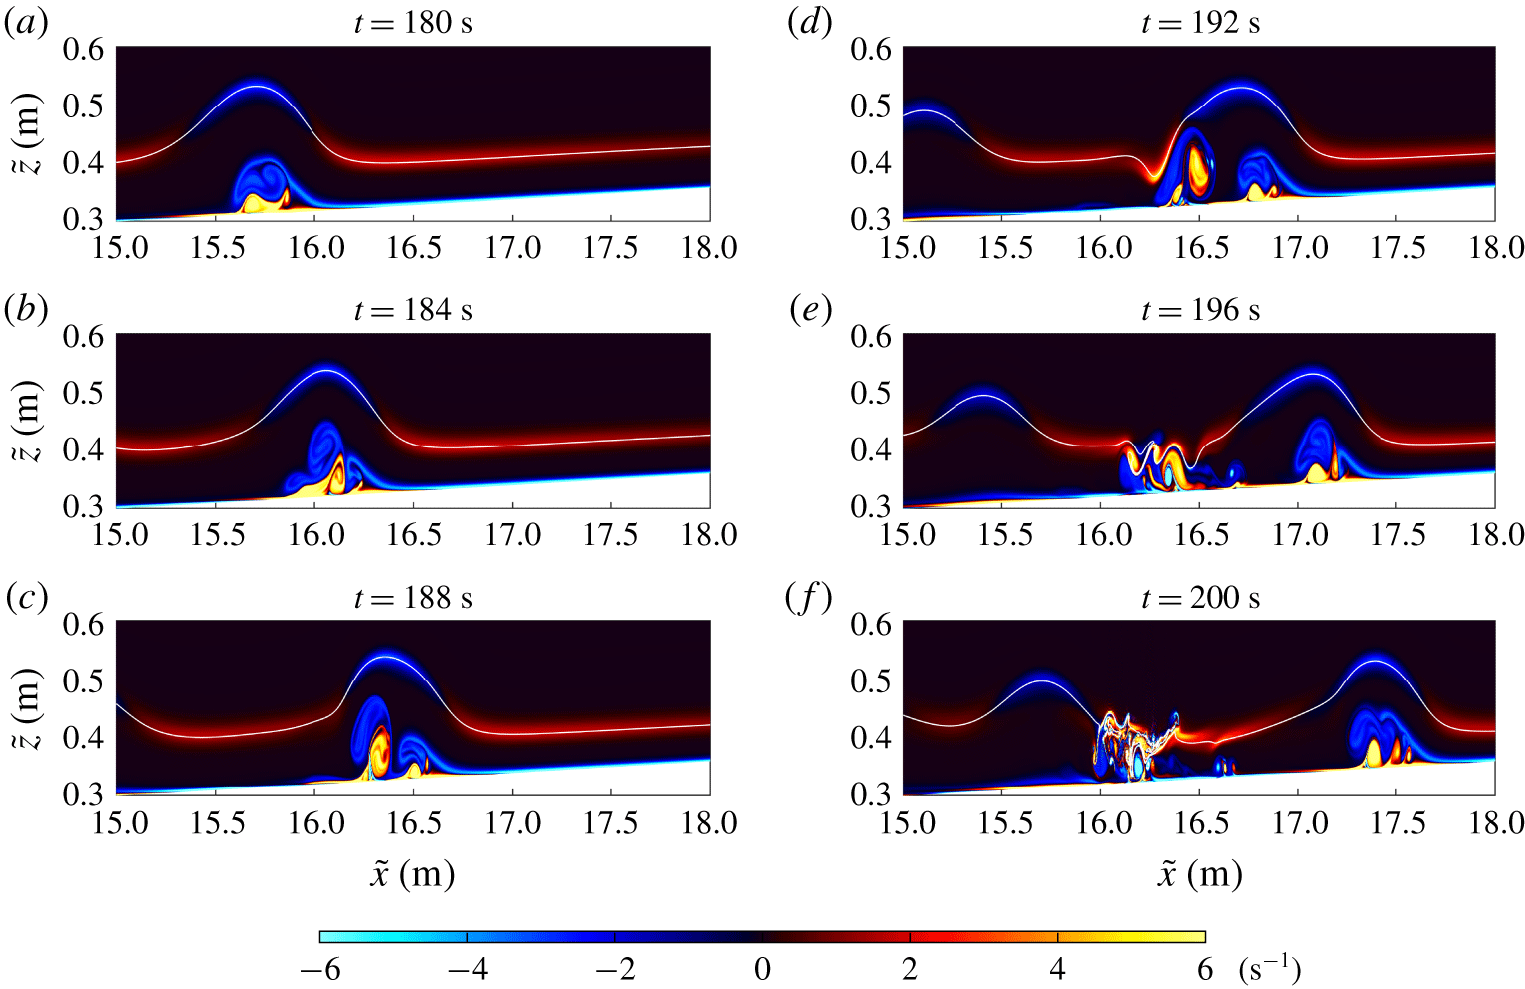
Shaded contour plots of the vorticity field  $(\unicode[STIX]{x2202}u/\unicode[STIX]{x2202}z-\unicode[STIX]{x2202}w/\unicode[STIX]{x2202}x)$ for the ‘Base’ case from
 $t=180~\text{s}$ to
 $200~\text{s}$, showing the development and breakdown of the separation bubble. Solid contours indicate the location of the pycnocline.

We shall first discuss the simulation labelled as ‘Base’ in table 1. The simulation starts as an ISW of depression is generated from the initial depression of the pycnocline near the left boundary of the domain, in a process similar to the lock-release mechanism adopted in a typical laboratory setting (e.g. Carr et al. Reference Carr, Franklin, King, Davies, Grue and Dritschel2017). As the wave propagates to the right, it reaches the turning point where the pycnocline approaches the mid-depth of the domain. Beyond this point, a fissioning process occurs, where the initial wave of depression evolves into a packet of dispersive waves from which several solitary waves of elevation emerge. This process is visualized in figure 2.
The fissioning process typically occurs when the bottom slope is very gentle (usually less than or equal to 0.05) such that nonlinear steepening is insufficient to cause wave overturning (Aghsaee et al. Reference Aghsaee, Boegman and Lamb2010). For this reason, it is generally believed that the fissioning process does not give rise to significant turbulent mixing and hence does not contribute to cross-boundary-layer transport. Nevertheless, this is not the case in our simulation, as boundary-layer instability in the form of a separation bubble can be clearly observed in figure 2. The separation bubble is evident in all panels and can thus be thought of as originating in the lee of the leading wave of depression as it steepens at the back during shoaling. By  $t=150~\text{s}$ (panel c), the leading wave of depression is quite small in amplitude and extremely broad. Thus, the developing wave of elevation can be interpreted as the primary wave, and the separation bubble can be seen to fill the footprint of this wave and propagate with the wave. Indeed, as the wave of elevation decreases in length in panels (d) and (e), the separation bubble can be seen to shorten as well and begin to roll up. The secondary wave appears to develop its own separation bubble, though this is only clear in panel (e), due to the clear alternation of red and blue regions in the BBL region.
Details of the development and breakdown of the separation bubble can be visualized from the vorticity plots shown in figure 3. The figure suggests that vorticity associated with the jet near the bottom boundary induces strong vorticity above the BBL and leads to roll-up of the vorticity in the wave footprint. As the wave propagates and shoals, the separation bubble develops gradually and eventually breaks down into two parts. One of them is trapped beneath the wave and keeps propagating with it, while the other is shed behind the leading wave and interacts with the trailing waves.
It has been shown in past literature that a necessary condition for the formation of a separation bubble in a wave of elevation is the presence of a background current oriented against the direction of wave propagation (see, e.g. figure 6 of Boegman & Stastna Reference Boegman and Stastna2019). In our simulation, while the amplitude of the leading wave of depression diminishes after the fissioning process, the current induced by it persists, meaning that its wave energy is not fully transferred into the packet of trailing waves of elevation. Thus, even after the fissioning process, the leading wave of depression is able to induce an adverse pressure and a current oriented against the direction of wave propagation. This current essentially plays the role of a background current and triggers the boundary-layer instability upon interaction with the leading wave of elevation. We note that the point of view of treating leading, long waves as setting a background state for trailing waves was used successfully in Lamb & Warn-Varnas (Reference Lamb and Warn-Varnas2015) to study the shoaling of ISW over complex bathymetry in the South China Sea.
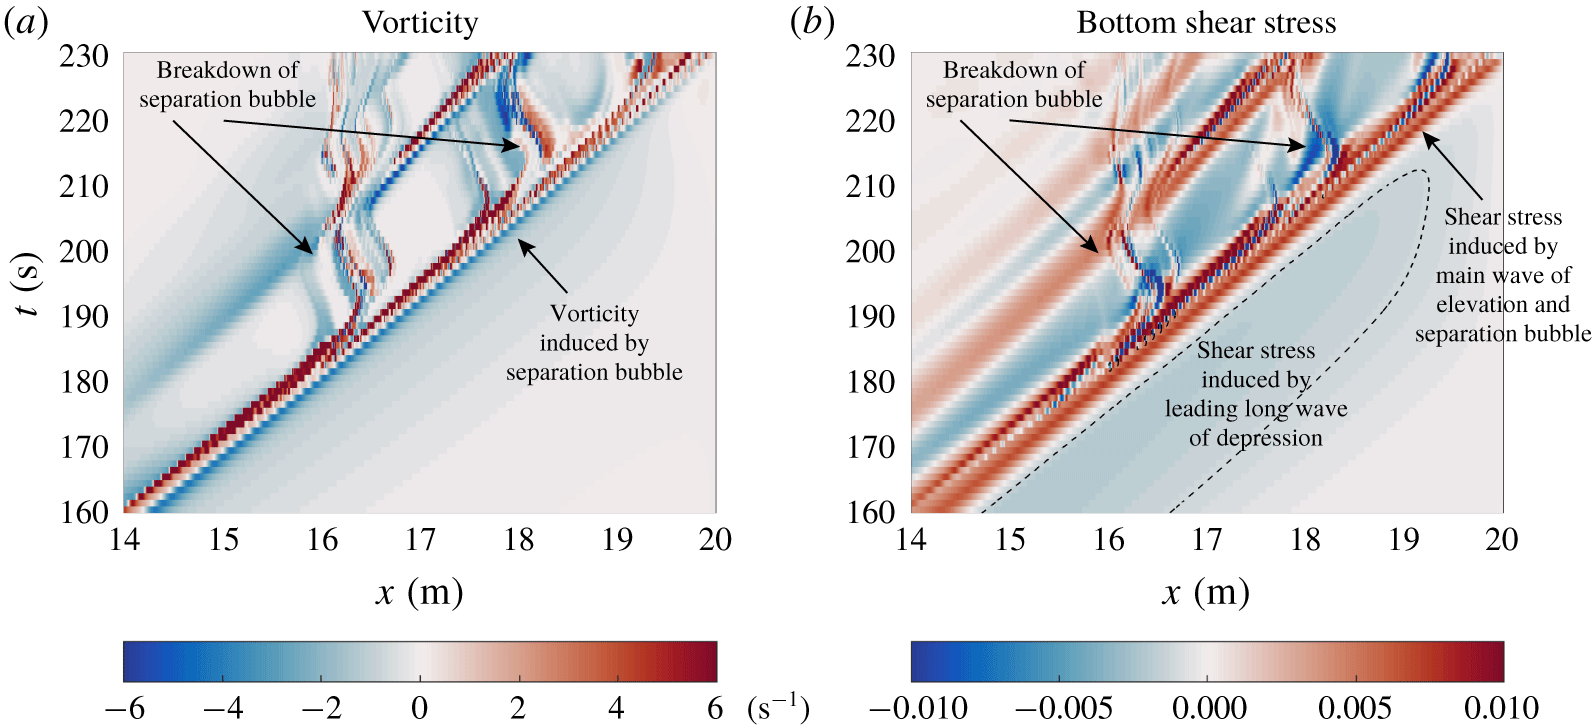
Hovmöller plots of (a) vorticity  $(\unicode[STIX]{x2202}u/\unicode[STIX]{x2202}z-\unicode[STIX]{x2202}w/\unicode[STIX]{x2202}x)$ in a layer 0.01 m above the bottom boundary and (b) bottom shear stress
 $\unicode[STIX]{x1D70F}$, for the ‘Base’ case from
 $t=160~\text{s}$ to 230 s.

To examine the details of the boundary-layer dynamics induced by the evolution of the separation bubble, we calculate (a) the vorticity in a layer 0.01 m above the bottom boundary and (b) the shear stress along the flat bottom boundary  $z=0$. The latter, when scaled by the dynamic estimate
 $0.5\unicode[STIX]{x1D70C}_{0}c_{lw}^{2}$, is defined as
 $$\begin{eqnarray}\unicode[STIX]{x1D70F}(x)=\frac{2\unicode[STIX]{x1D708}}{c_{lw}^{2}}\frac{\unicode[STIX]{x2202}u}{\unicode[STIX]{x2202}z}.\end{eqnarray}$$
The results are shown as Hovmöller plots for the late stage of the fissioning process in figure 4. We note that the grainy nature of these and similar plots is not due to a reduced resolution in either space or time, but due to the fact that the numerical model only saves the full fields with a fixed frequency. In this figure, the strong near-bottom vorticity and bottom shear stress in the diagonal direction is associated with the passage of the main wave of elevation, in which the separation bubble develops near the BBL as the wave propagates. The two breakdown events of the separation bubble can be clearly seen, as indicated in the figure. Behind the main wave of elevation, vorticity and bottom shear stress due to the separation bubble are both as strong as those due to the wave itself. These observations imply that the development and breakdown of the separation bubble can provide an effective mechanism for significant cross-boundary-layer transport and possibly sediment resuspension (though this last point requires a proper accounting for the sediment).
We note that while simulation with free-slip bottom boundary conditions has also been performed (not shown here), the formation of a separation bubble is not observed. This means that when simulating the fissioning process, the presence of a no-slip bottom boundary is a necessary condition for both the onset of boundary-layer instability and any eventual overturning that results from it.
3.3 Reynolds number variation
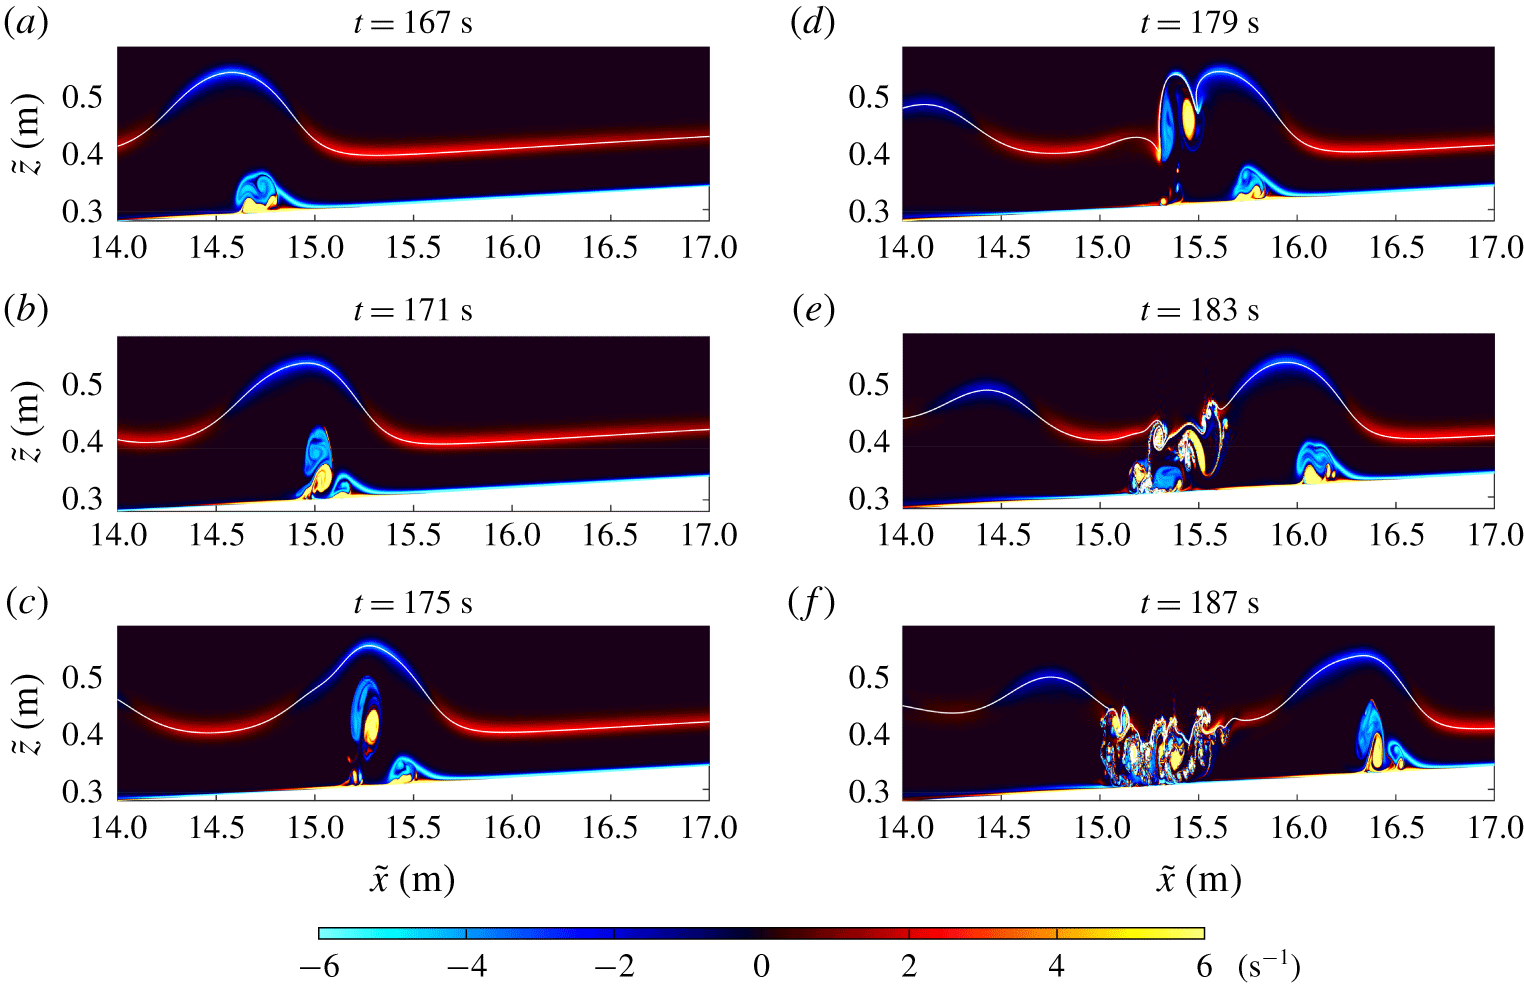
Same as figure 3 but for the ‘Low  $\unicode[STIX]{x1D708}$’ case from
 $t=167~\text{s}$ to
 $187~\text{s}$. The Reynolds number of this case is doubled from that of the ‘Base’ case.

To test the effect of a varying Reynolds number, we performed three additional experiments (only the results for one are shown). In the ‘Low  $\unicode[STIX]{x1D708}$’ case, we increase the Reynolds number by decreasing the viscosity
 $\unicode[STIX]{x1D708}$, whereas in the ‘Faster’ case, we increase the Reynolds number by increasing the density difference
 $\unicode[STIX]{x0394}\unicode[STIX]{x1D70C}$, which then leads to an increase in the velocity scale
 $c_{lw}$. In the ‘Half
 $Re$’ case, we halve the Reynolds number by doubling the viscosity
 $\unicode[STIX]{x1D708}$.
For the ‘Low  $\unicode[STIX]{x1D708}$’ case, the early stage of the fissioning process is not shown as the leading wave of depression and main wave of elevation behave similarly to those of the base case. In the late stage when the boundary-layer interaction occurs, however, the separation bubble develops faster and breaks down earlier, as suggested by figure 5. Comparison of figures 3 and 5 suggests that strength of the vorticity induced by the boundary-layer instability increases as the Reynolds number increases. Consequently, the overall flow is more likely to be turbulent, and the cross-boundary-layer transport also occurs earlier and tends to be stronger. A small separation bubble can be seen in the footprint of the second wave of elevation in panel (f). It is clear that in the higher Reynolds number case the dynamics of this separation bubble will be swamped by the vorticity associated with material ejected from the leading wave.
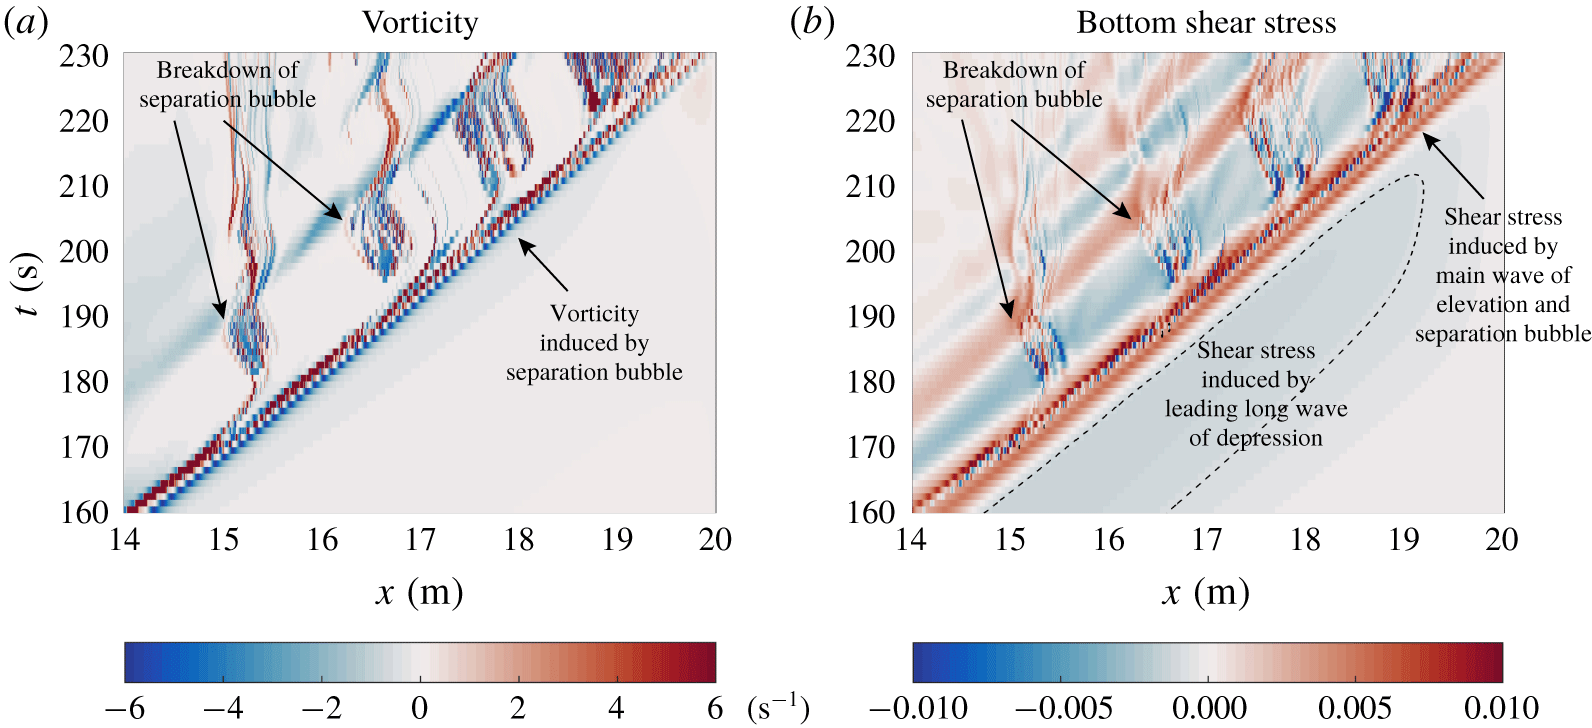
Same as figure 4 but for the ‘Low  $\unicode[STIX]{x1D708}$’ case from
 $t=160~\text{s}$ to 230 s.

Figure 6 shows that a higher Reynolds number leads to stronger near-bottom vorticity and bottom shear stress. In particular, four breakdown events of the separation bubble can be seen before the main wave of elevation reaches the end of the tank, whereas in the base case only two are visible.
The ‘Faster’ case is not shown here as the overall flow behaves very similar to that in the ‘Low  $\unicode[STIX]{x1D708}$’ case, except that the characteristic velocity scale is twice as large as that in the ‘Low
 $\unicode[STIX]{x1D708}$’ case. This means that the observed effect of a higher Reynolds number, namely a stronger cross-BBL transport, is robust. With a much higher Reynolds number on the field scale, the implication is that fissioning over gentle slopes provides a means for turbulent mixing and cross-BBL transport that is comparable in efficiency when compared to wave breaking over steeper slopes.
We have also performed another simulation, labelled as ‘Half  $Re$’ in table 1, to examine the effect when the Reynolds number is reduced from the base case. Although the results are not shown here, the primary observation is that the separation bubble is confined within the main wave of elevation until it reaches the right boundary, and that the breakdown of separation bubble does not occur throughout the shoaling process.
4 Conclusion and discussion
In this paper, we presented results of high-resolution direct numerical simulations of ISW shoaling onto a gentle slope. The initial wave of depression undergoes a fissioning process, yielding a packet of waves of elevation. Following the fissioning process, a separation bubble develops beneath the main wave of elevation and breaks down, leading to significant cross-BBL transport. The results are robust with a higher Reynolds number, implying that these results may be extrapolated to the field scale, and that the particular instability identified here provides a means by which the fissioning process is as effective as other wave-breaking mechanisms for cross-BBL transport.
The fissioning process can be described by a variable coefficient Gardner equation (Helfrich & Melville Reference Helfrich and Melville2006), for which the leading nonlinearity coefficient vanishes at the turning point, while the second nonlinearity coefficient remains nearly constant. For this reason, the fissioning is expected to extend over a considerable geographical area: of the order of kilometres in the coastal ocean (Shroyer et al. Reference Shroyer, Moum and Nash2009).
Future work should explore even gentler slopes, which may not be realizable in the laboratory but are relevant to the field (Boegman & Stastna Reference Boegman and Stastna2019), and investigate how the details of the bathymetry in the ocean would modify the fissioning process. However, by far the most important issue to address is how three-dimensional effects will modify the evolution of the separation bubble. In particular, is the roll-up of the separation bubble only observable in two-dimensional simulations?
Acknowledgements
C.X. acknowledges the support from the Government of Ontario through a Queen Elizabeth II Graduate Scholarship in Science and Technology. M.S. acknowledges the support from Natural Sciences and Engineering Research Council of Canada through Discovery Grant no. RGPIN-311844-37157. Time-dependent simulations were completed on the high-performance computing cluster provided by Compute Canada (www.computecanada.ca). The authors thank the three anonymous referees for their constructive comments and concrete suggestions that led to significant improvements of this work.
Declaration of interests
The authors report no conflict of interest.