





Introduction
Primary health care (PHC), encompassing general practice and family medicine, forms a fundamental part of the health system. By providing first-contact, continuous, coordinated and preventive care, PHC plays a central role in chronic disease management and population health improvement (Macinko et al., Reference Macinko, Starfield and Shi2003; Starfield et al., Reference Starfield, Shi and Macinko2005; World Health Organization, 2018; World Health Organization, United Nations Childrens Fund, 2020). Given its broad population coverage, longitudinal nature and growing demand for efficient service delivery, PHC has become an important setting for the exploration and application of artificial intelligence (AI).
In recent years, AI research and applications in PHC have expanded rapidly, covering risk stratification, disease screening, diagnostic support, clinical decision support, and workflow optimization (Katonai et al., Reference Katonai, Arvai and Mesko2025; Kueper et al., Reference Kueper, Terry, Zwarenstein and Lizotte2020; Rahimi et al., Reference Abbasgholizadeh Rahimi, Légaré, Sharma, Archambault, Zomahoun, Chandavong, Rheault, T Wong, Langlois, Couturier, Salmeron, Gagnon and Légaré2021). These developments suggest that AI may strengthen PHC service capacity, improve the efficiency of clinical decision-making, and support healthcare professionals in addressing increasingly complex care needs (Lin et al., Reference Lin, Mahoney and Sinsky2019; Topol, Reference Topol2019).
However, translating AI from research settings into routine PHC practice remains challenging (He et al., Reference He, Baxter, Xu, Xu, Zhou and Zhang2019; Liyanage et al., Reference Liyanage, Liaw, Jonnagaddala, Schreiber, Kuziemsky, Terry and de Lusignan2019). Much of the current literature focuses on model development and performance assessment, whereas successful clinical adoption also requires evidence of external validity, integration into existing workflows, interpretability, and readiness for standardized implementation. Fairness, data privacy, accountability, and governance have also emerged as important barriers to the safe and sustainable use of AI in healthcare (Jung et al., Reference Jung, Kashyap, Avati, Harman, Shaw, Li, Smith, Shum, Javitz, Vetteth, Seto, Bagley and Shah2021; Kelly et al., Reference Kelly, Karthikesalingam, Suleyman, Corrado and King2019; Wiens et al., Reference Wiens, Saria, Sendak, Ghassemi, Liu, Doshi-Velez, Jung, Heller, Kale, Saeed, Ossorio, Thadaney-Israni and Goldenberg2019; Obermeyer et al., Reference Obermeyer, Powers, Vogeli and Mullainathan2019).
Existing bibliometric studies have mainly described publication growth, source distribution, collaboration networks, and hotspot terms (Bai et al., Reference Bai, He and Jiao2025; Wang et al., Reference Wang, He, Yan, Chen, Zhang, Zhang and Liang2026; Završnik et al., Reference Završnik, Kokol, Žlahtič and Blažun Vošner2025). They have less often examined whether research attention is extending from model development towards validation, implementation, and governance. Accordingly, the present study examines this change in thematic attention and combines focused retrieval, rule-based prescreening, manual adjudication, and sensitivity reruns in an extended corpus to identify priorities for subsequent evidence synthesis.
Materials and methods
Data source and search strategy
This bibliometric mapping study used the Web of Science Core Collection (WoSCC) because it provides cited references and relatively standardized metadata suited to historiography, Reference Publication Year Spectroscopy (RPYS) and bibliographic coupling. Retrieval used a focused two-concept Topic query combining AI terms (‘artificial intelligence’, ‘machine learning’, ‘deep learning’) with PHC terms (‘primary care’, ‘general practice’, ‘family medicine’) for 1 January 2015 to 19 October 2025.
The search returned 1,481 records; after restriction to Article and Review document types, 1,261 records entered the screening workflow. The final main sample comprised 1,123 papers after weighted prescreening and manual adjudication. A separate supplementary sensitivity search outside the original 1,261-record screening chain identified 599 candidates; after 457 exclusions, 142 non-overlapping records were added, producing an extended corpus of 1,265 papers used only for controlled keyword-frequency, co-occurrence, and temporal keyword analyses.
Because one record was indexed as 2026 but carried an Early Access date in 2025, and because 2025 was incomplete at the search cut-off, annual comparisons were interpreted primarily over the complete years 2015–2024. The 2025 records were retained as partial-year observations and the single 2026 item as a database tail record.
The main sample was predominantly English (1,118/1,123), with two papers in Spanish, two in German and one in Portuguese.
Literature relevance screening: AI lexicon × PHC lexicon and composite scoring
To discipline the inclusion boundary after retrieval, titles, abstracts, and keyword fields were merged and screened in Python using case-insensitive regular expressions. Separate AI and PHC lexicons were applied. Lexical expansion was used after retrieval to improve sensitivity within the WoS entry set; it was not treated as an exhaustive multi-database search.
A rule-based composite score was used for prescreening: Score = 3 × I(AI > 0) + 2 × I(PHC > 0) + 0.3 × ai_match_count + 0.1× primarycare_match_count. Records with Score ≥ 4 were automatically retained; records with 2 ≤ Score <4 underwent manual review; Score <2 indicated preferred exclusion.
Among the 1,261 initial records, 977 were double hits on both AI and PHC lexicons, and all were retained. Manual review mainly resolved boundary-adjacent cases: 138 records were excluded, largely because they lacked a clear PHC application or represented specialty, public health or general AI material outside the study frame.
Governance-related terms, including ethics/ethical, fairness/bias, explainability, privacy/security, governance/regulation, and implementation/workflow, were identified through supplementary dictionary matching in the Author Keywords (DE) and Keywords Plus (ID) fields. These were interpreted as within-sample trend signals rather than exhaustive prevalence estimates.
A second reviewer rechecked 284 records from the manual-review interval and conflict set. After exclusion of uncertain cases, simple agreement was 0.753 and Cohen’s κ was 0.236; given the enrichment of borderline records, κ was interpreted cautiously as a process indicator rather than as a full-sample reliability estimate (McHugh, Reference McHugh2012).
Institution-name normalization and deduplication
Institution names were standardized in Python before institutional output and collaboration analyses to reduce spelling, punctuation, and abbreviation variation.
Bibliometric and knowledge-mapping analysis
Analysis combined bibliometrix/biblioshiny in R (R version 4.5.0; bibliometrix version 5.2.1) and VOSviewer/Pajek (versions 1.6.20 and 6.01, respectively). Descriptive bibliometrics, co-word analysis, and thematic mapping were used to characterize topical structure (Aria and Cuccurullo, Reference Aria and Cuccurullo2017; Callon et al., Reference Callon, Courtial and Laville1991; Donthu et al., Reference Donthu, Kumar, Mukherjee, Pandey and Lim2021; Moral-Munoz et al., Reference Moral-Munoz, Lopez-Herrera, Herrera-Viedma, Cobo, Glanzel, Moed, Schmoch and Thelwall2019; van Eck and Waltman, Reference van Eck and Waltman2010). Historiography, locally highly co-cited references and RPYS were used to interpret the knowledge base (Garfield, Reference Garfield1955; Marx et al., Reference Marx, Bornmann, Barth and Leydesdorff2014), and bibliographic coupling was used to identify frontier clusters (Kessler, Reference Kessler1963). Related software considerations were informed by VOSviewer and science-mapping tool reviews (Moral-Munoz et al., Reference Moral-Munoz, Lopez-Herrera, Herrera-Viedma, Cobo, Glanzel, Moed, Schmoch and Thelwall2019; van Eck and Waltman, Reference van Eck and Waltman2010). Interpretations were advanced only where modules pointed in the same direction. For the keyword co-occurrence network, the 50 most frequent standardized Author Keywords (DE) from the 1,265-record extended sensitivity corpus were analysed using weighted links, association-strength normalization, and a Fruchterman layout. Temporal keyword analysis in Figure 4 used the same extended sensitivity corpus, whereas the tabulated Trend Topics summary used combined Author Keywords (DE) and Keywords Plus (ID) from the 1,123-record main sample, with the 20 most frequent eligible terms, unigrams and a minimum frequency of 5. The thematic map used Keywords Plus (ID) from the main sample, up to 250 terms, a minimum frequency of 5 and no stemming. Default clustering settings were retained; no non-default clustering parameters were applied.
Software and reproducibility
Data cleaning and screening were carried out mainly in Python 3.10.8; bibliometric mapping was completed in R and VOSviewer/Pajek. Search screenshots, raw exports, prescreening scores, exclusion logs, and software outputs were retained to improve traceability. Table 13 and Figure 10 were regenerated from the locked 1,123-record input file using prespecified regular-expression dictionaries applied to the Author Keywords (DE) and Keywords Plus (ID) fields. Theme counts were computed directly from these fields using a unique-UT-per-theme-per-phase rule and validated against the locked phase denominators. Figure 10 was generated using Matplotlib 3.10.8.
Evidence boundaries and the interpretive scope of the results
This study maps structural concentration, collaboration, and thematic migration within a focused bibliometric corpus. It does not evaluate effect sizes, implementation outcomes or risk of bias, and dictionary-matched governance terms are interpreted cautiously as supportive signals within the sample.
Results
Overall output and general characteristics
Table-based and figure-based results are reported using two related analytic frames. The 1,261-record dataset was an intermediate screening pool and was not used as an analytical denominator. Descriptive bibliometrics, collaboration analyses, knowledge-base analyses, and coupling clusters were based on the 1,123-paper main sample. Controlled keyword-frequency, co-occurrence, and temporal keyword analyses used the 1,265-paper extended sensitivity corpus. The thematic map and the combined DE + ID Trend Topics summary remained based on the 1,123-paper main sample.
Across the study period, output rose steadily and accelerated after 2022, while collaboration remained strongly team-based and increasingly international. The field’s core terms and structural relations remained stable after sensitivity reruns, which supports the use of the main sample for interpretation.
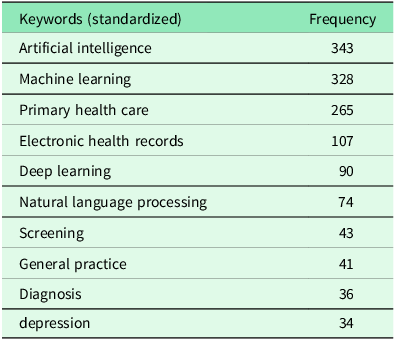
After standardization of author keywords in the extended corpus, the most frequent terms were AI (343), machine learning (328), primary health care (265), electronic health records (107), deep learning (90), natural language processing (74), screening (43), general practice (41), diagnosis (36), and depression (34). Taken together, the results point to a field organized around method, primary-care setting/task, and evaluation/deployment concerns.
Journal distribution and core sources (Bradford’s law)
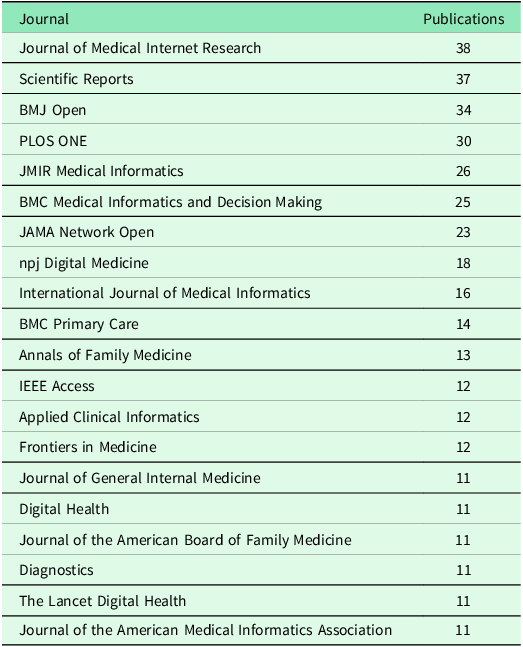
Bradford’s law showed a pronounced core–periphery distribution. Zone 1 contained 20 journals with 376 papers (33.5%), Zone 2 contained 113 journals with 373 papers (33.2%), and Zone 3 contained 349 journals with 374 papers (33.3%), indicating that a relatively small core of journals carried one third of the literature.
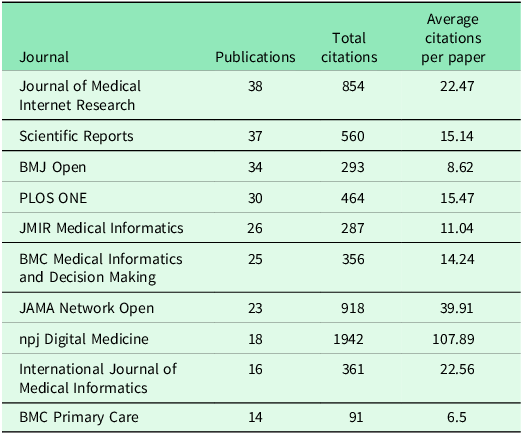
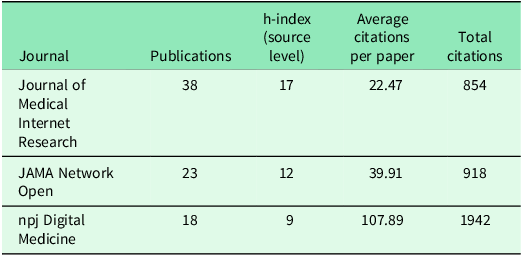
Tables 1–3 summarize the core and representative high-impact sources. The source profile suggests a dual publication ecology linking digital health/medical informatics journals with primary care journals.
Bradford core journals (Zone 1, ranked by publication count; main sample n = 1,123)

Table 1. Long description
A table titled ‘Bradford core journals (Zone 1, ranked by publication count; main sample n=1,123)’ lists journals and their publication counts. The table has two columns: Journal and Publications. It contains 20 rows. Row 1: Journal of Medical Internet Research, 38. Row 2: Scientific Reports, 37. Row 3: BMJ Open, 34. Row 4: PLOS ONE, 30. Row 5: JMIR Medical Informatics, 26. Row 6: BMC Medical Informatics and Decision Making, 25. Row 7: JAMA Network Open, 23. Row 8: npj Digital Medicine, 18. Row 9: International Journal of Medical Informatics, 16. Row 10: BMC Primary Care, 14. Row 11: Annals of Family Medicine, 13. Row 12: IEEE Access, 12. Row 13: Applied Clinical Informatics, 12. Row 14: Frontiers in Medicine, 12. Row 15: Journal of General Internal Medicine, 11. Row 16: Digital Health, 11. Row 17: Journal of the American Board of Family Medicine, 11. Row 18: Diagnostics, 11. Row 19: The Lancet Digital Health, 11. Row 20: Journal of the American Medical Informatics Association, 11.
Output and citation performance of the top 10 source journals (ranked by publication count; main sample n = 1,123)

Table 2. Long description
A table titled ‘Output and citation performance of the top 10 source journals’ with three columns and ten rows. The columns are labeled ‘Journal’, ‘Publications’, ‘Total citations’, and ‘Average citations per paper’. The rows list the following data: Row 1: Journal of Medical Internet Research, 38, 854, 22.47. Row 2: Scientific Reports, 37, 560, 15.14. Row 3: BMJ Open, 34, 293, 8.62. Row 4: PLOS ONE, 30, 464, 15.47. Row 5: JMIR Medical Informatics, 26, 287, 11.04. Row 6: BMC Medical Informatics and Decision Making, 25, 356, 14.24. Row 7: JAMA Network Open, 23, 918, 39.91. Row 8: npj Digital Medicine, 18, 1942, 107.89. Row 9: International Journal of Medical Informatics, 16, 361, 22.56. Row 10: BMC Primary Care, 14, 91, 6.5.
Summary of representative high-impact sources (condensed main-text version; main sample n = 1,123)

Table 3. Long description
A table comparing journal metrics for three medical journals. The table has four rows and four columns. The columns are labeled Journal, Publications, h-index (source level), Average citations per paper, and Total citations. The rows list the following data: Row 1: Journal of Medical Internet Research, 38, 17, 22.47, 854. Row 2: JAMA Network Open, 23, 12, 39.91, 918. Row 3: npj Digital Medicine, 18, 9, 107.89, 1942.
Recent growth was especially visible after 2022. BMC Primary Care contributed strongly in 2022–2025, while npj Digital Medicine, JAMA Network Open and Scientific Reports also expanded in the later period; International Journal of Medical Informatics remained a steady contributor across the whole interval. Overall, dissemination depended on both specialized informatics venues and broader clinical/open-access journals.
Collaboration patterns among authors, institutions, and countries
Collaboration showed a clear team-science profile. Only 21 papers were single-authored, the mean number of co-authors per paper was 7.91, and the international co-authorship rate was 30.54%.
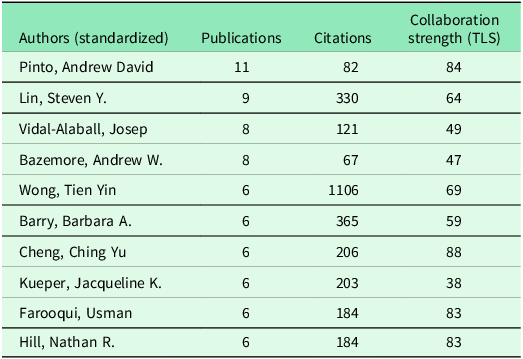
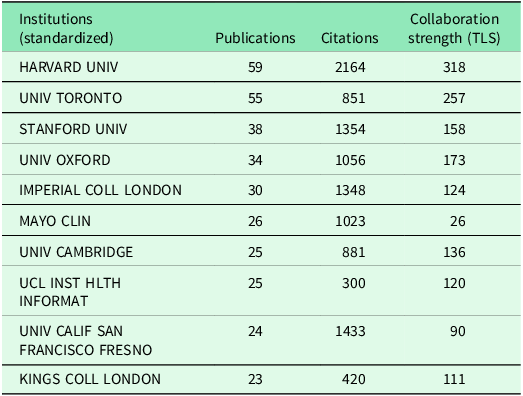
Under full counting, the top 10 authors generated 72 author–paper links and the top 10 institutions generated 339 institution–paper links; because individual papers could contribute to multiple authors or institutions, these totals were not interpreted as proportions of unique papers. Tables 4 and 5 show that highly productive authors and institutions also tended to occupy central network positions.
Top 10 authors (ranked by publication count; ties broken by citation count; main sample n = 1,123)
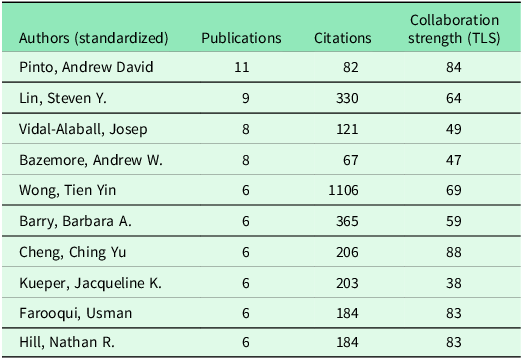
Table 4. Long description
A table titled ‘Top 10 authors (ranked by publication count; ties broken by citation count; main sample n=1,123)’ with four columns and ten rows. The columns are labeled ‘Authors (standardized)’, ‘Publications’, ‘Citations’, and ‘Collaboration strength (TLS)’. The rows list authors along with their respective publication counts, citation counts, and collaboration strength values. Row 1: Pinto, Andrew David, 11, 82, 84. Row 2: Lin, Steven Y., 9, 330, 64. Row 3: Vidal-Alaball, Josep, 8, 121, 49. Row 4: Bazemore, Andrew W., 8, 67, 47. Row 5: Wong, Tien Yin, 6, 1106, 69. Row 6: Barry, Barbara A., 6, 365, 59. Row 7: Cheng, Ching Yu, 6, 206, 88. Row 8: Kueper, Jacqueline K., 6, 203, 38. Row 9: Farooqui, Usman, 6, 184, 83. Row 10: Hill, Nathan R., 6, 184, 83.
Top 10 institutions (ranked by publication count; ties broken by citation count; main sample n = 1,123)

Table 5. Long description
A table titled ‘Top 10 institutions’ with four columns and ten rows. The columns are labeled ‘Institutions (standardized)’, ‘Publications’, ‘Citations’, and ‘Collaboration strength (TLS)’. The rows list the institutions and their respective values. Row 1: HARVARD UNIV, 59, 2164, 318. Row 2: UNIV TORONTO, 55, 851, 257. Row 3: STANFORD UNIV, 38, 1354, 158. Row 4: UNIV OXFORD, 34, 1056, 173. Row 5: IMPERIAL COLL LONDON, 30, 1348, 124. Row 6: MAYO CLIN, 26, 1023, 26. Row 7: UNIV CAMBRIDGE, 25, 881, 136. Row 8: UCL INST HLTH INFORMAT, 25, 300, 120. Row 9: UNIV CALIF SAN FRANCISCO FRESNO, 24, 1433, 90. Row 10: KINGS COLL LONDON, 23, 420, 111.
This pattern is consistent with a field that depends on stable teams combining clinical settings, data resources and methodological expertise.
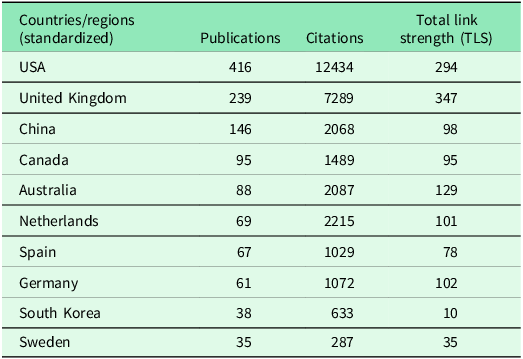
At country level, the United States and the United Kingdom occupied the strongest hub positions in Figure 1 and Table 6, with Australia, the Netherlands and Canada also showing strong collaboration intensity. The network therefore points to a core–periphery international structure in which multicentre collaboration likely supports data access, validation and cross-setting transfer.
Country collaboration map (main sample n = 1,123).

Top 10 countries/regions (counted by address; ties broken by citation count; main sample n = 1,123)

Table 6. Long description
A table comparing the top 10 countries/regions by their number of publications, citations, and total link strength. The table has 10 rows and 4 columns. The columns are labeled ‘Countries/regions (standardized)’, ‘Publications’, ‘Citations’, and ‘Total link strength (TLS)’. Row 1: USA, 416, 12434, 294. Row 2: United Kingdom, 239, 7289, 347. Row 3: China, 146, 2068, 98. Row 4: Canada, 95, 1489, 95. Row 5: Australia, 88, 2087, 129. Row 6: Netherlands, 69, 2215, 101. Row 7: Spain, 67, 1029, 78. Row 8: Germany, 61, 1072, 102. Row 9: South Korea, 38, 633, 10. Row 10: Sweden, 35, 287, 35.
Research hotspots: Keyword co-occurrence and thematic structure
Keyword analyses were rerun in the extended sensitivity corpus after controlled preprocessing intended to reduce fragmentation from case, hyphenation, abbreviations and singular/plural variants. This mainly affected surface forms rather than underlying themes. Residual label variants in the exported maps were treated as surface-form duplicates rather than distinct concepts (Figure 2). The corresponding standardized frequency ranking is presented in Table 7.
Co-occurrence network (Keywords, extended sensitivity corpus n = 1,265; DE after controlled processing).

Top 10 high-frequency keywords (extended sensitivity corpus n = 1,265; DE after controlled standardization)

Table 7. Long description
A table with two columns and ten rows. The first column is labeled ‘Keywords (standardized)’ and the second column is labeled ‘Frequency’. The table lists the following data: Row 1: Artificial intelligence, 343. Row 2: Machine learning, 328. Row 3: Primary health care, 265. Row 4: Electronic health records, 107. Row 5: Deep learning, 90. Row 6: Natural language processing, 74. Row 7: Screening, 43. Row 8: General practice, 41. Row 9: Diagnosis, 36. Row 10: Depression, 34.
DE, Author Keywords.
After reruns, the co-occurrence network still could be interpreted along three interlinked lines: an algorithm/model line (artificial intelligence, machine learning, deep learning, natural language processing), a setting/task line (primary health care, screening, diagnosis, electronic health records), and an evaluation/extension line that included risk prediction and accuracy. The persistence of this structure supports the robustness of the main thematic judgement.
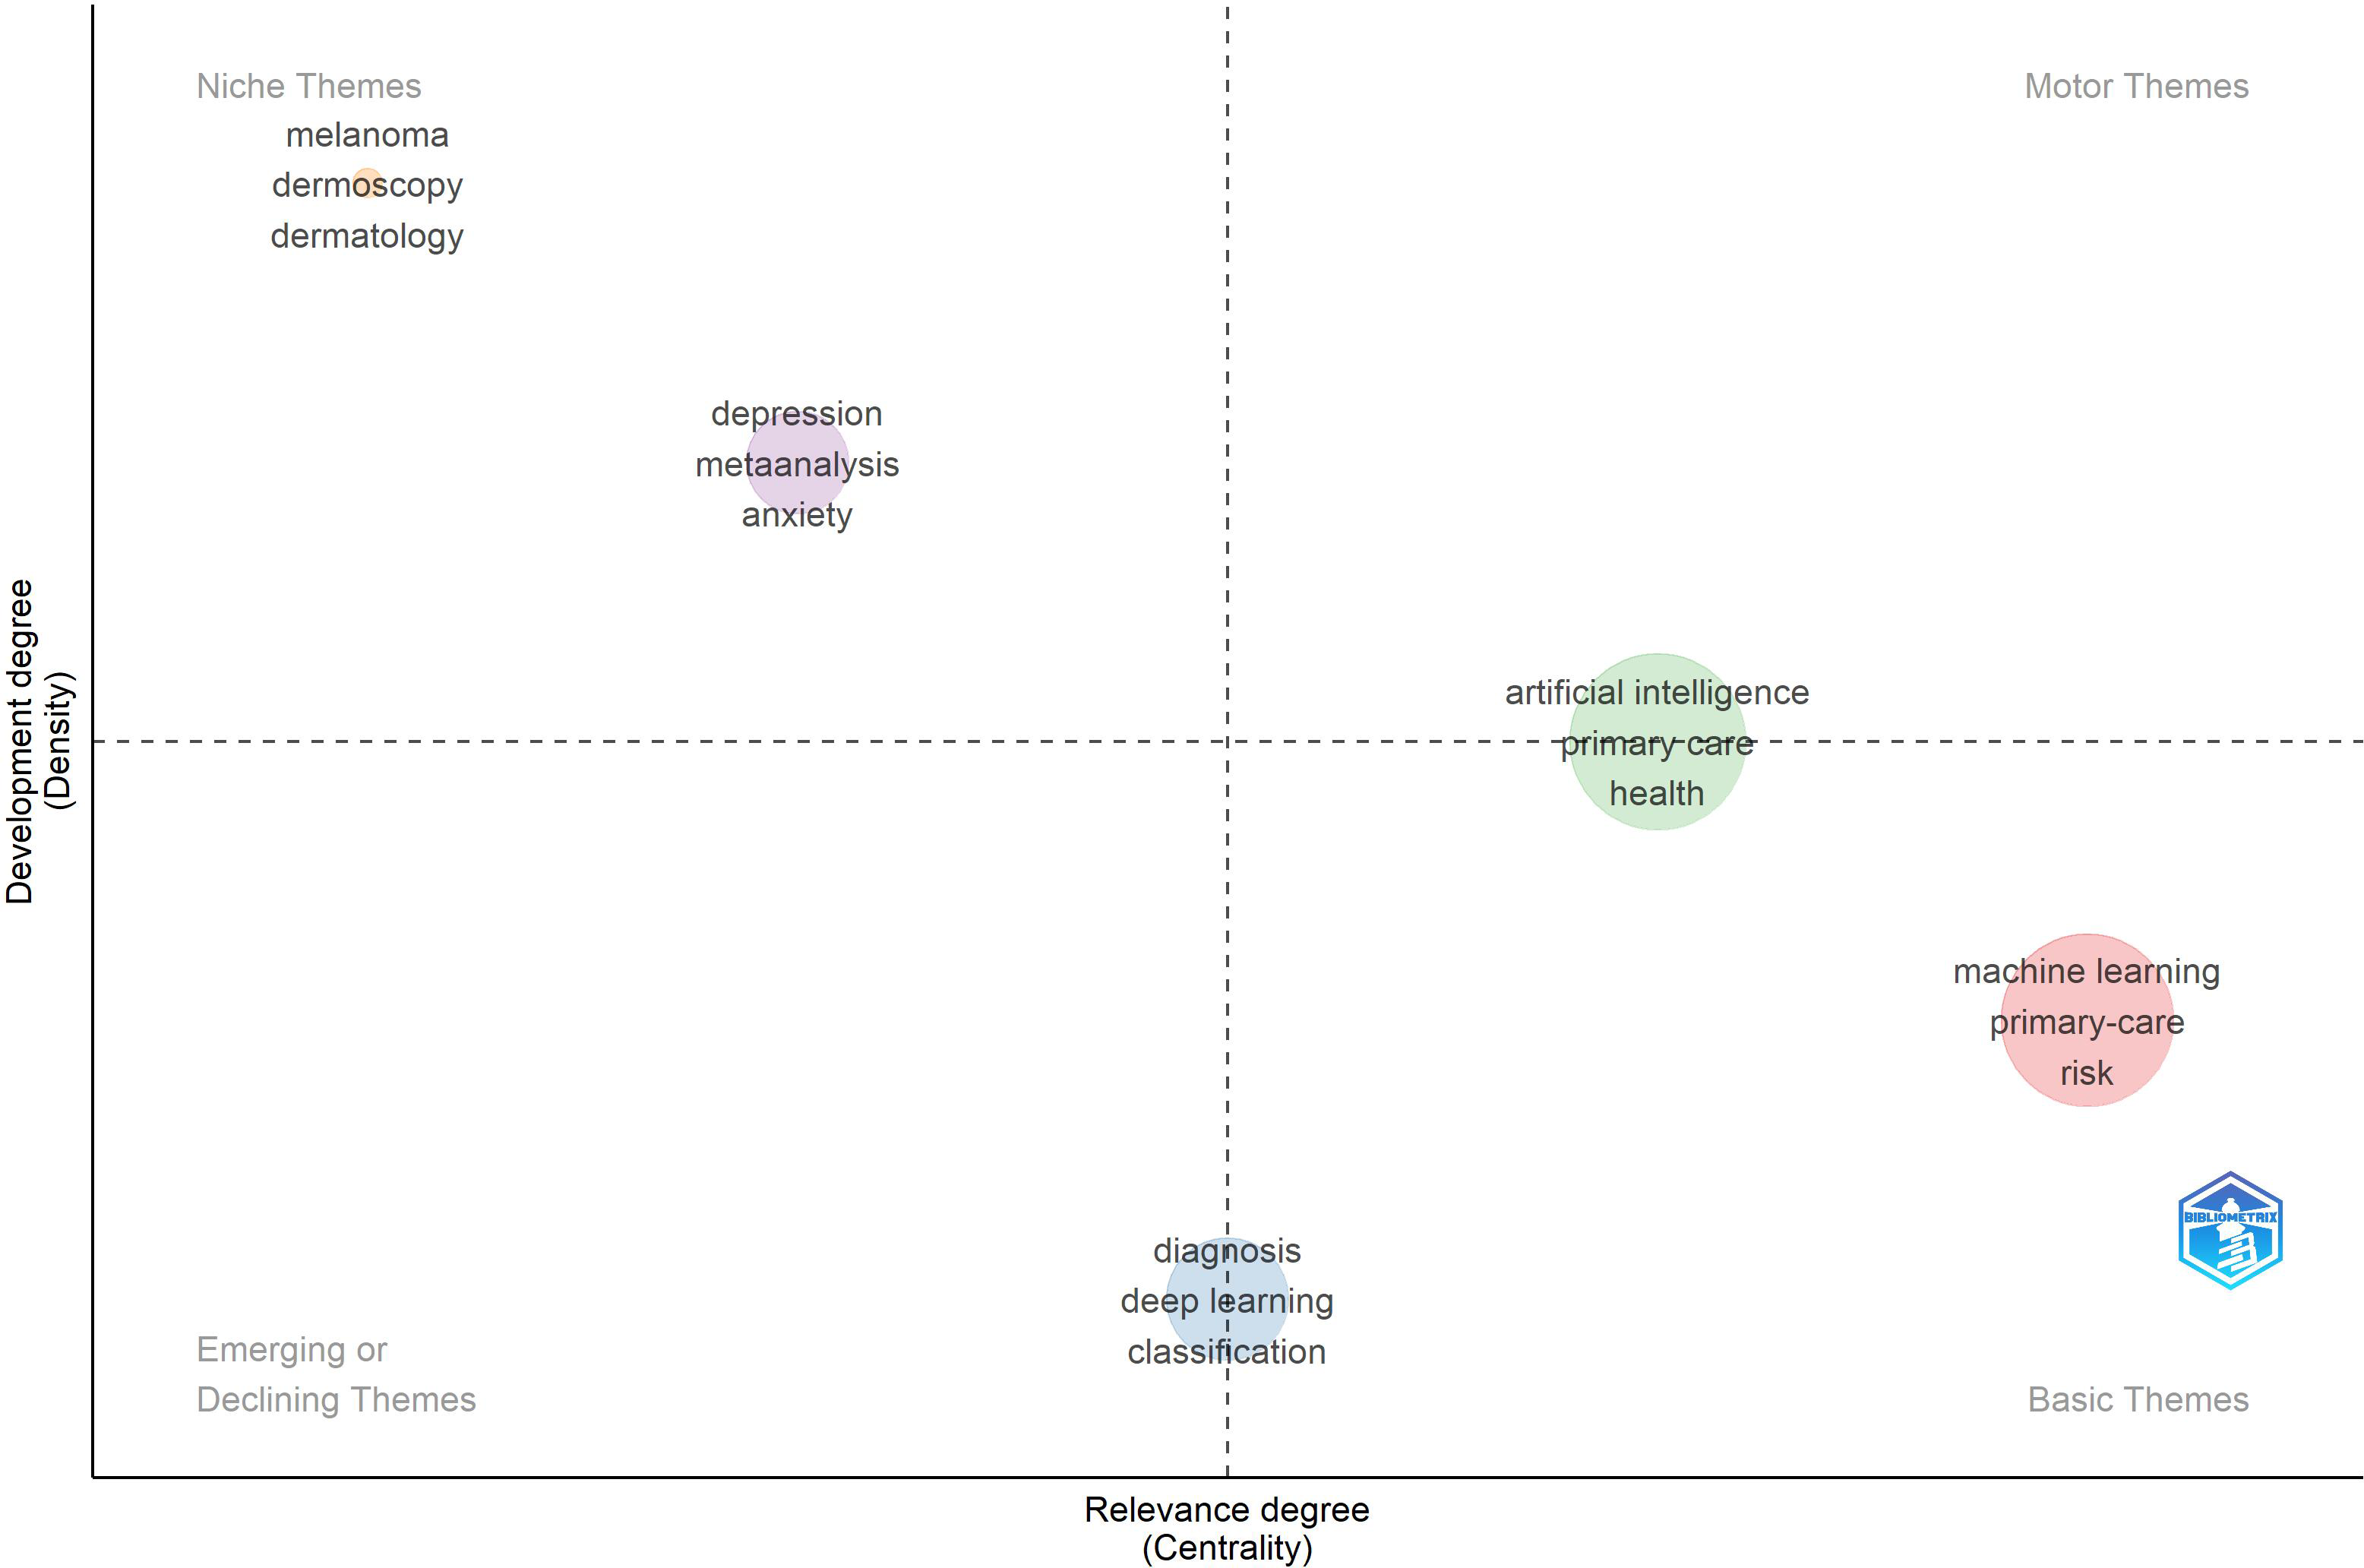
The thematic map added a second view of structure. AI and closely connected health-related terms occupied a central position near the boundary between motor and basic themes; machine learning, risk and primary-care vocabulary acted as broad cross-cutting basic themes; disease-specific clusters such as melanoma/dermoscopy appeared as more isolated niche themes; and deep learning/classification/diagnosis sat closer to the emerging side of the map. The map therefore suggests a field with a stable primary-care core, specialist spillovers and an evolving methodological frontier (Figure 3).
Thematic map (four-quadrant thematic structure; main sample n = 1,123).
Note: where 2025 terms appear, they represent signals from an incomplete year and are not treated as directly comparable with the complete years 2015–2024.
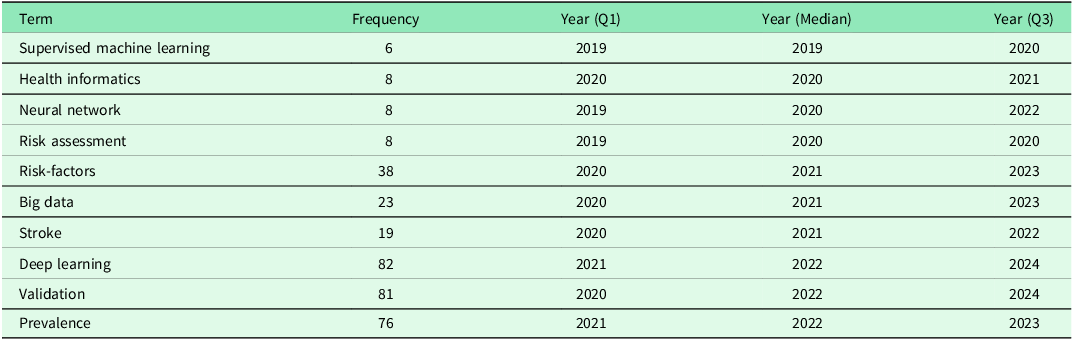
Trend topics and annual term frequencies indicated redistribution rather than simple replacement of topics over time. Earlier years were more strongly associated with supervised learning and health-informatics infrastructure; the middle period broadened towards risk assessment and multi-task applications; and the later period showed stronger visibility of deep learning, validation and model-evaluation terms. Large language models appeared mainly after 2023 as a late signal rather than a dominant theme. Figure 4 presents temporal keyword patterns in the 1,265-paper sensitivity corpus, whereas Table 8 reports the top-10 Trend Topics summary in the 1,123-paper main sample using combined DE and ID fields.
Trend topics (extended sensitivity corpus n = 1,265; 2015–2024 as the main comparison interval).

Trend Topics (Top 10) and their time distributions (Q1/Median/Q3; main analytical dataset n = 1,123; combined DE and ID)

Table 8. Long description
A table with 10 rows and 4 columns. The columns are labeled Term, Frequency, Year (Q1), Year (Median), and Year (Q3). The table lists the following terms and their respective data: Supervised machine learning with a frequency of 6, Year (Q1) 2019, Year (Median) 2019, and Year (Q3) 2020. Health informatics with a frequency of 8, Year (Q1) 2020, Year (Median) 2020, and Year (Q3) 2021. Neural network with a frequency of 8, Year (Q1) 2019, Year (Median) 2020, and Year (Q3) 2022. Risk assessment with a frequency of 8, Year (Q1) 2019, Year (Median) 2020, and Year (Q3) 2020. Risk-factors with a frequency of 38, Year (Q1) 2020, Year (Median) 2021, and Year (Q3) 2023. Big data with a frequency of 23, Year (Q1) 2020, Year (Median) 2021, and Year (Q3) 2023. Stroke with a frequency of 19, Year (Q1) 2020, Year (Median) 2021, and Year (Q3) 2022. Deep learning with a frequency of 82, Year (Q1) 2021, Year (Median) 2022, and Year (Q3) 2024. Validation with a frequency of 81, Year (Q1) 2020, Year (Median) 2022, and Year (Q3) 2024. Prevalence with a frequency of 76, Year (Q1) 2021, Year (Median) 2022, and Year (Q3) 2023.
Q1, first quartile; Q3, third quartile.
Note: the annual keyword-frequency curves retain 2025 only to show records up to the search cut-off; stage comparisons are based primarily on 2015–2024.
Standardized annual trends showed increasing relative visibility of artificial intelligence through 2024; machine learning declined after peaking in 2022, primary health care fluctuated but increased again in 2024, and deep learning and natural language processing showed no sustained post-2022 increase (Figure 5).
Normalized frequency of selected DE terms over time (documents per 100 papers; extended sensitivity corpus n = 1,265; 2015–2024 as the main comparison interval; 2025 shown as an incomplete-year observation).

Knowledge base: Highly cited literature, historiography, and RPYS
Knowledge-base analysis combined global citations, local citations, the historiograph and RPYS. These modules distinguish between broad clinical-AI influences on the field and the more specific references that structure work within primary-care AI.
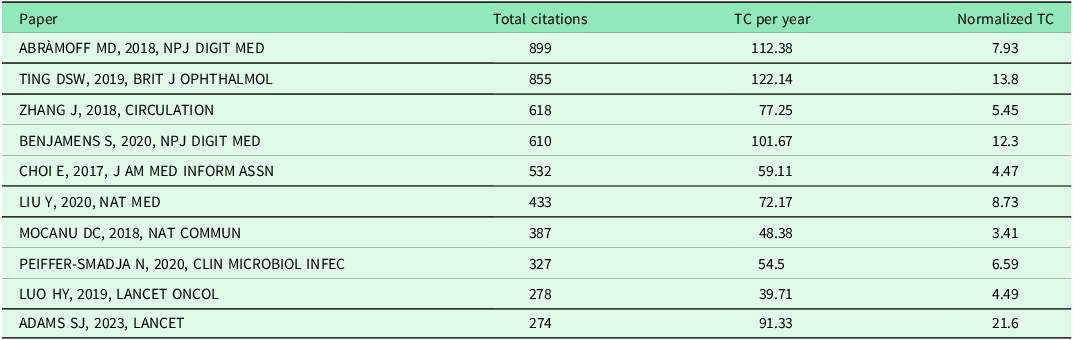
Globally highly cited documents were concentrated in milestone clinical-AI applications and widely transferable methodological frameworks, indicating that the PHC literature draws on a broader clinical-AI conversation (Figure 6; Table 9).
Most global cited documents (Top 10; main sample n = 1,123).

Top 10 globally cited documents (GCS perspective; main sample n = 1,123)

Table 9. Long description
A table comparing the total citations, citations per year, and normalized total citations of top globally cited documents. The table has 10 rows and 4 columns. Column headers are Paper, Total citations, TC per year, and Normalized TC. Row 1: Paper, ABRAMOFF MD, 2018, NPJ DIGIT MED; Total citations, 899; TC per year, 112.38; Normalized TC, 7.93. Row 2: Paper, TING DSW, 2019, BRIT J OPHTHALMOL; Total citations, 855; TC per year, 122.14; Normalized TC, 13.8. Row 3: Paper, ZHANG J, 2018, CIRCULATION; Total citations, 618; TC per year, 77.25; Normalized TC, 5.45. Row 4: Paper, BENJAMENS S, 2020, NPJ DIGIT MED; Total citations, 610; TC per year, 101.67; Normalized TC, 12.3. Row 5: Paper, CHOI E, 2017, J AM MED INFORM ASSN; Total citations, 532; TC per year, 59.11; Normalized TC, 4.47. Row 6: Paper, LIU Y, 2020, NAT MED; Total citations, 433; TC per year, 72.17; Normalized TC, 8.73. Row 7: Paper, MOCANU DC, 2018, NAT COMMUN; Total citations, 387; TC per year, 48.38; Normalized TC, 3.41. Row 8: Paper, PEIFFER-SMADJA N, 2020, CLIN MICROBIOL INFE; Total citations, 327; TC per year, 54.5; Normalized TC, 6.59. Row 9: Paper, LUO HY, 2019, LANCET ONCOL; Total citations, 278; TC per year, 39.71; Normalized TC, 4.49. Row 10: Paper, ADAMS SJ, 2023, LANCET; Total citations, 274; TC per year, 91.33; Normalized TC, 21.6.
GCS, global citation score; TC, total citations.
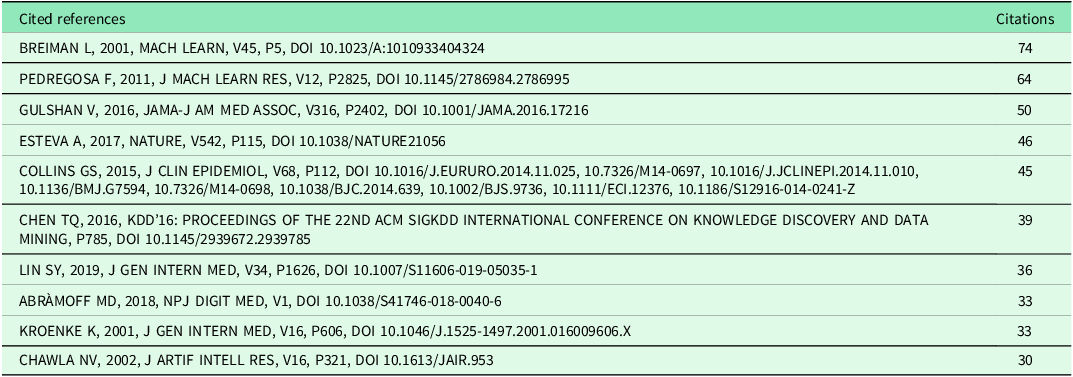
Locally highly co-cited references more clearly represented the field’s internal methodological and normative base, including machine-learning methods, software ecosystems such as scikit-learn and XGBoost, and reporting/evaluation guidance such as TRIPOD (Figure 7; Table 10).
Most local cited references (Top 10; main sample n = 1,123).

Top 10 locally highly co-cited references (LCR perspective; main sample n = 1,123)

Table 10. Long description
A table titled ‘Cited references’ and ‘Citations’ with two columns and ten rows. The first column lists the cited references, and the second column lists the number of citations. Row 1: BREIMAN L, 2001, MACH LEARN, V45, P5, DOI 10.1023/A:1010933404324, 74. Row 2: PEDREGOSA F, 2011, J MACH LEARN RES, V12, P2825, DOI 10.1145/2786984.2786995, 64. Row 3: GULSHAN V, 2016, JAMA-J AM MED ASSOC, V316, P2402, DOI 10.1001/JAMA.2016.17216, 50. Row 4: ESTEVA A, 2017, NATURE, V542, P115, DOI 10.1038/NATURE21056, 46. Row 5: COLLINS GS, 2015, J CLIN EPIDEMIO, V68, P112, DOI 10.1016/J.JEURO.2014.11.025, 10.7326/M14-0697, 10.1016/J.JCLINEPI.2014.11.010, 10.1136/BMJ.G7594, 10.7326/M14-0698, 10.1038/BJC.2014.639, 10.1002/BJS.9736, 10.1111/ECI.12376, 10.1186/S12916-014-0241-Z, 45. Row 6: CHEN TQ, 2016, KDD’16: PROCEEDINGS OF THE 22ND ACM SIGKDD INTERNATIONAL CONFERENCE ON KNOWLEDGE DISCOVERY AND DATA MINING, P785, DOI 10.1145/2939672.2939785, 39. Row 7: LIN SY, 2019, J GEN INTERN MED, V34, P1626, DOI 10.1007/S11606-019-05035-1, 36. Row 8: ABRÀMOFF MD, 2018, NPJ DIGIT MED, V1, DOI 10.1038/S41746-018-0040-6, 33. Row 9: KROENKE K, 2001, J GEN INTERN MED, V16, P606, DOI 10.1046/J.1525-1497.2001.016009606.X, 33. Row 10: CHAWLA NV, 2002, J ARTIF INTELL RES, V16, P321, DOI 10.1613/JAIR.953, 30.
LCR, locally cited references.
The historiograph suggested a main path from predictive modelling and risk stratification, through stronger attention to validation and interpretability, towards more complex application and implementation questions (Figure 8).
Historiograph (knowledge lineage/main path; main sample n = 1,123).

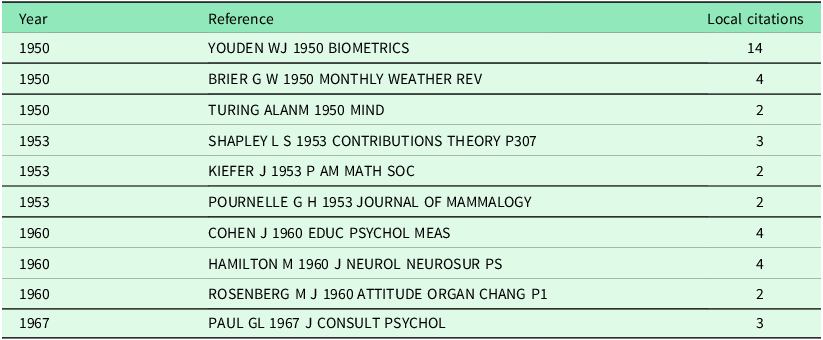
RPYS peaks largely reflected general methodological foundations rather than uniquely PHC-specific milestone papers, which is why Table 11 is interpreted as contextual rather than definitive for the PHC field itself.
RPYS peak years and representative references (Top 10 peaks; main sample n = 1,123)

Table 11. Long description
A table showing peak years, references, and local citations. The table has three columns: Year, Reference, and Local citations. It contains 10 rows of data. Row 1: 1950, YOUDEN WJ 1950 BIOMETRICS, 14. Row 2: 1950, BRIER G W 1950 MONTHLY WEATHER REV, 4. Row 3: 1950, TURING ALANM 1950 MIND, 2. Row 4: 1953, SHAPLEY L S 1953 CONTRIBUTIONS THEORY P307, 3. Row 5: 1953, KIEFER J 1953 P AM MATH SOC, 2. Row 6: 1953, POURNELLE G H 1953 JOURNAL OF MAMMALOGY, 2. Row 7: 1960, COHEN J 1960 EDUC PSYCHOL MEAS, 4. Row 8: 1960, HAMILTON M 1960 J NEUROL NEUROSUR PS, 4. Row 9: 1960, ROSENBERG M J 1960 ATTITUDE ORGAN CHANG P1, 2. Row 10: 1967, PAUL GL 1967 J CONSULT PSYCHOL, 3.
RPYS, Reference Publication Year Spectroscopy.
Evolutionary pathway: Trend topics and frontier clusters
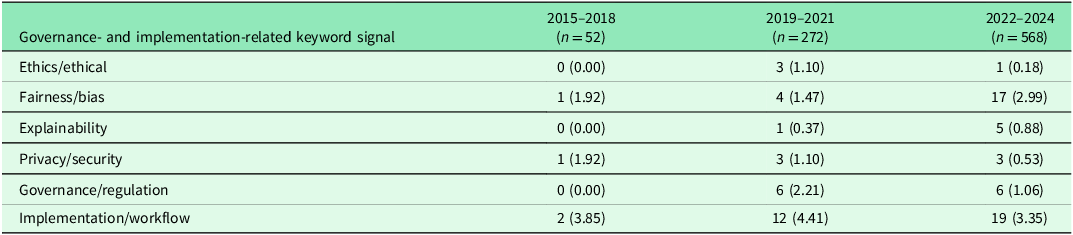
Trend topics, annual frequencies, bibliographic coupling and phase-normalized governance terms were interpreted together to describe thematic migration. For presentation, three heuristic phases were used: 2015–2018, 2019–2021 and 2022–2024. These are summary labels rather than hard historical boundaries. For the low-frequency governance and implementation signals, complete years were grouped into these three descriptive periods to reduce instability in annual rates; this grouping was used only for phase-level comparison.
In 2015–2018, output was comparatively limited and the field centred on feasibility-oriented machine-learning applications in primary care. In 2019–2021, research broadened towards risk assessment, chronic disease management and more varied model families, with stronger attention to reproducibility and external validation. In 2022–2024, AI gained relative visibility, primary health care increased again by 2024, and machine learning declined after its 2022 peak; large language models began to appear, and later-phase signals included validation, implementation/workflow, fairness/bias, explainability and governance/regulation.
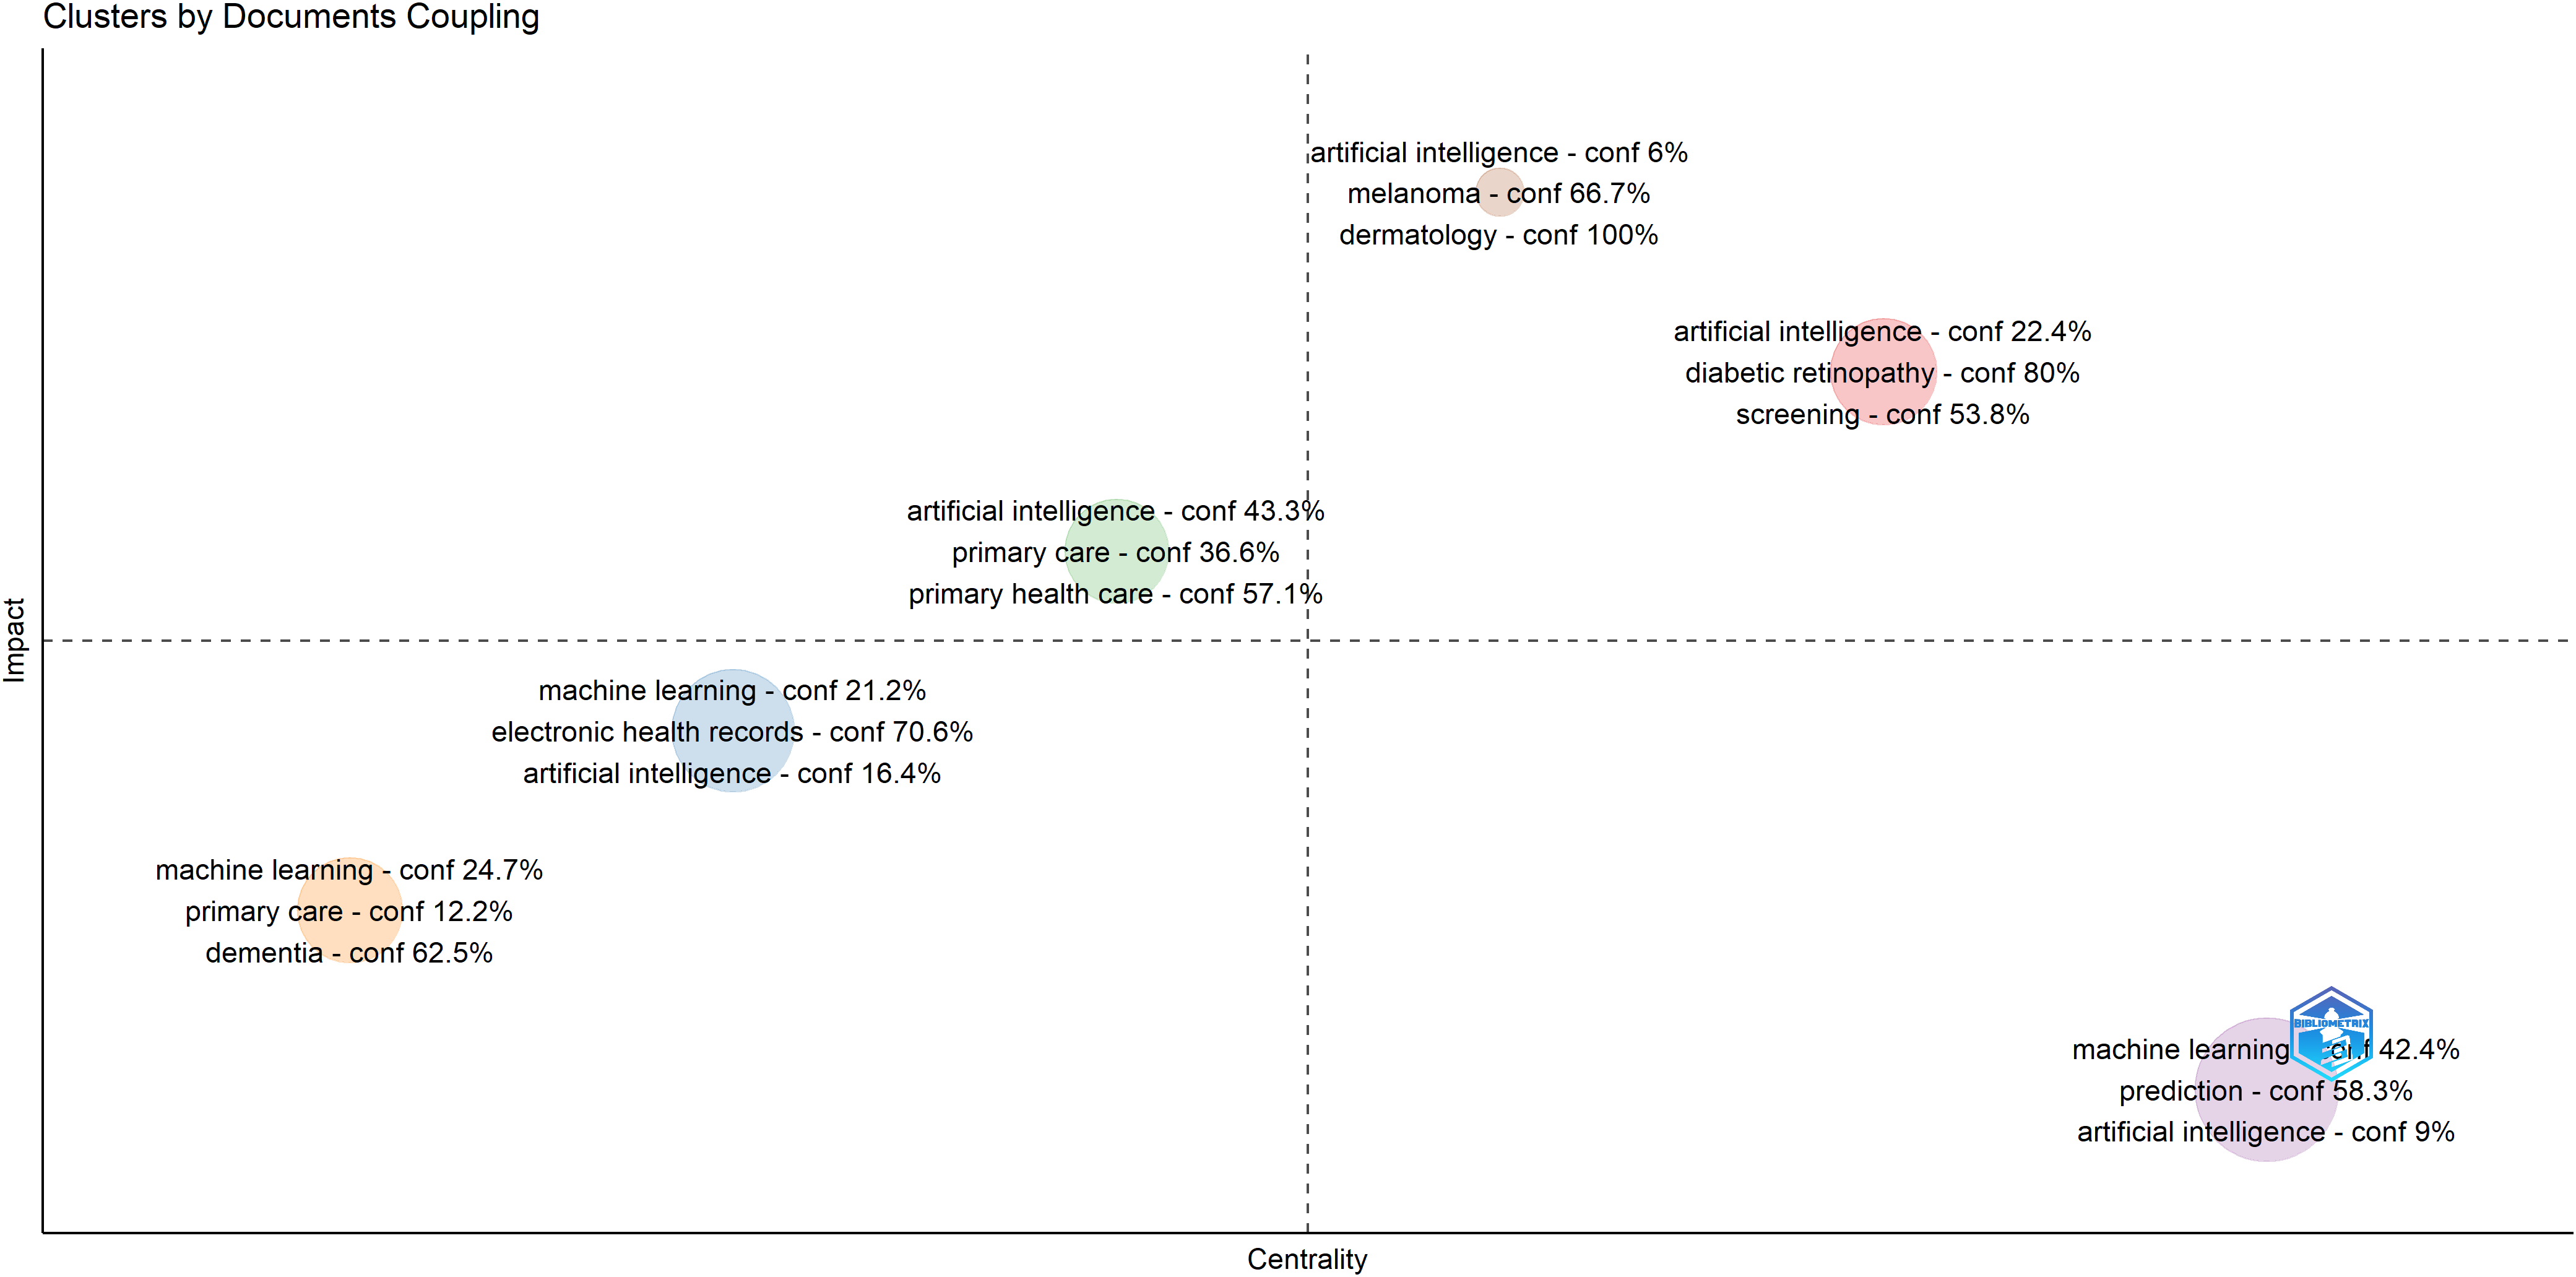
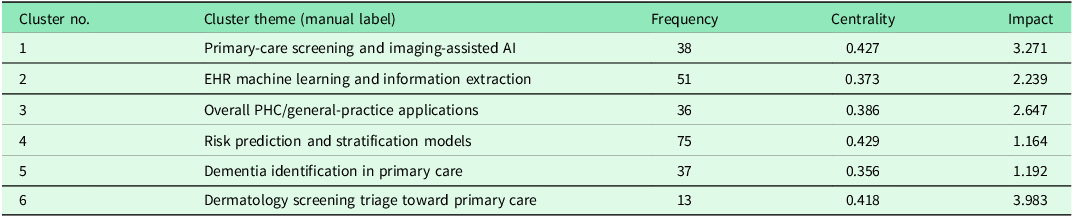
The coupling map (Figure 9; Table 12) showed that frontier clusters were organized around related application and evaluation agendas rather than a single dominant specialty. Table 13 and Figure 10 are especially important for interpretation: governance/regulation emerged after 2018 and remained detectable in both later phases; fairness/bias and explainability increased most clearly in the latest phase; and implementation/workflow varied non-monotonically.
Coupling map (frontier clusters; main sample n = 1,123).

Phase-normalized document-level frequencies of governance- and implementation-related keyword signals in the 2015–2024 subset of the main sample (n = 892; DE + ID; per 100 documents; phase n = 52, 272, and 568).

Summary of frontier clusters identified by bibliographic coupling (Coupling map clusters; main sample n = 1,123)

Table 12. Long description
A table with six rows and five columns summarizing frontier clusters identified by bibliographic coupling. The columns are labeled Cluster no., Cluster theme (manual label), Frequency, Centrality, and Impact. Row 1: Cluster no. 1, Cluster theme Primary-care screening and imaging-assisted AI, Frequency 38, Centrality 0.427, Impact 3.271. Row 2: Cluster no. 2, Cluster theme EHR machine learning and information extraction, Frequency 51, Centrality 0.373, Impact 2.239. Row 3: Cluster no. 3, Cluster theme Overall PHC/general-practice applications, Frequency 36, Centrality 0.386, Impact 2.647. Row 4: Cluster no. 4, Cluster theme Risk prediction and stratification models, Frequency 75, Centrality 0.429, Impact 1.164. Row 5: Cluster no. 5, Cluster theme Dementia identification in primary care, Frequency 37, Centrality 0.356, Impact 1.192. Row 6: Cluster no. 6, Cluster theme Dermatology screening triage toward primary care, Frequency 13, Centrality 0.418, Impact 3.983.
Three-phase document-level occurrence of governance- and implementation-related keyword signals in the 2015–2024 subset of the main sample (n = 892; DE + ID; frequencies per 100 documents)

Table 13. Long description
A table comparing the occurrence of governance- and implementation-related keywords across three phases: 2015-2018, 2019-2021, and 2022-2024. The table has 7 rows and 4 columns. Column headers are Governance- and implementation-related keyword signal, 2015-2018 (n = 52), 2019-2021 (n = 272), and 2022-2024 (n = 568). Row labels are Ethics/ethical, Fairness/bias, Explainability, Privacy/security, Governance/regulation, and Implementation/workflow. Each cell contains the frequency per 100 documents for the respective keyword signal and phase. Notable trends include an increase in the frequency of most keywords over time, with Implementation/workflow showing the highest frequencies across all phases.
Counts represent unique Web of Science accession numbers (UTs) containing at least one prespecified dictionary term in the Author Keywords (DE) or Keywords Plus (ID) field. Each document was counted once per theme within each phase but could contribute to more than one theme. Values in parentheses are frequencies per 100 documents. DE, Author Keywords; ID, Keywords Plus; UT, Web of Science accession number. Records from 2025 (n = 230) and the single 2026 database-tail record were excluded from phase comparisons because 2025 was incomplete at the search cutoff.
These patterns support a cautious interpretation of selective movement from model-centred research towards deployment-related accountability within the sample. They do not indicate uniform growth in all governance terms, and because the governance dictionaries were supplementary, they should not be read as an exhaustive assessment of implementation readiness.
Discussion
Main findings and their academic implications
This study shows that research on artificial intelligence in primary health care has continued to grow, with its focus gradually expanding from model development to model validation, clinical implementation, and governance. However, increases in publication volume and the breadth of research themes merely reflect shifts in research attention and do not indicate that the field has entered a mature stage of clinical translation. More precisely, the research focus is shifting from whether models can be developed to whether they can be validated, implemented, and used appropriately within a robust governance framework.
Moreover, good model performance does not necessarily translate into clear clinical value (Shah et al., Reference Shah, Milstein and Bagley2019). Accuracy, discrimination, and predictive performance can quantify algorithmic performance, but they cannot independently determine whether a model is suitable for real-world primary care settings. Clinical value also depends on external validity, workflow integration, clinician and patient acceptance, resource requirements, and patient outcomes. Therefore, evaluation should move beyond comparisons of technical metrics towards determining the usability and incremental value of models in routine clinical practice (Rajkomar et al., Reference Rajkomar, Dean and Kohane2019).
Similarly, fairness, explainability, privacy protection, accountability, and governance should not be regarded as supplementary requirements introduced only after model deployment. These factors directly influence model validation, clinical trust, and sustained use. Inadequate data representativeness may lead to performance disparities across population groups; limited explainability may reduce clinical acceptance; and unclear lines of responsibility may constrain implementation. Governance should therefore be integrated throughout model development, validation, implementation, and continuous monitoring rather than added only after the technical work has been completed.
Furthermore, the effectiveness of a model in one region does not imply that it can be directly transferred to other primary health care systems. Differences in population characteristics, data quality, staffing, infrastructure, and workflows may alter both model performance and implementation outcomes. Future research should therefore determine not only whether a model is effective, but also for which populations and in which settings it is effective, as well as under what organizational conditions it can be used sustainably.
Relationship to published studies and the added value of this article
The findings of this study are broadly consistent with those of recent bibliometric analyses, which have similarly reported a sustained increase in publications on AI in primary health care and a relatively stable structure of core research themes (Wang et al., Reference Wang, He, Yan, Chen, Zhang, Zhang and Liang2026; Završnik et al., Reference Završnik, Kokol, Žlahtič and Blažun Vošner2025). The added value of the present study lies not in identifying different research hotspots, but in addressing a more specific question through a transparent and traceable analytical workflow: whether research attention in this field has expanded from model development to model validation, clinical implementation, and deployment-related governance and accountability, and whether this interpretation remains robust after a modest broadening of the eligibility boundaries.
Further analyses indicated that topics related to model validation, clinical implementation, and governance did not change in parallel. Fairness and bias, as well as explainability, became more prominent in recent publications; governance and regulation emerged after 2018 and remained detectable at a lower frequency in 2022–2024, whereas implementation/workflow remained visible but varied non-monotonically. These findings suggest that, while maintaining a strong focus on model performance, artificial intelligence research in primary health care is gradually expanding to encompass technical applicability, organizational integration, and accountability in real-world settings. Nevertheless, this pattern alone does not indicate that the field has established a mature clinical implementation framework. Previous studies have also examined fairness assessment (Schaekermann et al., Reference Schaekermann, Spitz, Pyles, Cole-Lewis, Wulczyn, Pfohl, Martin, Jaroensri, Keeling, Liu, Farquhar, Xue, Lester, Hughes, Strachan, Tan, Bui, Mermel, Peng, Matias, Corrado, Webster, Virmani, Semturs, Liu, Horn and Cameron Chen2024), explainable decision support in general practice (Liu et al., Reference Liu, Tian, Zhou, Lyu, Wang, Zheng, Liu, Ren and Li2024), barriers to implementation in primary care (Martinez-Martinez et al., Reference Martínez-Martínez, Martínez-Alfonso, Sánchez-Rojo-Huertas, Reynolds-Cortez, Turégano-Chumillas, Meseguer-Ruiz, Cekrezi and Martínez-Vizcaíno2025), and standards for the evaluation and reporting of clinical decision support systems (Cruz Rivera et al., Reference Cruz Rivera, Liu, Chan, Denniston and Calvert2020; Liu et al., Reference Liu, Cruz Rivera, Moher, Calvert and Denniston2020; Vasey et al., Reference Vasey, Ursprung, Beddoe, Taylor, Marlow, Bilbro, Watkinson and McCulloch2021, Reference Vasey, Nagendran, Campbell, Clifton, Collins, Denaxas, Denniston, Faes, Geerts, Ibrahim, Liu, Mateen, Mathur, McCradden, Morgan, Ordish, Rogers, Saria, Ting, Watkinson, Weber, Wheatstone and Peter McCulloch2022). These studies corroborate the thematic changes identified in the present analysis. However, the quality of the available evidence, the nature of implementation barriers, and their practical effects require further clarification through targeted scoping reviews or systematic reviews.
Implications for research and practice
This study identified several priority areas in AI research in primary health care (PHC), including model validation, clinical implementation and workflow integration, fairness, explainability, and governance. The increasing attention given to these topics in recent literature suggests that future research should move beyond the assessment of model performance and place greater emphasis on external validation, risk-of-bias assessment, clinical effectiveness, implementation feasibility and cost-effectiveness in real-world primary care settings (Collins et al., Reference Collins, Reitsma, Altman and Moons2015; Moons et al., Reference Moons, Wolff, Riley, Whiting, Westwood, Collins, Reitsma, Kleijnen and Mallett2019). Priority application areas include chronic disease management, risk prediction, clinical decision support and healthcare resource optimization. In practice, the adoption of artificial intelligence tools should account for staffing, data availability and routine clinical workflows (Tsai et al., Reference Tsai, Lee, Phillips and Lin2025), while evaluating feasibility, fairness, continuity of care, access, workload, safety, equity and actual value for service delivery. Evidence syntheses in this area should fully report the literature search and study selection processes in accordance with the PRISMA 2020 statement (Page et al., Reference Page, McKenzie, Bossuyt, Boutron, Hoffmann, Mulrow, Shamseer, Tetzlaff, Akl, Brennan, Chou, Glanville, Grimshaw, Hróbjartsson, Lalu, Li, Loder, Mayo-Wilson, McDonald, McGuinness, Stewart, Thomas, Tricco, Welch, Whiting and Moher2021).
Strengths, limitations, and scope of interpretation
The principal strength of this study lies in its transparent and traceable analytical workflow, which comprised a focused search, rule-based prescreening, dual-reviewer screening, adjudication of disagreements, and sensitivity reanalysis. However, the study was restricted to the WoSCC and used a focused search strategy; therefore, relevant studies indexed in other databases or described using alternative terminology may have been missed. The thematic boundaries of primary health care also remain subject to some uncertainty, and governance-related topics were identified mainly through supplementary term matching. In addition, 2025 represents an incomplete publication year and should not be directly compared with data from complete calendar years.
These limitations are more likely to affect borderline records and low-frequency topics, while having a relatively limited influence on the major structural patterns consistently identified across multiple analytical modules. Accordingly, this study was designed to characterize the literature structure, thematic evolution, and research priorities of the field rather than to provide an exhaustive census of all relevant publications. It also does not constitute an evidence synthesis of clinical effectiveness or implementation outcomes.
Conclusion
AI research in primary health care has continued to grow, with major themes remaining focused on machine learning, electronic health records, screening, and diagnosis. Recent publications showed greater attention to model validation, fairness and explainability; implementation/workflow remained visible, while governance/regulation emerged after 2018 but did not increase monotonically. Sensitivity analyses supported the stability of the core keyword structure and temporal keyword patterns. These findings indicate that the field is expanding beyond model development towards questions of clinical applicability and responsible use. However, bibliometric patterns reflect changes in research attention only and are insufficient to determine whether artificial intelligence has been routinely implemented in primary care or has improved clinical outcomes. Future research should place greater emphasis on external validation, real-world implementation, contextual adaptation, and governance evaluation.
Data availability statement
The bibliographic data analysed in this study were obtained from the Web of Science Core Collection and are subject to its licensing conditions. Search strategies, screening logs, derived datasets, and analytical outputs are available from the corresponding author upon reasonable request.
Acknowledgements
OpenAI’s ChatGPT was used to assist with English-language editing, manuscript organization, and improving clarity of expression. All AI-assisted content was critically reviewed and revised by the authors, who take full responsibility for the accuracy, integrity, and content of the manuscript.
Author contributions (CRediT roles)
Author 1: Data curation, Formal analysis, Software, Visualization, Writing – original draft.
Author 2: Validation, Writing – review and editing.
Author 3: Data curation, Validation, Writing – review and editing.
All authors reviewed and approved the final version of the manuscript. The author numbering corresponds to the author order presented on the title page.
Funding statement
The authors received no financial support for the research, authorship, and/or publication of this article.
Competing interests
The authors declare no conflicts of interest relevant to this work.
Ethical standards
This bibliometric study analysed bibliographic records from published literature and did not involve human participants, identifiable patient data, patient contact, animal experimentation, or primary data collection. Ethics committee approval and informed consent were therefore not required.










 Open access

