I. INTRODUCTION
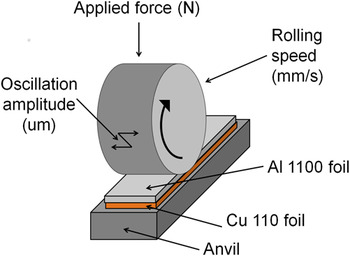
The ultrasonic consolidation (UC) process consists of three main variables: An applied pressure on top of the foils, an oscillation amplitude transverse to the rolling direction, and the rolling speed of the sonotrode down the length of the sample as illustrated in Fig. 1. The bonding mechanisms for this manufacturing process are still widely debated, but it is agreed that there are two necessary stages for welding to occur. Reference Cheng and Li1,Reference Janaki Ram, Robinson, Yang and Stucker2 The first stage is the generation of intimate contact between layers. This is aided by acoustic softening which lowers the yield stress of the metal due to high frequency ultrasonic energy. Reference Langenecker3 The second stage is the bonding across the interface, which is much more controversial due to several factors including: The short weld times (with typical speeds ranging from 10 to 40 mm/s, the sonotrode is in direct contact with the foil or tape surface for less than 1 s), significant microstructural changes at the interface, strain hardening effects, and localized frictional heat generation.
Illustration of the UC process.

Diffusion as a bonding mechanism for ultrasonically consolidated samples has previously been explored using x-ray energy-dispersive spectroscopy (XEDS) in the scanning electron microscope (SEM). Aluminum bonded to zinc (Zn), copper (Cu), and nickel (Ni) were studied, and it was found that diffusion occurred over approximately two micrometers in distance. Reference Matsuoka and Imai4,Reference Yang, Janaki Ram and Stucker5 These studies however did not consider the electron beam–specimen interaction, which is also known as the interaction volume interference. This interaction volume interference generates a significant amount of error for resulting concentration profiles, leading to an apparent diffusion curve that is much wider than the true diffusion curve. Reference Mueller, Gillespie and Advani6
Other potential bonding mechanisms besides diffusion have also been explored. Studies have shown supporting evidence for continuous dynamic recrystallization (CDRX) as a bonding mechanism for UC through the measurement of low-angle misorientation angles utilizing electron backscatter diffraction. Reference Mariani and Ghassemieh7,Reference Sriraman, Babu and Short8 The CDRX process involves the rearrangement of dislocations to form low-angle boundary subgrains. Reference Gourdet and Montheillet9 Many researchers have observed the resulting subgrain microstructure for ultrasonically consolidated samples. Reference Mariani and Ghassemieh7,Reference Johnson, Edmonds, Higginson and Harris10–Reference Li and Soar12
The subgrain formation provides numerous short-circuit pathways for grain boundary diffusion to occur. However, grain boundary diffusion is not always dominant over bulk or lattice diffusion even though the activation energy for grain boundary diffusion is lower. At higher temperatures, the vacancy concentration increases significantly which enhances diffusion through the grains between vacant sites. Porter and Easterling Reference Porter and Easterling13 previously defined an apparent diffusion coefficient as a function of the relative cross sections of the grain boundary and lattice diffusion fluxes (assuming δ/d is small) as shown in Eq. (1).
 $$D_{{\rm{apparent}}} = D_{{\rm{lattice}}} + D_{{\rm{grain}}\;{\rm{boundary}}} {\delta \over d}\quad .$$
The grain boundary width, δ, is widely accepted as 0.5 nm, Reference Porter and Easterling13–Reference Priester16 and d is the grain size. Utilizing this equation, a critical temperature can be found for a given grain size as the transition point between grain boundary and bulk diffusion dominance.
The goal of this article is to accurately determine the concentration profile for ultrasonically consolidated Cu–Al using transmission electron microscopy (TEM) XEDS and confirm the presence of phase transformations, which have not previously been reported for any combination of materials through UC without a postprocess heat treatment. Additionally, microstructural features contributing to diffusion and the bonding mechanisms are discussed as well as an analysis to determine the governing type of diffusion at the measured UC temperature and grain size range is presented.
II. PROCEDURE
A. Material selection
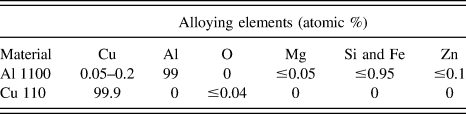
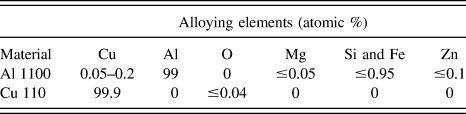
Commercially pure aluminum (Al 1100) and copper (Cu 110) were selected to provide a minimum of 99% pure aluminum and copper as shown in Table I. Additionally, copper was selected in preference to a different dissimilar metal because copper has a similar activation energy to that of aluminum for atomic diffusion. Reference Brandes and Brook17
Elemental compositions of Al 1100 and Cu 110.
B. Sample preparation
An aluminum foil (0.5 × 10 × 152 mm) was welded to a copper foil (0.5 × 12.7 × 152 mm) with the UC process parameters (of 39.4 MPa pressure, 22.88 μm amplitude, and 25.4 mm/s speed). The aluminum foil was placed on top of the copper foil because aluminum has a lower yield stress than copper and should readily deform. Copper placed on top of the aluminum would be expected to bond differently or need different processing conditions due to the acoustic softening in copper being different than aluminum. A FLIR SC6200 infrared camera (Wilsonville, OR) was utilized to measure the temperature during the welding process.
After welding, the sample was cut with a diamond saw and polished from 60 grit grinding paper to a final step using 3-µm alumina polishing media. A Zeiss Auriga focused ion beam (FIB) was used to prepare TEM samples, which provided a significantly more uniform thickness sample compared to other TEM sample preparation methods. This was crucial for the XEDS linescan because the relative intensity data are impacted by the sample thickness.
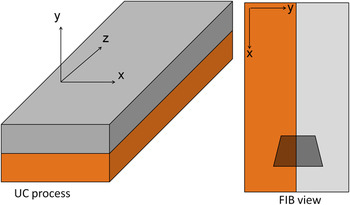
A trapezoid (approximately 20- and 30-µm wide at each base, 30 µm in height, and a depth of 10 µm into the sample) was milled into the sample at the Al–Cu weld interface with a milling current of 20 nA. Figure 2 illustrates the position of the trapezoid relative to the UC directions, with x representing the width of the foils, y the height of the foils, and z the length in the rolling direction.
Schematic illustrating the UC processing orientation and FIB view.

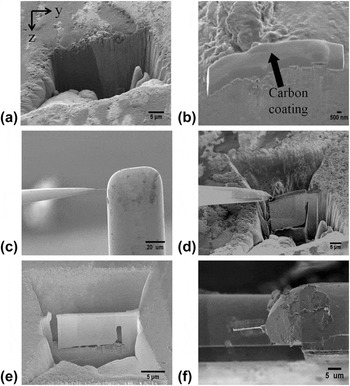
After the large trapezoid was milled, a lower current of 600 pA was used to provide a very smooth, clean surface as shown in Fig. 3(a). Next, the gas injection system (GIS) was used to provide a protective coating on the top surface of the sample to prevent the top surface from deteriorating to the point where the TEM sample would not be able to be picked up by the OmniProbe at a later step. A 1.5-µm thick layer of carbon was deposited on the top surface centered above the Cu–Al interface as shown in Fig. 3(b).
Preparation of a TEM sample utilizing the FIB: (a) large trapezoid at the Al–Cu interface, (b) protective coating on the top surface of the TEM region of interest, (c) second trapezoid and edges milled to leave only a small region attached to the bulk, (d) attachment of the OmniProbe, (e) attachment of the sample to the TEM grid, (f) thinning of the sample to approximately 100 nm.

A second trapezoid was milled at 20 nA on the opposite side of the first trapezoid, leaving approximately 3 µm between the two trapezoids. The sample was thinned to approximately 1 µm through further milling at lower currents of 1 nA or 600 pA. Then bottom side of the TEM sample is milled at an angle of 6° as well as the entire left side and three quarters of the right side. This leaves only the upper right corner of the sample attached as seen in Fig. 3(c).
The GIS was used to weld the OmniProbe to the upper left corner of the sample and the remaining region attached to the bulk sample was milled off as shown in Fig. 3(d). After lifting the sample away from the bulk it was welded with carbon using the GIS to the TEM grid and the tip of the OmniProbe was milled off as shown in Fig. 3(e). Finally, the sample was thinned to approximately 100 nm, which is illustrated in Fig. 3(f).
C. TEM XEDS procedure
A transmission electron microscopy (TEM; model JEM 2010F, JEOL, Tokyo, Japan) was used at an accelerating voltage of 200 keV and a magnification of 40 kx to conduct an XEDS linescan across the Al–Cu interface. A collection of 200 points were taken with a dwell time of 3000 ms. The x-ray intensities were converted to concentrations utilizing the zeta factor method. This data reduction technique has major advantages over the Cliff–Lorimer ratio method, including the use of pure element standards and independence from acquisition time, beam current, and sample thickness. Reference Watanabe and Williams18 The zeta (ζ) factors for pure element thin films were determined from k-shell spectra at the National Institute of Standards and Technology, and the factors for aluminum and copper are 1510.2 and 2163.4 respectively. Reference Williams and Carter19
III. RESULTS
A. Microstructural features
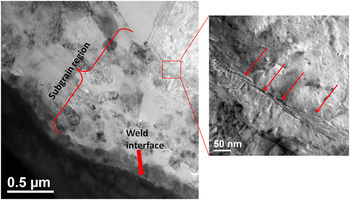
Figure 4 shows an approximately 1-µm wide band of subgrains that formed on the aluminum side parallel to the weld interface. As mentioned earlier, the formation of subgrains during UC has previously been reported, however the insert in Fig. 4 shows a new microstructural feature. The arrows point to a thin band of dislocations oriented parallel to one another and perpendicular to the weld interface that is located between the subgrain and bulk aluminum interface. This microstructural feature provides further supporting evidence of the subgrain formation through the CDRX process, since the dislocation rearrangement is a precursor to the subgrain formation.
TEM image showing subgrain formation on the aluminum side and dislocation pile-up between the subgrain and bulk aluminum interface.

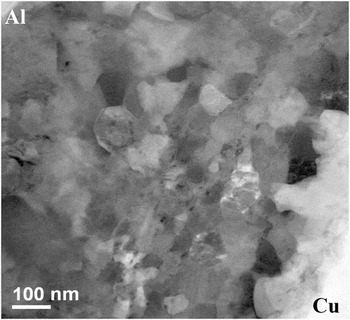
A high angle annular dark field (HAADF) scanning transmission electron microscopy (STEM) image is shown in Fig. 5. From this figure, the subgrain size ranges from approximately 20 to 50 nm, which will be utilized to calculate the apparent diffusion coefficient.
HAADF STEM image showing subgrain formation on the aluminum side of the interface.

B. Time and temperature results
The time was calculated by dividing the contact length of the horn (5.3 mm) by the speed of the horn during UC, which equaled 0.21 s. The maximum temperature during the weld was found to be 493 °C ± 10 °C. This temperature was significantly higher compared to aluminum–aluminum (alloy 6061 T6) temperatures measured for UC at a wide range of process parameters, which were on the order of 200 °C. Reference Koellhoffer, Gillespie, Advani and Bogetti20 Aggressive process parameters were necessary to create a good bond for this combination of materials and foil geometries leading to higher processing temperatures.
C. TEM concentration profiles
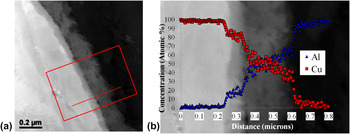
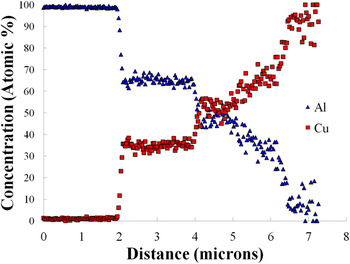
The concentration profile for the line shown in Fig. 6(a) is shown in Fig. 6(b). Figure 6(a) appears to show phase transformations from the contrast changes at the interface, indicative of a change in the material density. It is clear from the concentration profile in Fig. 6(b) that phase changes are occurring across the Cu–Al interface by the relatively flat regions between sharp changes in the concentrations rather than a gradual, continuous curve.
(a) Linescan across the Cu–Al interface and (b) concentration profile overlaid on the micrograph.

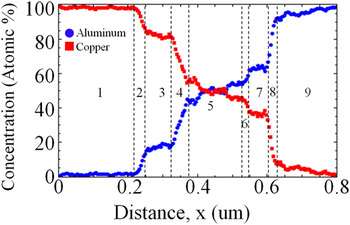
The steep slopes and flatter regions indicating a phase change which is much more apparent when a moving average of five data points is used to reduce some of the noise as shown in Fig. 7. It is even clearer with Fig. 7 that the odd-numbered regions indicate regions with a phase transformation, whereas the even-numbered regions signify a sharp transition between phases.
Concentration profile with a moving average of every five data points.

IV. DISCUSSION
Based upon the concentrations measured through XEDS and the Cu–Al phase diagram, the expected phases are CuAl, CuAl2, and a supersaturated copper-rich solid solution or metastable phase with an 80 atomic percent copper concentration. Two of these phases (CuAl and CuAl2) agree with the literature for copper/aluminum intermetallics formed through other welding processes including friction stir welding (FSW) Reference Abdollah-Zadeh, Saeid and Sazgari21–Reference Ouyang, Yarrapareddy and Kovacevic23 and explosive welding. Reference Paul, Lityńska-Dobrzyńska and Prażmowski24 Instead of the 80 atomic percent copper phase, the FSW and explosion welding reported the Cu9Al4 phase formed. A reason for this discrepancy is that the FSW and explosion welding processes generally involve longer timeframes, allowing more time for the stable phase transformations to occur. For example, Zhu and Chao Reference Zhu and Chao25 conducted friction stir welds at velocities of 1.693 mm/s, which is 15 times slower than the velocity used in this study.
When an ultrasonically consolidated sample is annealed, however, the Cu9Al4 phase is formed. This was confirmed through x-ray diffraction on a 350 °C, 10-min annealed Cu–Al sample manufactured through UC by Troug. Reference Troug26
To independently confirm the phases for an annealed UC Cu–Al sample utilizing the same TEM XEDS procedure, a sample was ultrasonically welded with an applied load of 28.2 MPa pressure, amplitude of 28.5 µm, and speed of 25.4 mm/s. Then the sample was annealed at 450 °C for 1 h to alloy sufficient time for phase transformation to occur and was quenched in an ice water bath. The TEM sample was prepared using the same FIB procedure and a linescan was conducted in the same manner as previously described, and the resulting concentration profile is shown in Fig. 8.
Concentration profile for a 1 h, 450 °C annealed Cu–Al sample.

The concentrations shown in Fig. 8 for the annealed sample agree with the literature for the atomic ratios of the stable intermetallic phases: Cu9Al4, CuAl, and CuAl2. Additional research still needs to be conducted including selected area electron diffraction (SAED) to confirm to presence of the metastable phase or supersaturated solid solution that formed during UC without any subsequent heat treatment.
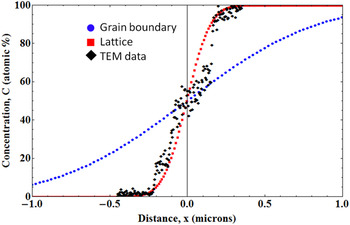
The one-dimensional concentration independent solution to Fick's second law was used to compare the bulk and grain boundary concentration profiles assuming no phase transformations and the experimentally measured time and temperature of 0.21 s and 493 °C. The activation energies and preexponential values for bulk and grain boundary diffusion of copper in aluminum are 136 kJ/mol and 0.65 cm2/s Reference Brandes and Brook17 and 97.4 kJ/mol and 0.045 cm2/s (with a grain boundary width of 1 nm) Reference Chamberlain and Lehoczky27 respectively, which were used to generate the grain boundary and lattice diffusion curves in Fig. 9. The TEM XEDS profile appears similar to the bulk diffusion curve as shown in Fig. 9. The close proximity of the TEM XEDS data to the bulk diffusion curve is surprising, considering the short welding times for UC and a more in depth analysis is necessary.
TEM XEDS concentration profile in relation to bulk and grain boundary diffusion curves without considering phase transformations.

With a spot size of approximately 1 nm, the concentration changes and phase transformations occurred within the grains rather than only at the grain boundaries. This indicates that grain boundary diffusion is not the sole diffusion mechanism occurring even though the final grain size is small and the activation energy for grain boundary diffusion is lower than lattice diffusion. The welding temperature, however, is high so the temperature in combination with the small grain size needs to be considered.
Equation (1) from Porter and Easterling Reference Porter and Easterling13 assumed the ratio of the grain boundary width to grain size (δ/d) was small. Considering the subgrains are less than 1 µm, the assumption might not be valid so the apparent diffusion coefficient with the full cross sections is used and is shown in Eq. (2).
 $$D_{{\rm{apparent}}} = D_{{\rm{lattice}}} {d \over {d + \delta }} + D_{{\rm{grain}}\;{\rm{boundary}}} {\delta \over {d + \delta }}\quad .$$
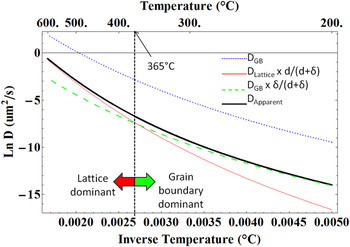
D lattice and D grain boundary utilize the values referenced earlier from Brandes and Brook Reference Brandes and Brook17 and Chamberlain and Lehoczky, Reference Chamberlain and Lehoczky27 δ is the grain boundary width of 0.5 nm, and d is the grain size. The critical temperature can be defined as the temperature at which the lattice and grain boundary diffusion curves intersect. With grain sizes ranging from 20 to 50 nm as illustrated in the TEM micrograph of Fig. 5, the critical temperatures are 467 and 365 °C respectively. The experimentally measured temperature was 493 °C, so lattice diffusion provides a larger contribution than grain boundary diffusion at these grain sizes. The 50 nm grain size analysis is illustrated in Fig. 10. To the left of the critical temperature, the apparent diffusion is close to the lattice diffusion curve and therefore, lattice diffusion is dominant over grain boundary diffusion and to the right of the critical temperature, grain boundary diffusion is dominant. This analysis provides independent support for lattice diffusion at the temperature and grain sizes measured for the ultrasonically consolidated sample and is independent of time.
Illustration of the critical temperature for a grain size of 50 nm.

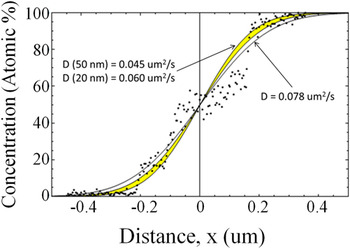
The calculated apparent diffusion coefficient terms range from 4.5 × 10⁻¹⁰ to 6 × 10⁻¹⁰ cm2/s for 50 and 20 nm grain sizes, respectively. These values are a slightly under the best fit diffusion coefficient for the TEM data of 7.8 × 10⁻¹⁰ cm2/s, and the curves are illustrated in Fig. 11. This discrepancy can partially be attributed to fitting a continuous sigmoidal curve to a step function indicating the phase changes. Additionally, these concentration profiles were calculated utilizing the maximum welding temperature and the time that the sonotrode is in direct contact with the foil surface, however diffusion will continue at a much slower rate upon cooling. Therefore the apparent diffusion coefficient between 20 and 50 nm grain sizes is likely to underpredict the actual concentration curve which is in agreement with Fig. 11.
Apparent diffusion curves for 20–50 nm (highlighted yellow region) compared to the experimental TEM data.

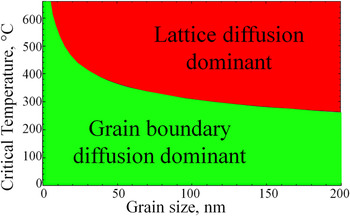
Considering UC temperatures can generally be much lower, it is of interest to determine the critical temperature as a function of grain size. Figure 12 can be utilized to estimate when grain boundary or lattice diffusion dominates at a specific temperature and grain size for Al–Cu. The figure illustrates that in general lattice diffusion is dominant at higher temperatures which is due to the large increases in the vacancy concentration. At smaller grain sizes, the critical temperature is increased due to a larger number of diffusion pathways around the small grains.
Critical temperature as a function of grain size to illustrate when lattice or grain boundary diffusion contributes more toward the apparent diffusion coefficient.

It is important to note that in other low-temperature cases grain boundary diffusion may occur during UC, and these results should not be generalized for other samples welded through UC. Other material and process parameters play an important role in determining the temperatures, and therefore the type of diffusion. In the case of aluminum–aluminum welds, which would require using isotopes to measure diffusion, the processing temperatures are generally lower than a copper–aluminum welding temperature, which suggests grain boundary diffusion would be more likely.
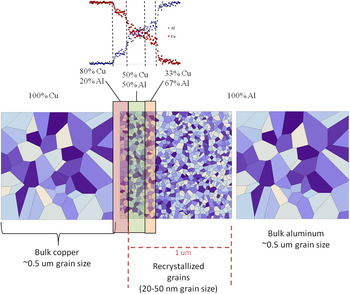
An overview of the final microstructure is illustrated in Fig. 13 in relation to the measured TEM concentration profile. The subgrain size is 20–50 nm as seen earlier in Fig. 5. This subgrain extends well beyond the Cu–Al interface into the pure aluminum side for a total distance of 1 µm, whereas the total diffusion distance is approximately 400 nm.
Schematic of length scales at the Al–Cu interface.

V. CONCLUSIONS
This article provided the methodology to determine UC concentration profiles for a bimaterial weld and the means to determine the main type of diffusion occurring. Additionally, phase transformations were reported for the first time for an ultrasonically consolidated Cu–Al sample without any subsequent heat treatment. The concentration profile as well as the contrast changes shown in the images indicated three phase transformations occurred during the welding process. From XEDS measurements, the expected phase changes are CuAl, CuAl2, and a metastable phase or supersaturated solid solution. SAED or other diffraction analysis still needs to be conducted to confirm these phases as well as an in-depth thermodynamic study. Upon a postprocess diffusion anneal, the more stable Cu9Al4 phase forms rather than the metastable copper-rich phase.
An approximately 1-µm wide recrystallization zone was observed on the aluminum side of the sample with a grain size of approximately 20–50 nm, which extended well beyond the total diffusion zone of approximately 400 nm. Dislocation pile-up was observed at the interface between the recrystallized zone and the bulk aluminum, which shows additional supporting evidence of the CDRX process as a bonding mechanism for UC.
Bulk diffusion appeared to be dominant over grain boundary diffusion, which was further supported by an apparent diffusion coefficient analysis. The critical temperatures for the 20–50 nm range were calculated to be 457 and 365 °C, which were both lower than the experimentally measured temperature of 493 °C indicating bulk diffusion was dominant over grain boundary diffusion.
ACKNOWLEDGMENTS
The authors would like to thank Dr. C. Ni, Dr. F. Deng, and Dr. J. Sloppy for their helpful discussions and the use of the instruments in the W. M. Keck Electron Microscopy Facility at the University of Delaware.
Research was sponsored by the Army Research Laboratory and was accomplished under Cooperative Agreement Number W911NF-06-2-011. The views and conclusions contained in this document are those of the authors and should not be interpreted as representing the official policies, either expressed or implied, of the Army Research Laboratory or the U.S. Government. The U.S. Government is authorized to reproduce and distribute reprints for Government purposes notwithstanding any copyright notation hereon.