


Introduction
Methanesulphonic acid (MSA) is an oxidation product of marine dimethylsulphide (DMS) emissions. In the Southern Ocean, seasonal sea-ice variations strongly influence marine microbial productivity, and thus DMS production (Reference Curran and JonesCurran and Jones, 2000). As a result, ice-core records of MSA have been used as a proxy of regional sea-ice extent (Reference Curran, van Ommen, Morgan, Phillips and PalmerCurran and others, 2003), allowing the extension of the sea-ice extent time history into the pre-satellite era at a resolution dependent on the ice core. After deposition, MSA is known to migrate vertically (Reference CurranCurran and others, 2002), with the redistribution being controlled by the ionic nature of the seasonal deposition bands. For a high-accumulation site such as Law Dome, Antarctica, this vertical migration will be relatively small, especially in the upper regions of the core (Reference Smith, van Ommen and CurranSmith and others, 2004), and it is therefore neglected in this analysis. In addition, if the core is stored for several years before measurement, MSA will be lost from the exposed surfaces, with the diffusion of MSA in solid ice governing the rate of loss. Knowing the diffusion coefficient of MSA in solid ice is critical to correct for any storage loss before using MSA as an environmental proxy.
Law Dome is a small ice cap centred at 66°40′ S, 112°50′ E, and is separated from the main East Antarctic ice sheet by the Totten–Vanderford glacier system, resulting in independent flow for Law Dome (Reference Morgan, Wookey, Li, van Ommen, Skinner and FitzpatrickMorgan and others, 1997). Law Dome is a high-accumulation site with up to 1.2 m ice equivalent on the eastern side of the dome (Reference Morgan, Wookey, Li, van Ommen, Skinner and FitzpatrickMorgan and others, 1997). The associated high temporal resolution of ice cores drilled at Law Dome makes it an ideal site to study historical trends in MSA concentration.
The two ice cores analysed in this study, DSS43A and DSS99, were drilled in January 1988 and February 2000, respectively. DSS43A was thermally drilled at a site ∼4.6 km south-southwest of the highest point of the dome (Reference Morgan, Wookey, Li, van Ommen, Skinner and FitzpatrickMorgan and others, 1997), while DSS99 was drilled ∼100 m south of DSS43A using an electromechanical drill. Table 1 gives details of these two cores. The average accumulation rate over the past 50 years for the drill sites is 0.7 m a−1 ice equivalent.
Details of the two ice cores analysed

MSA Concentration Measurements
The spatial variation of MSA (see below) in core DSS43A was analysed using the MSA measurements of Reference Smith, van Ommen and CurranSmith and others (2004). The nomenclature for DSS43A samples from Reference Smith, van Ommen and CurranSmith and others (2004) is retained herein; in particular, there were three sections of core tested (test 1, test 2 and test 3), each with multiple ice sticks per test (A–C for test 1, A–H for test 2 and I–K for test 3), with each stick being cut into individual samples (1–6 for tests 1 and 2 and 1–12 for test 3) to allow for profiling of the MSA concentration across the core. Details of DSS99 sample preparation and MSA measurement are given below.
Collection of clean samples for ionic analysis is described elsewhere (Reference Curran and PalmerCurran and Palmer, 2001). Cores were stored horizontally in polythene, sealed from the external atmosphere. A 32 mm square stick was cut from each core using a bandsaw, and clean sampling of 5 cm intervals was undertaken in a laminar flow hood at −20°C using a stainless-steel microtome blade. The samples were analysed according to Reference Curran and PalmerCurran and Palmer (2001), with the following variations. Samples were analysed on an ICS3000 microbore ion chromatograph (Dionex®) rather than the DX500 model used previously. The DX500 eluent stream was provided by manually preparing appropriate concentration solutions of Na2B4O7 as the anion carrier, while eluent is automatically generated in the ICS3000, with cartridges of the appropriate eluent concentrate (KOH for anion separation) manufactured commercially. Automatic eluent generation removes one avenue for both eluent contamination and human error. Anion separation was achieved using the AS18 anion-exchange column (Dionex®), rather than the AS14, producing more effective separation of the MSA and Cl peaks.
For DSS99, the core was sectioned longitudinally into two halves after 6 months storage. One half was analysed immediately, while the corresponding sections from the second half-core were analysed after an additional 7 years 2 months of storage (see Table 3 for core depths). The time between cutting the sticks and analysis was kept to a minimum (no more than 6 days) to minimize the loss of MSA from the freshly cut surfaces.
Numerical Methods
It is assumed that the MSA concentration distribution in a stored ice core will be governed by losses on the exposed surfaces, and that there is negligible MSA mass flux along the main axis of the core, due to the limited post-depositional movement at Law Dome. Therefore, the concentration, ϕ, can be modelled by a two-dimensional (2-D) diffusion equation, specifically

with time t, spatial coordinates x and y and diffusion coefficient D. Equation (1) was solved numerically using a finite-volume discretization in space and a finite-difference discretization in time. Dirichlet boundary conditions (Reference PressPress, 2007) of zero concentration on exposed surfaces were imposed. This assumes that the effective diffusion coefficient (taking into account mixing processes, etc.) for MSA in air is sufficiently large and that the concentration of MSA in the surrounding air remains low enough to keep the surface concentration of MSA at zero.
Grid independence
The maximum time-step that can be taken in the numerical solution of Equation (1) is limited by stability considerations (see, e.g., Reference PatankarPatankar, 1980) to

where Δt max is the maximum stable time-step for spatial resolutions of Δx and Δy. Accuracy considerations may reduce the acceptable time-step for the numerical solution of Equation (1) to below that given by Equation (2).
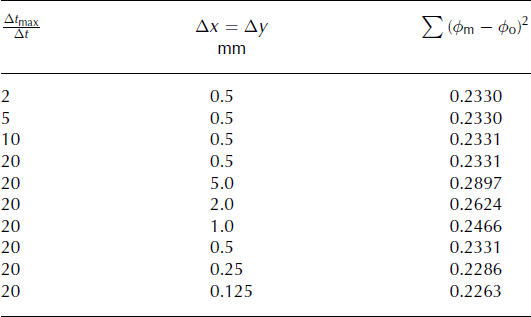
The model sensitivity to Δx, Δy and Δt max/Δt was assessed against the Reference Smith, van Ommen and CurranSmith and others (2004) test 3 observational results (samples 2–11 of sticks I–K; see Fig.1 for geometry), and is summarized in Table 2. Using the criteria of <2% change in the sum of the square of the residuals for a resolution doubling, a grid size of Δx = Δy = 0.25 mm and a step size, Δt, 1/20 of Δt max for that resolution were used for the rest of the simulations. In addition, the temporal and spatial grid sensitivity was checked for the temporal MSA variation problem (see below) and the result was found to be grid-independent for a doubling in either the temporal or spatial resolution.
Spatial MSA calculations. (a) Geometry of DSS43A core cross-section, showing position of Reference Smith, van Ommen and CurranSmith and others (2004) test 3 sample 1–12 locations; the average of samples 8–10 (shaded) is used to normalize the MSA concentrations (see text for details). (b) Typical normalized MSA concentration distribution; the 0.0, 0.1, 0.2, 0.3, 0.4, 0.5, 0.6, 0.7, 0.8 and 0.9 normalized MSA concentration contours are shown.

Spatial and temporal grid sensitivity for the numerical solution of the 2-D diffusion equation. Sum of the square of the residuals of the numerical model normalized MSA predictions, ϕ m, compared to the normalized observed MSA concentrations, ϕ o (Reference Smith, van Ommen and CurranSmith and others, 2004, for test 3, sticks I–K, samples 2–11) as a function of the temporal, Δt max/Δt, and spatial, Δx and Δy, resolutions
Spatial MSA Profiles
Reference Smith, van Ommen and CurranSmith and others (2004) conducted three tests for MSA concentration distributions across an ice core. The across-core resolution of tests 1 and 2 was 30 mm, while test 3 had a resolution of 5 mm. The relatively coarse resolution of tests 1 and 2 resulted in only the sample at each end of the stick having a MSA concentration significantly different from the concentration in the inner core. As there is no information on the temporal variation of MSA concentration in this core, the only way to calculate the diffusion coefficient for MSA in ice is to use the spatial distribution, and, in essence, there are only three values per stick (a core value and two outer values). In addition, the surface of the samples had a small, but unspecified, amount of the surface removed to minimize contamination. This is especially problematic for the outer values because these outer measurements are where the concentration varies the most rapidly (Fig. 1), and uncertainty in position has the greatest influence.
The test 3 samples of Reference Smith, van Ommen and CurranSmith and others (2004), however, provide high spatial resolution across the core, resulting in a much more continuous distribution of concentration measurements (although they are offset laterally towards the edge of the core; see Fig. 1). In addition, there are enough samples per stick that the two samples (1 and 12) subject to edge effects can be neglected. Three adjacent sections were used for the three sticks I, J and K, with depths ranges of 76.15–76.19, 76.19–76.23 and 76.23–76.27 m, respectively. The individual samples are parallelograms shaped to match the exterior chord (see Fig. 1a).
To reduce the influence of variations in MSA concentration along the length of the core, all observed MSA concentrations were normalized by the average concentration of samples 8–10 (shaded area in Fig. 1a) on a per-stick basis. An average value was used rather than a single concentration value, to reduce the impact of anomalous measurements. The same normalization procedure was applied to all modelled concentration distributions when comparing them to observations.
The sensitivity of the calculated ϕ distributions to D was calculated using a finite-difference method, and the value of D that minimized the difference with the Reference Smith, van Ommen and CurranSmith and others (2004) test 3 results (in a least-squares sense) was calculated using a singular value decomposition (see Fig. 2). The calculated best estimate of the diffusion coefficient of MSA in ice is (4.0 × 10⁻¹³) ± (1.2 × 10⁻¹³) m2 s−1.
Comparison between optimal modelled MSA concentration distribution (solid curve) and observations of Reference Smith, van Ommen and CurranSmith and others (2004) test 3 (points). Note that MSA concentrations have been normalized (on a per-stick basis) by the average of samples 8–10.

Temporal MSA Variations
The DSS99 core offers an independent check on the diffusion coefficient for MSA in ice calculated above. In particular, there are two MSA measurements for each location along the core length, temporally separated by 7 years 2 months. The core was initially sampled (by sectioning in half) 6 months after being drilled. At this stage there had been insignificant diffusion of MSA in the sampling region (see Fig. 3) and the measured value is a true indication of the in situ MSA concentration. The remaining section of the core was stored an additional 7 years 2 months before sampling and analysing for MSA concentration. The later MSA concentration measurement was normalized by the corresponding initial MSA concentration measurement to give a MSA concentration ratio relative to the initial concentration.
Relative MSA concentration in DSS99 cores after 6 months storage. Shown are 0, 0.2, 0.4, 0.6, 0.8 and 1.0 concentration contours and a typical sample stick (outer dashed lines). A typical sample volume after cleaning by microtome under laminar flow is also shown (inner dashed lines).

This time history was modelled by considering the sectioned core geometry, and applying a Neumann boundary condition of zero MSA flux across the core diameter for the first 6 months, and the application of the zero-concentration boundary condition thereafter. A least-squares estimate of the MSA diffusion coefficient, based on 53 repeated MSA concentration measurements in the DSS99 core, is (4.1 × 10⁻¹³) ± (2.5 × 10⁻¹⁴) m2 s−1 (see Table 3 for details).
Loss of MSA in the DSS99 core during storage. Both the measured and calculated ratios are the MSA concentration 7 years 2 months after sectioning the core divided by the MSA concentration when the core was sectioned. The calculated ratio is based on a diffusion coefficient of 4.1 × 10⁻¹³ m2 s−1

Discussion
The two independent estimates of the diffusion coefficient calculated are very close, and within the standard error estimates. The estimate derived from the temporal MSA variations, namely (4.1 × 10⁻¹³) ± (2.5 × 10⁻¹⁴) m2 s−1, is more robust due to both the decreased sensitivity to geometric uncertainties and a greater number of measurements for the least-squares estimation. Overall, the standard error for the estimate based on the temporal variations is a factor of 4.8 smaller than the associated standard error for the spatial variation estimate. The estimated diffusion coefficient is valid for a nominal storage temperature of −20°C; no data were available to the authors to allow for the estimation of the temperature sensitivity of the diffusion coefficient.
The diffusion coefficient calculated in this study is approximately double the value (2 × 10⁻¹³ m2 s−1) found by Reference Smith, van Ommen and CurranSmith and others (2004). They treated the section as a radial profile and hence used a one-dimensional diffusion analysis. The treatment here shows that the offset chord and corner effects (see Fig. 1) require consideration of two spatial dimensions. In addition, the analysis of Reference Smith, van Ommen and CurranSmith and others (2004) included samples at the outer surface of the ice core, which has an unknown amount of material scraped from the surface during sample preparation. This would result in an underestimation of the diffusive path length for these samples, and hence an underestimation of the diffusion coefficient implied by the observed MSA concentration for these outer samples.
The two estimates of the MSA diffusion coefficient calculated herein were derived from a thermally drilled core and an electromechanically drilled core. The close agreement of the two MSA diffusion coefficient estimates therefore suggests there is no noticeable influence of thermal coring on MSA distribution. Changes in the outer 10 mm of the core cannot be ruled out, since this region was explicitly excluded from the analysis of the spatial variation data (thermal core) due to this region having the highest MSA gradient and the geometric uncertainties associated with sample preparation resulting in large uncertainties in the implied MSA diffusion coefficient.
Implications and recommendations for MSA sampling from ice cores
The MSA diffusion coefficient is relatively large compared to many other common chemical species in ice, such as deuterium (2 × 10⁻¹⁵ m2 s−1 at −10°C) and HNO3 (10−14 m2 s−1 at −15°C) (Reference Wolff, Wolff and BalesWolff, 1996). This has some significant consequences for the long-term storage and sampling of ice cores for MSA content.
The rapid processing of an ice core is the ideal situation, but is rarely possible for a variety of reasons, so strategies to either reduce the variation in MSA loss or account for the loss must be adopted. The time frame for rapid processing depends on the chemical species being analysed; as shown in Figure 3, a sample taken at least 20 mm distant from the outer surface of an ice core will not have lost any MSA after 6 months storage. As binary diffusion is a linear process, this criterion can be generalized for other chemical species, by scaling the allowable storage time by the ratio of the diffusion coefficient of MSA to the diffusion coefficient of the other species. For example, if analysing for HNO3, a sample taken at least 20 mm distant from the outer surface of an ice core will not have lost any HNO3 after 20.5 years (6 months × 4.1 × 10⁻¹³/10−14).
If the criterion of 20 mm within 6 months cannot be met, then one of three strategies should be adopted to either halt the loss of MSA or account for the loss. Firstly, if possible the MSA samples could be thawed and refrozen to stop further deterioration during storage prior to analysis, as found by Reference Abram, Curran, Mulvaney and VanceAbram and others (2008). Secondly, the MSA concentration measurements need to be corrected for the amount of MSA lost. To correct for MSA loss, detailed records of storage geometry and time need to be kept, to allow for a 2-D diffusion calculation for the storage duration. The results of such a calculation are given in Table 3, showing that a 116 mm core sectioned in half will lose ∼35% of its MSA over 7 years. Finally, if the entire core to be sampled has been stored such that the samples to be analysed for MSA can all be taken from the same area of the cross-section, with a similar storage time (relative to the total storage time), then the percentage MSA loss is likely to be the same for all the samples, and therefore the relative MSA concentrations will be correct.
Regardless of the core storage time, or the method of accounting for the loss of MSA, care should be taken with the preparation of the samples for analysis. Specifically, to minimize the loss of MSA from a freshly cut ice stick, the time between stick cutting, sample cleaning and analysis should be as short as possible.
As rapid throughput of samples is not always possible, it is recommended that an efficient sample collection system is incorporated with older cores such that cores are cut, sampled and analysed in batches. This would allow the MSA loss calculations to be performed for each batch of cores, reducing the number of calculations required.
Acknowledgements
This work was supported by the Australian Government’s Cooperative Research Centres Programme through the Antarctic Climate and Ecosystems Cooperative Research Centre (ACE CRC). I. Allison, G. Hyland, K. Kreutz, K. Michael and an anonymous reviewer provided helpful reviews of the manuscript.



